Pine Island, MN Map & Demographics
Pine Island Map
Pine Island Overview
$38,479
PER CAPITA INCOME
$117,005
AVG FAMILY INCOME
$85,500
AVG HOUSEHOLD INCOME
8.9%
WAGE / INCOME GAP [ % ]
91.1¢/ $1
WAGE / INCOME GAP [ $ ]
0.36
INEQUALITY / GINI INDEX
3,831
TOTAL POPULATION
1,977
MALE POPULATION
1,854
FEMALE POPULATION
106.63
MALES / 100 FEMALES
93.78
FEMALES / 100 MALES
35.4
MEDIAN AGE
3.3
AVG FAMILY SIZE
2.5
AVG HOUSEHOLD SIZE
2,126
LABOR FORCE [ PEOPLE ]
74.8%
PERCENT IN LABOR FORCE
2.3%
UNEMPLOYMENT RATE
Pine Island Zip Codes
Pine Island Area Codes
Income in Pine Island
Income Overview in Pine Island
Per Capita Income in Pine Island is $38,479, while median incomes of families and households are $117,005 and $85,500 respectively.
| Characteristic | Number | Measure |
| Per Capita Income | 3,831 | $38,479 |
| Median Family Income | 881 | $117,005 |
| Mean Family Income | 881 | $122,750 |
| Median Household Income | 1,508 | $85,500 |
| Mean Household Income | 1,508 | $97,066 |
| Income Deficit | 881 | $0 |
| Wage / Income Gap (%) | 3,831 | 8.86% |
| Wage / Income Gap ($) | 3,831 | 91.14¢ per $1 |
| Gini / Inequality Index | 3,831 | 0.36 |
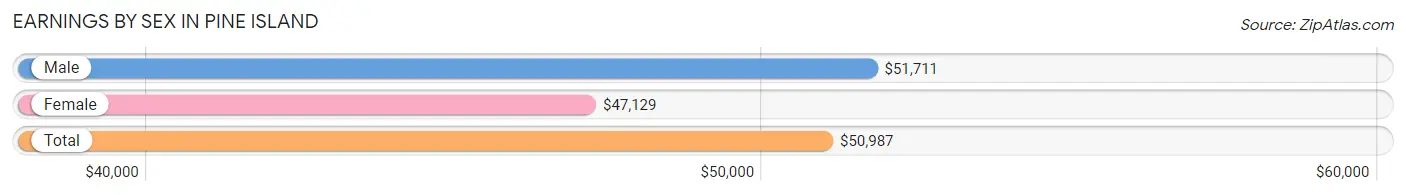
Earnings by Sex in Pine Island
Average Earnings in Pine Island are $50,987, $51,711 for men and $47,129 for women, a difference of 8.9%.
| Sex | Number | Average Earnings |
| Male | 1,194 (53.0%) | $51,711 |
| Female | 1,059 (47.0%) | $47,129 |
| Total | 2,253 (100.0%) | $50,987 |
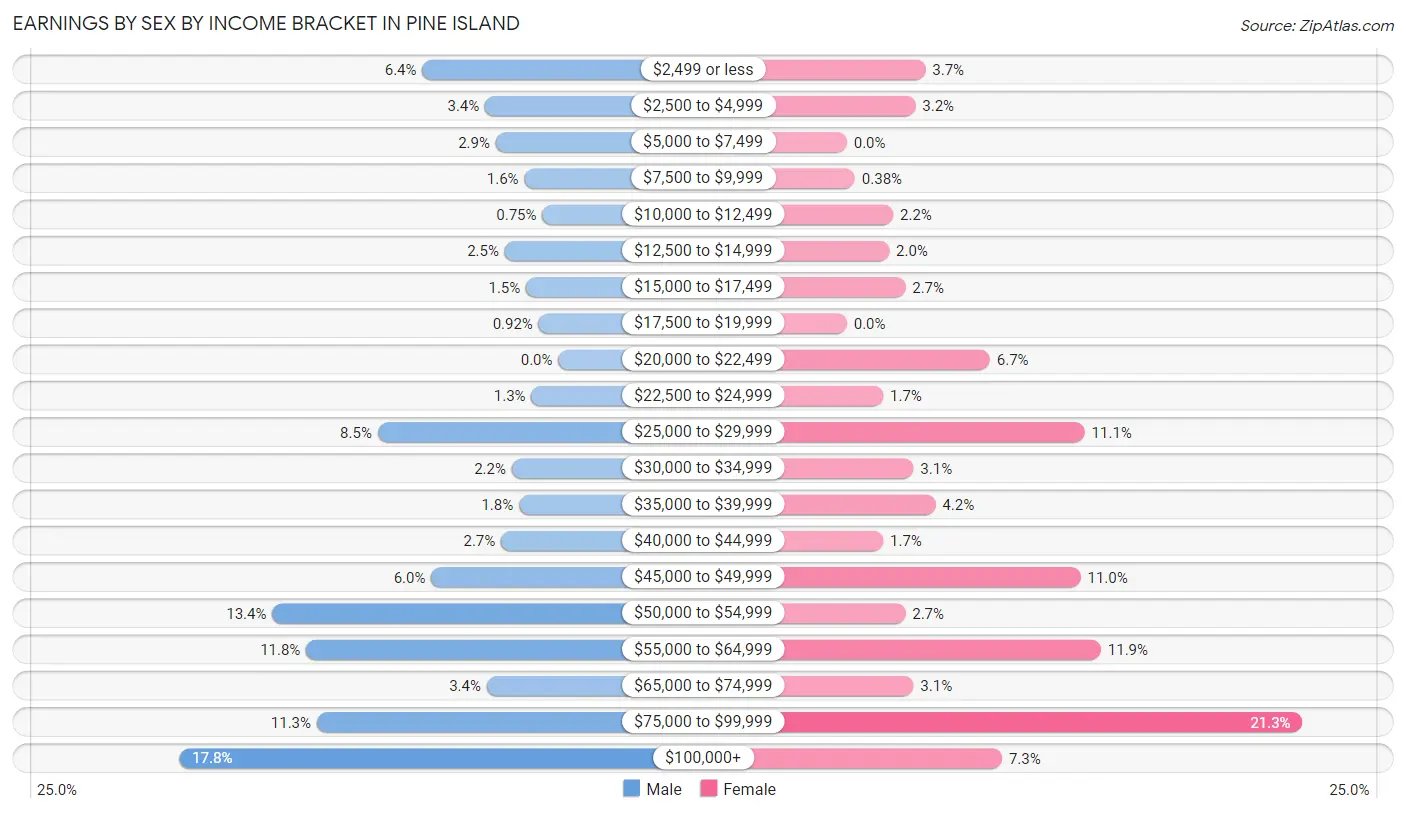
Earnings by Sex by Income Bracket in Pine Island
The most common earnings brackets in Pine Island are $100,000+ for men (212 | 17.8%) and $75,000 to $99,999 for women (226 | 21.3%).
| Income | Male | Female |
| $2,499 or less | 76 (6.4%) | 39 (3.7%) |
| $2,500 to $4,999 | 41 (3.4%) | 34 (3.2%) |
| $5,000 to $7,499 | 35 (2.9%) | 0 (0.0%) |
| $7,500 to $9,999 | 19 (1.6%) | 4 (0.4%) |
| $10,000 to $12,499 | 9 (0.7%) | 23 (2.2%) |
| $12,500 to $14,999 | 30 (2.5%) | 21 (2.0%) |
| $15,000 to $17,499 | 18 (1.5%) | 29 (2.7%) |
| $17,500 to $19,999 | 11 (0.9%) | 0 (0.0%) |
| $20,000 to $22,499 | 0 (0.0%) | 71 (6.7%) |
| $22,500 to $24,999 | 15 (1.3%) | 18 (1.7%) |
| $25,000 to $29,999 | 101 (8.5%) | 118 (11.1%) |
| $30,000 to $34,999 | 26 (2.2%) | 33 (3.1%) |
| $35,000 to $39,999 | 22 (1.8%) | 44 (4.2%) |
| $40,000 to $44,999 | 32 (2.7%) | 18 (1.7%) |
| $45,000 to $49,999 | 71 (5.9%) | 116 (11.0%) |
| $50,000 to $54,999 | 160 (13.4%) | 29 (2.7%) |
| $55,000 to $64,999 | 141 (11.8%) | 126 (11.9%) |
| $65,000 to $74,999 | 40 (3.4%) | 33 (3.1%) |
| $75,000 to $99,999 | 135 (11.3%) | 226 (21.3%) |
| $100,000+ | 212 (17.8%) | 77 (7.3%) |
| Total | 1,194 (100.0%) | 1,059 (100.0%) |
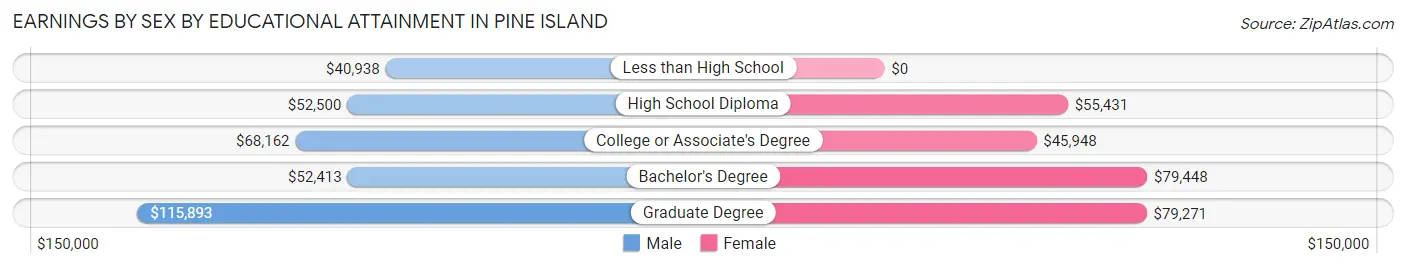
Earnings by Sex by Educational Attainment in Pine Island
Average earnings in Pine Island are $59,000 for men and $54,353 for women, a difference of 7.9%. Men with an educational attainment of graduate degree enjoy the highest average annual earnings of $115,893, while those with less than high school education earn the least with $40,938. Women with an educational attainment of bachelor's degree earn the most with the average annual earnings of $79,448, while those with college or associate's degree education have the smallest earnings of $45,948.
| Educational Attainment | Male Income | Female Income |
| Less than High School | $40,938 | $0 |
| High School Diploma | $52,500 | $55,431 |
| College or Associate's Degree | $68,162 | $45,948 |
| Bachelor's Degree | $52,413 | $79,448 |
| Graduate Degree | $115,893 | $79,271 |
| Total | $59,000 | $54,353 |
Family Income in Pine Island
Family Income Brackets in Pine Island
According to the Pine Island family income data, there are 301 families falling into the $100,000 to $149,999 income range, which is the most common income bracket and makes up 34.2% of all families.
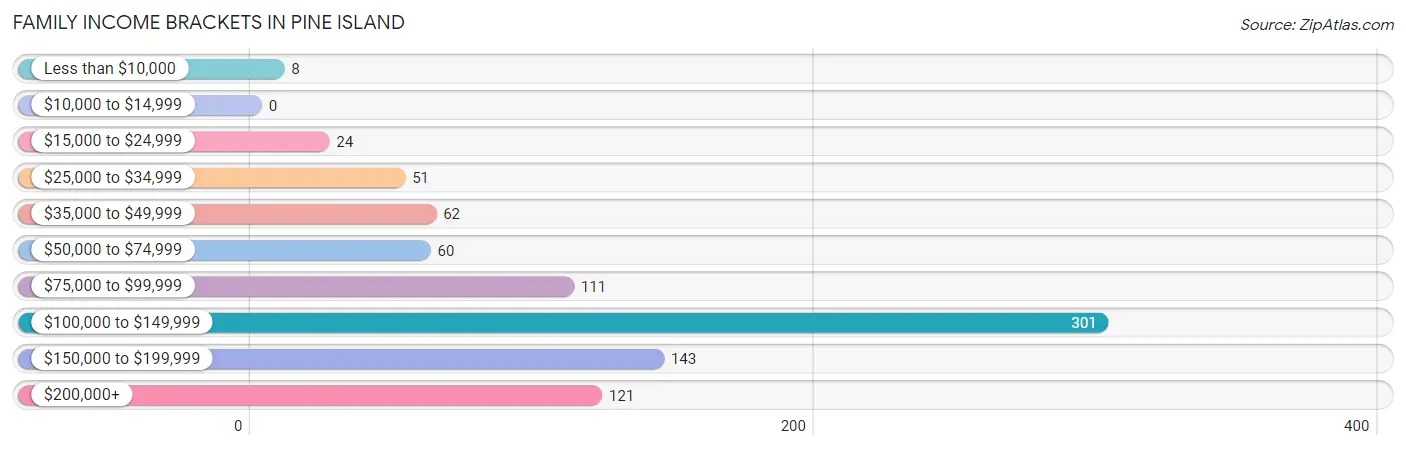
| Income Bracket | # Families | % Families |
| Less than $10,000 | 8 | 0.9% |
| $10,000 to $14,999 | 0 | 0.0% |
| $15,000 to $24,999 | 24 | 2.7% |
| $25,000 to $34,999 | 51 | 5.8% |
| $35,000 to $49,999 | 62 | 7.0% |
| $50,000 to $74,999 | 60 | 6.8% |
| $75,000 to $99,999 | 111 | 12.6% |
| $100,000 to $149,999 | 301 | 34.2% |
| $150,000 to $199,999 | 143 | 16.2% |
| $200,000+ | 121 | 13.7% |
Family Income by Famaliy Size in Pine Island
4-person families (252 | 28.6%) account for the highest median family income in Pine Island with $143,235 per family, while 2-person families (285 | 32.4%) have the highest median income of $61,394 per family member.
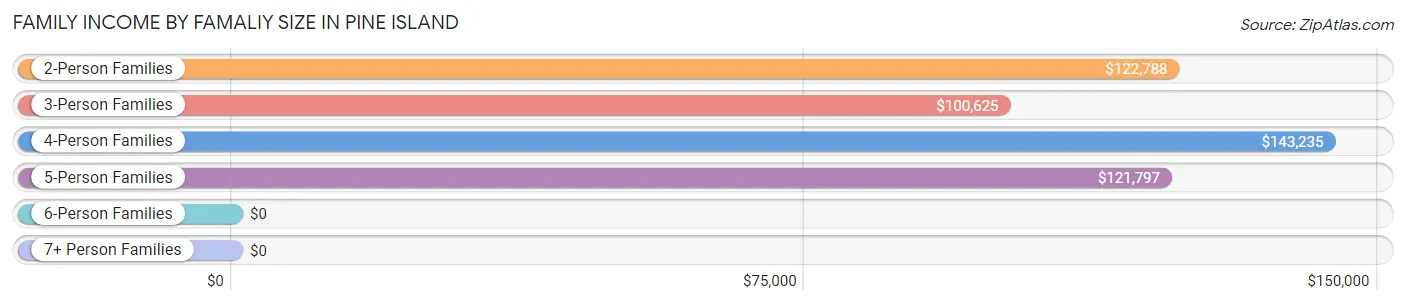
| Income Bracket | # Families | Median Income |
| 2-Person Families | 285 (32.4%) | $122,788 |
| 3-Person Families | 257 (29.2%) | $100,625 |
| 4-Person Families | 252 (28.6%) | $143,235 |
| 5-Person Families | 57 (6.5%) | $121,797 |
| 6-Person Families | 10 (1.1%) | $0 |
| 7+ Person Families | 20 (2.3%) | $0 |
| Total | 881 (100.0%) | $117,005 |
Family Income by Number of Earners in Pine Island
The median family income in Pine Island is $117,005, with families comprising 2 earners (502) having the highest median family income of $141,607, while families with 1 earner (216) have the lowest median family income of $57,237, accounting for 57.0% and 24.5% of families, respectively.
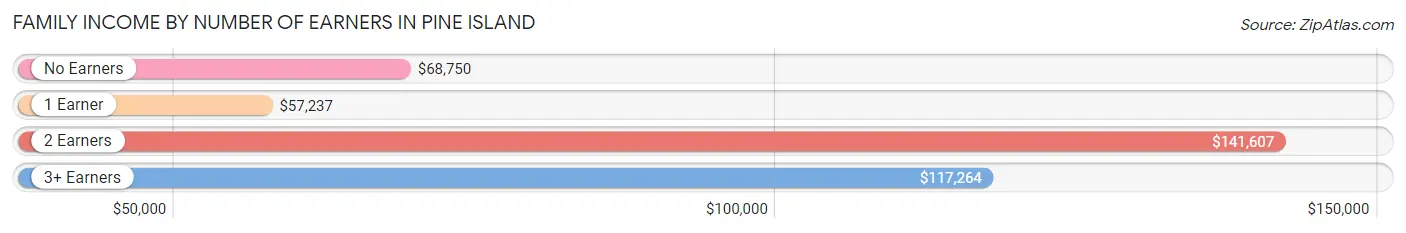
| Number of Earners | # Families | Median Income |
| No Earners | 58 (6.6%) | $68,750 |
| 1 Earner | 216 (24.5%) | $57,237 |
| 2 Earners | 502 (57.0%) | $141,607 |
| 3+ Earners | 105 (11.9%) | $117,264 |
| Total | 881 (100.0%) | $117,005 |
Household Income in Pine Island
Household Income Brackets in Pine Island
With 385 households falling in the category, the $100,000 to $149,999 income range is the most frequent in Pine Island, accounting for 25.5% of all households. In contrast, only 14 households (0.9%) fall into the $10,000 to $14,999 income bracket, making it the least populous group.
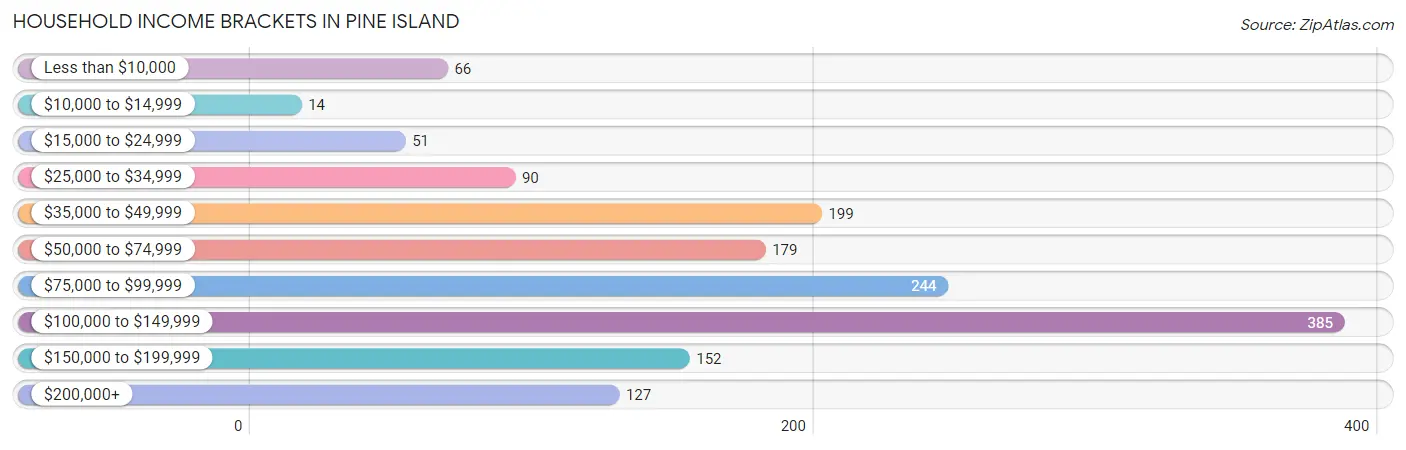
| Income Bracket | # Households | % Households |
| Less than $10,000 | 66 | 4.4% |
| $10,000 to $14,999 | 14 | 0.9% |
| $15,000 to $24,999 | 51 | 3.4% |
| $25,000 to $34,999 | 90 | 6.0% |
| $35,000 to $49,999 | 199 | 13.2% |
| $50,000 to $74,999 | 179 | 11.9% |
| $75,000 to $99,999 | 244 | 16.2% |
| $100,000 to $149,999 | 385 | 25.5% |
| $150,000 to $199,999 | 152 | 10.1% |
| $200,000+ | 127 | 8.4% |
Household Income by Householder Age in Pine Island
The median household income in Pine Island is $85,500, with the highest median household income of $115,389 found in the 45 to 64 years age bracket for the primary householder. A total of 430 households (28.5%) fall into this category. Meanwhile, the 15 to 24 years age bracket for the primary householder has the lowest median household income of $0, with 84 households (5.6%) in this group.
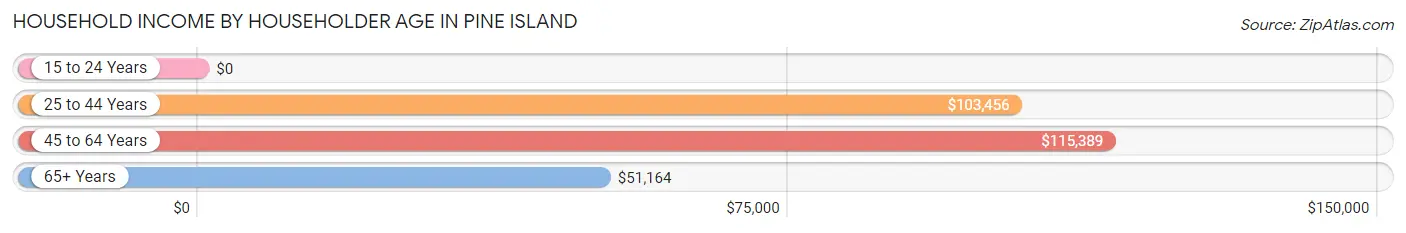
| Income Bracket | # Households | Median Income |
| 15 to 24 Years | 84 (5.6%) | $0 |
| 25 to 44 Years | 685 (45.4%) | $103,456 |
| 45 to 64 Years | 430 (28.5%) | $115,389 |
| 65+ Years | 309 (20.5%) | $51,164 |
| Total | 1,508 (100.0%) | $85,500 |
Poverty in Pine Island
Income Below Poverty by Sex and Age in Pine Island
With 1.7% poverty level for males and 5.7% for females among the residents of Pine Island, 75 year old and over males and 75 year old and over females are the most vulnerable to poverty, with 8 males (13.6%) and 15 females (28.3%) in their respective age groups living below the poverty level.
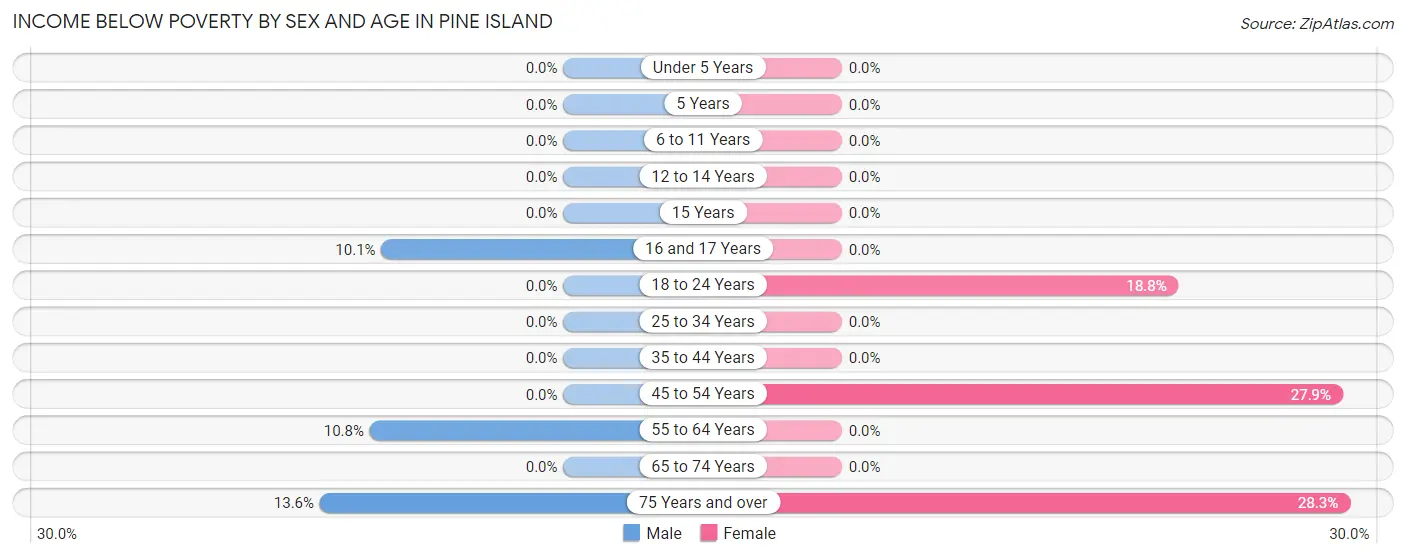
| Age Bracket | Male | Female |
| Under 5 Years | 0 (0.0%) | 0 (0.0%) |
| 5 Years | 0 (0.0%) | 0 (0.0%) |
| 6 to 11 Years | 0 (0.0%) | 0 (0.0%) |
| 12 to 14 Years | 0 (0.0%) | 0 (0.0%) |
| 15 Years | 0 (0.0%) | 0 (0.0%) |
| 16 and 17 Years | 8 (10.1%) | 0 (0.0%) |
| 18 to 24 Years | 0 (0.0%) | 21 (18.8%) |
| 25 to 34 Years | 0 (0.0%) | 0 (0.0%) |
| 35 to 44 Years | 0 (0.0%) | 0 (0.0%) |
| 45 to 54 Years | 0 (0.0%) | 65 (27.9%) |
| 55 to 64 Years | 18 (10.8%) | 0 (0.0%) |
| 65 to 74 Years | 0 (0.0%) | 0 (0.0%) |
| 75 Years and over | 8 (13.6%) | 15 (28.3%) |
| Total | 34 (1.7%) | 101 (5.7%) |
Income Above Poverty by Sex and Age in Pine Island
According to the poverty statistics in Pine Island, males aged under 5 years and females aged under 5 years are the age groups that are most secure financially, with 100.0% of males and 100.0% of females in these age groups living above the poverty line.
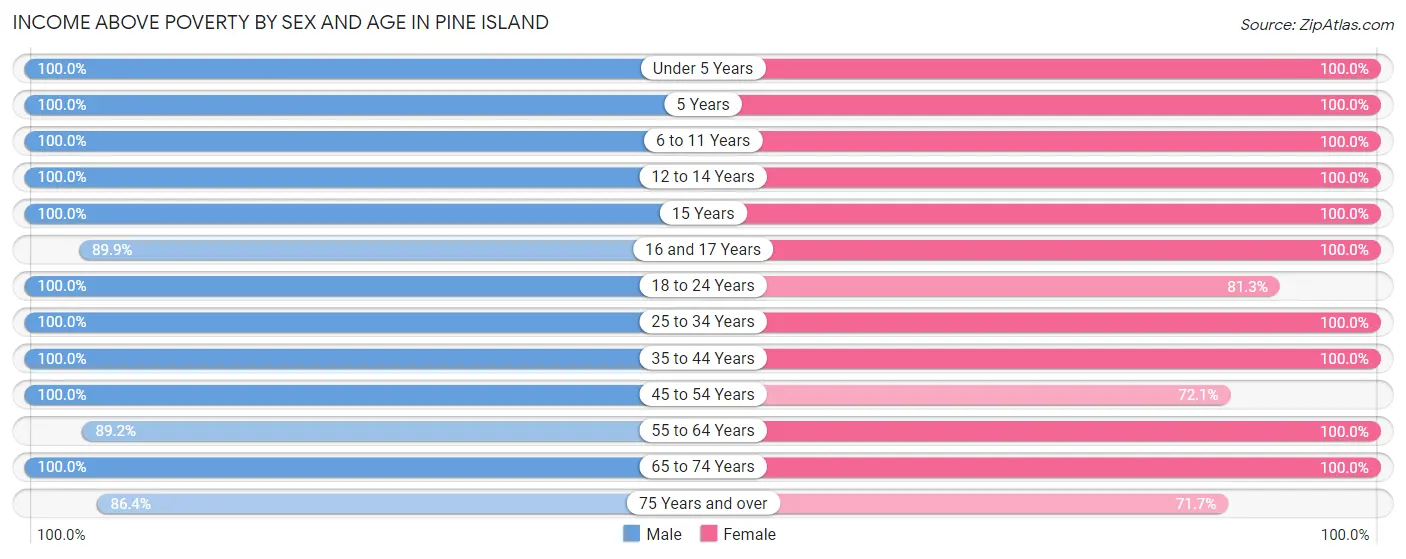
| Age Bracket | Male | Female |
| Under 5 Years | 175 (100.0%) | 119 (100.0%) |
| 5 Years | 17 (100.0%) | 26 (100.0%) |
| 6 to 11 Years | 222 (100.0%) | 171 (100.0%) |
| 12 to 14 Years | 104 (100.0%) | 106 (100.0%) |
| 15 Years | 9 (100.0%) | 20 (100.0%) |
| 16 and 17 Years | 71 (89.9%) | 30 (100.0%) |
| 18 to 24 Years | 189 (100.0%) | 91 (81.2%) |
| 25 to 34 Years | 168 (100.0%) | 306 (100.0%) |
| 35 to 44 Years | 372 (100.0%) | 300 (100.0%) |
| 45 to 54 Years | 221 (100.0%) | 168 (72.1%) |
| 55 to 64 Years | 149 (89.2%) | 148 (100.0%) |
| 65 to 74 Years | 169 (100.0%) | 165 (100.0%) |
| 75 Years and over | 51 (86.4%) | 38 (71.7%) |
| Total | 1,917 (98.3%) | 1,688 (94.4%) |
Income Below Poverty Among Married-Couple Families in Pine Island
The poverty statistics for married-couple families in Pine Island show that 1.2% or 8 of the total 680 families live below the poverty line. Families with no children have the highest poverty rate of 2.8%, comprising of 8 families. On the other hand, families with 1 or 2 children have the lowest poverty rate of 0.0%, which includes 0 families.
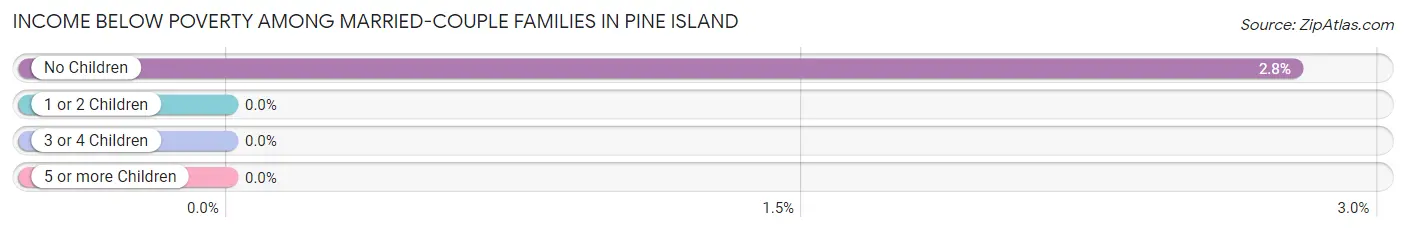
| Children | Above Poverty | Below Poverty |
| No Children | 280 (97.2%) | 8 (2.8%) |
| 1 or 2 Children | 305 (100.0%) | 0 (0.0%) |
| 3 or 4 Children | 87 (100.0%) | 0 (0.0%) |
| 5 or more Children | 0 (0.0%) | 0 (0.0%) |
| Total | 672 (98.8%) | 8 (1.2%) |
Income Below Poverty Among Single-Parent Households in Pine Island
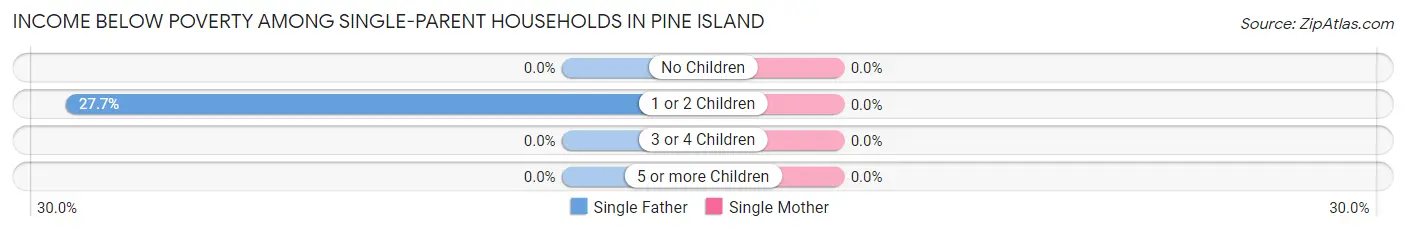
| Children | Single Father | Single Mother |
| No Children | 0 (0.0%) | 0 (0.0%) |
| 1 or 2 Children | 18 (27.7%) | 0 (0.0%) |
| 3 or 4 Children | 0 (0.0%) | 0 (0.0%) |
| 5 or more Children | 0 (0.0%) | 0 (0.0%) |
| Total | 18 (21.4%) | 0 (0.0%) |
Income Below Poverty Among Married-Couple vs Single-Parent Households in Pine Island
The poverty data for Pine Island shows that 8 of the married-couple family households (1.2%) and 18 of the single-parent households (9.0%) are living below the poverty level. Within the married-couple family households, those with no children have the highest poverty rate, with 8 households (2.8%) falling below the poverty line. Among the single-parent households, those with 1 or 2 children have the highest poverty rate, with 18 household (13.0%) living below poverty.
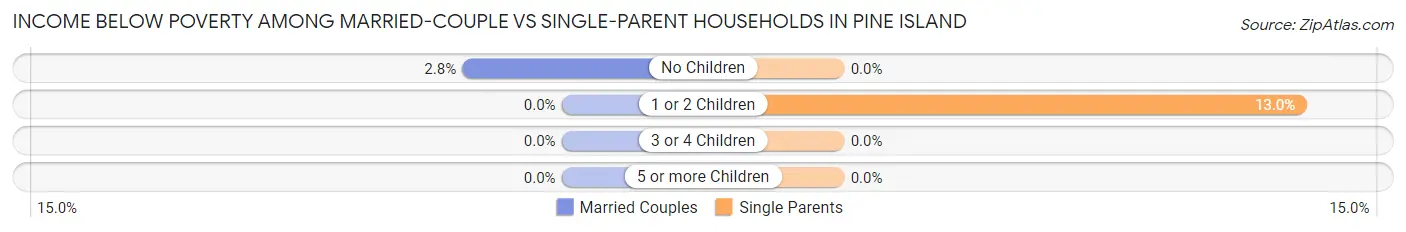
| Children | Married-Couple Families | Single-Parent Households |
| No Children | 8 (2.8%) | 0 (0.0%) |
| 1 or 2 Children | 0 (0.0%) | 18 (13.0%) |
| 3 or 4 Children | 0 (0.0%) | 0 (0.0%) |
| 5 or more Children | 0 (0.0%) | 0 (0.0%) |
| Total | 8 (1.2%) | 18 (9.0%) |
Race in Pine Island
The most populous races in Pine Island are White / Caucasian (3,666 | 95.7%), Two or more Races (74 | 1.9%), and Black / African American (65 | 1.7%).
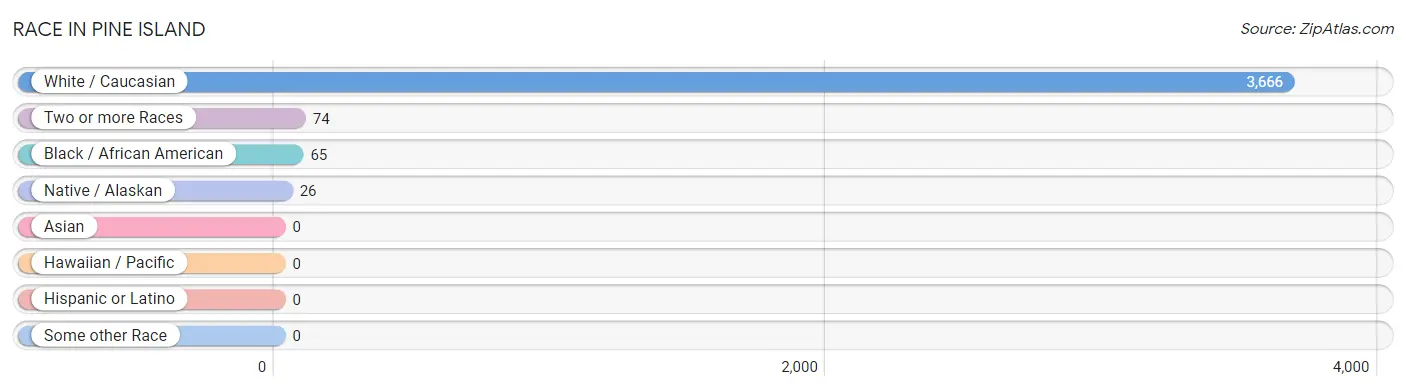
| Race | # Population | % Population |
| Asian | 0 | 0.0% |
| Black / African American | 65 | 1.7% |
| Hawaiian / Pacific | 0 | 0.0% |
| Hispanic or Latino | 0 | 0.0% |
| Native / Alaskan | 26 | 0.7% |
| White / Caucasian | 3,666 | 95.7% |
| Two or more Races | 74 | 1.9% |
| Some other Race | 0 | 0.0% |
| Total | 3,831 | 100.0% |
Ancestry in Pine Island
The most populous ancestries reported in Pine Island are German (997 | 26.0%), Norwegian (567 | 14.8%), Irish (330 | 8.6%), English (214 | 5.6%), and Czech (129 | 3.4%), together accounting for 58.4% of all Pine Island residents.
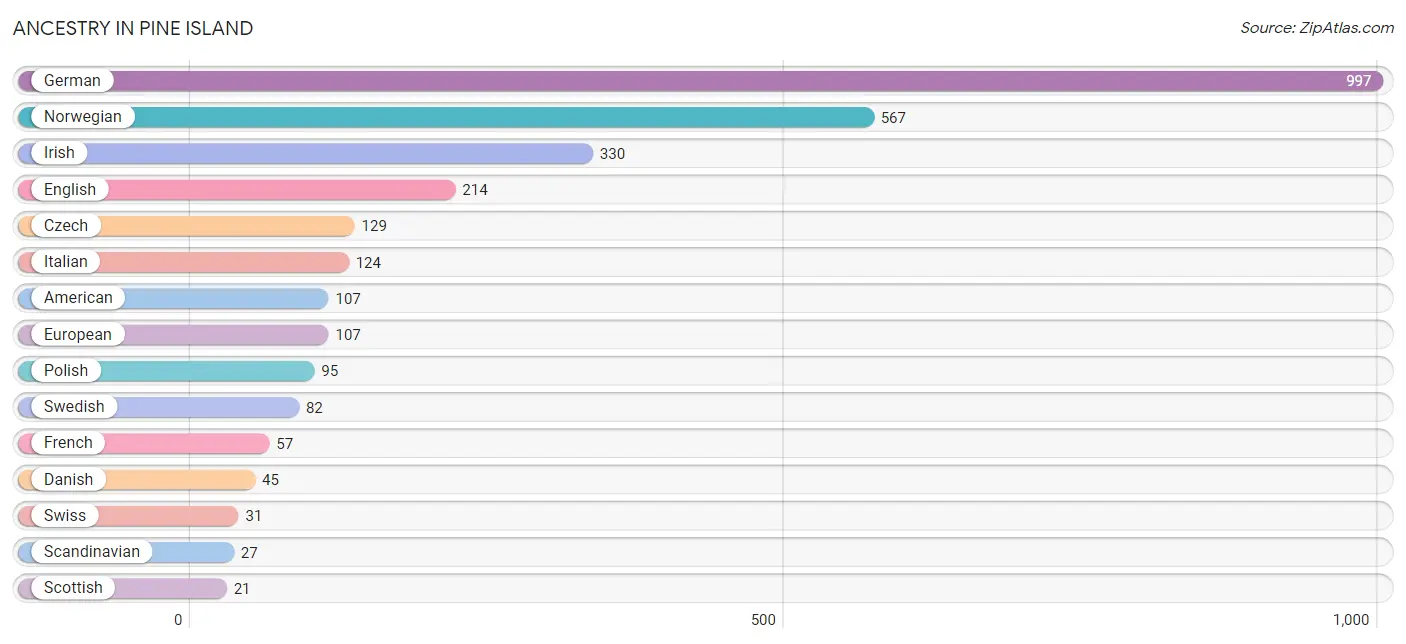
| Ancestry | # Population | % Population |
| American | 107 | 2.8% |
| Austrian | 8 | 0.2% |
| Czech | 129 | 3.4% |
| Danish | 45 | 1.2% |
| Dutch | 7 | 0.2% |
| English | 214 | 5.6% |
| European | 107 | 2.8% |
| Finnish | 9 | 0.2% |
| French | 57 | 1.5% |
| German | 997 | 26.0% |
| Irish | 330 | 8.6% |
| Italian | 124 | 3.2% |
| Norwegian | 567 | 14.8% |
| Polish | 95 | 2.5% |
| Romanian | 19 | 0.5% |
| Scandinavian | 27 | 0.7% |
| Scotch-Irish | 15 | 0.4% |
| Scottish | 21 | 0.5% |
| Swedish | 82 | 2.1% |
| Swiss | 31 | 0.8% |
| Welsh | 13 | 0.3% | View All 21 Rows |
Immigrants in Pine Island
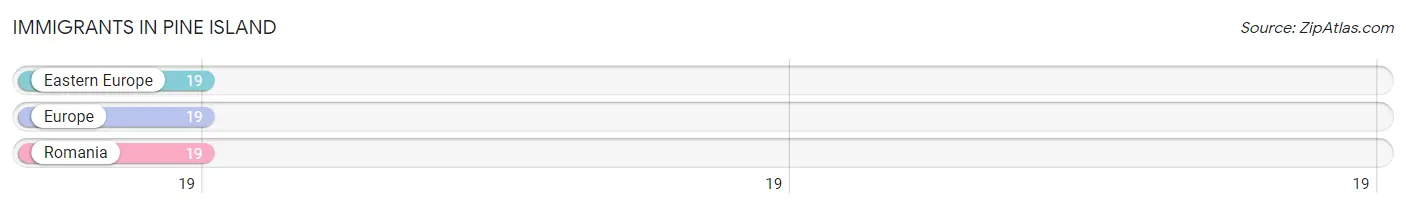
The most numerous immigrant groups reported in Pine Island came from Eastern Europe (19 | 0.5%), Europe (19 | 0.5%), and Romania (19 | 0.5%), together accounting for 1.5% of all Pine Island residents.
| Immigration Origin | # Population | % Population |
| Eastern Europe | 19 | 0.5% |
| Europe | 19 | 0.5% |
| Romania | 19 | 0.5% | View All 3 Rows |
Sex and Age in Pine Island
Sex and Age in Pine Island
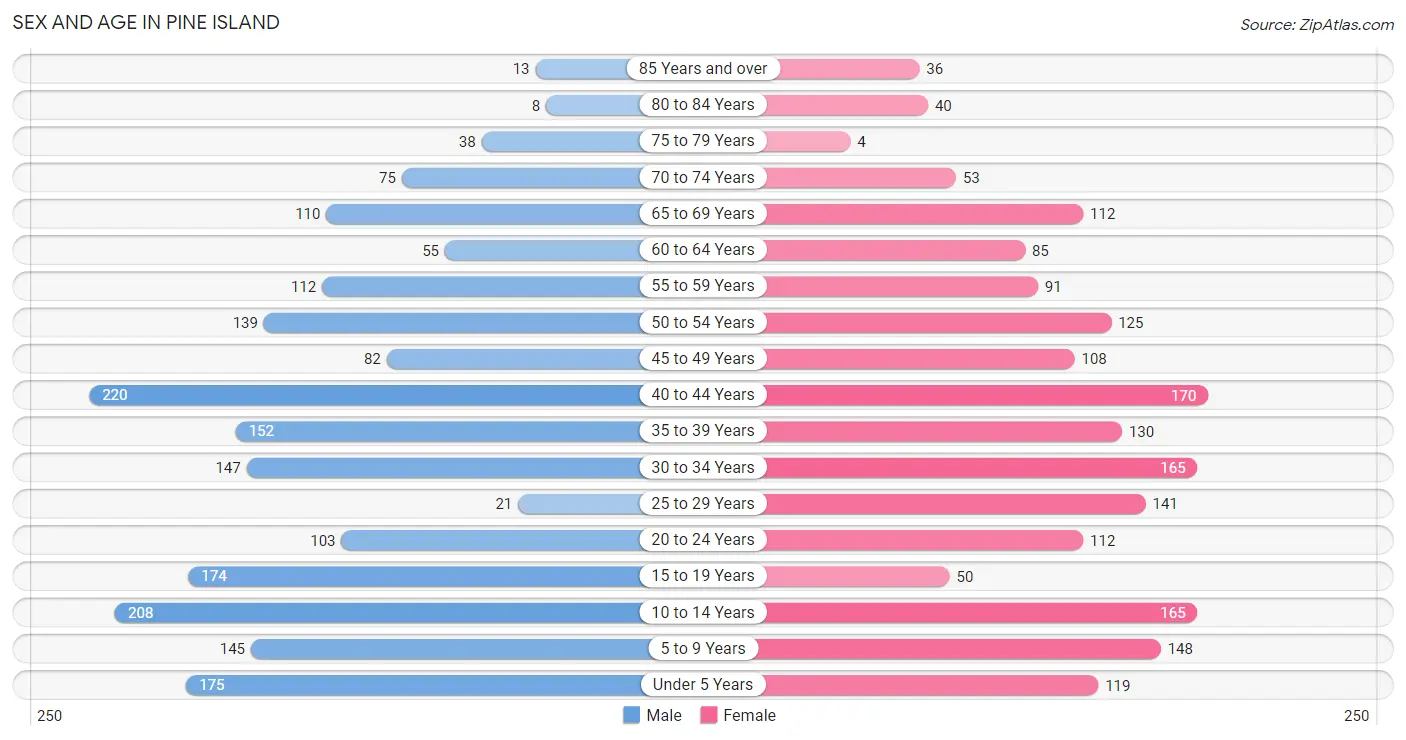
The most populous age groups in Pine Island are 40 to 44 Years (220 | 11.1%) for men and 40 to 44 Years (170 | 9.2%) for women.
| Age Bracket | Male | Female |
| Under 5 Years | 175 (8.8%) | 119 (6.4%) |
| 5 to 9 Years | 145 (7.3%) | 148 (8.0%) |
| 10 to 14 Years | 208 (10.5%) | 165 (8.9%) |
| 15 to 19 Years | 174 (8.8%) | 50 (2.7%) |
| 20 to 24 Years | 103 (5.2%) | 112 (6.0%) |
| 25 to 29 Years | 21 (1.1%) | 141 (7.6%) |
| 30 to 34 Years | 147 (7.4%) | 165 (8.9%) |
| 35 to 39 Years | 152 (7.7%) | 130 (7.0%) |
| 40 to 44 Years | 220 (11.1%) | 170 (9.2%) |
| 45 to 49 Years | 82 (4.2%) | 108 (5.8%) |
| 50 to 54 Years | 139 (7.0%) | 125 (6.7%) |
| 55 to 59 Years | 112 (5.7%) | 91 (4.9%) |
| 60 to 64 Years | 55 (2.8%) | 85 (4.6%) |
| 65 to 69 Years | 110 (5.6%) | 112 (6.0%) |
| 70 to 74 Years | 75 (3.8%) | 53 (2.9%) |
| 75 to 79 Years | 38 (1.9%) | 4 (0.2%) |
| 80 to 84 Years | 8 (0.4%) | 40 (2.2%) |
| 85 Years and over | 13 (0.7%) | 36 (1.9%) |
| Total | 1,977 (100.0%) | 1,854 (100.0%) |
Families and Households in Pine Island
Median Family Size in Pine Island
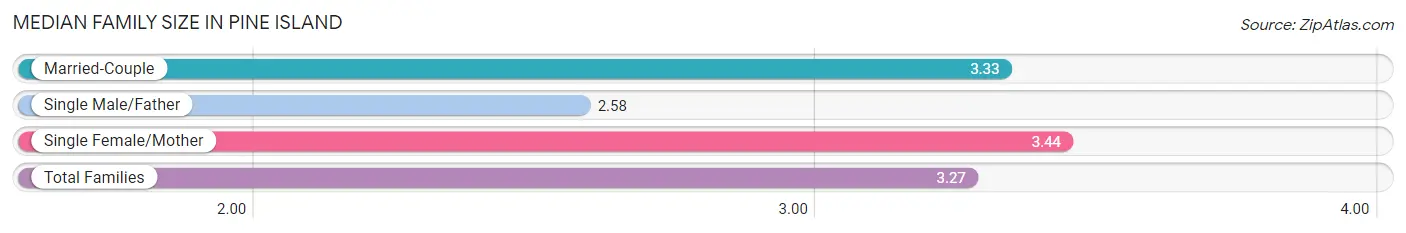
The median family size in Pine Island is 3.27 persons per family, with single female/mother families (117 | 13.3%) accounting for the largest median family size of 3.44 persons per family. On the other hand, single male/father families (84 | 9.5%) represent the smallest median family size with 2.58 persons per family.
| Family Type | # Families | Family Size |
| Married-Couple | 680 (77.2%) | 3.33 |
| Single Male/Father | 84 (9.5%) | 2.58 |
| Single Female/Mother | 117 (13.3%) | 3.44 |
| Total Families | 881 (100.0%) | 3.27 |
Median Household Size in Pine Island
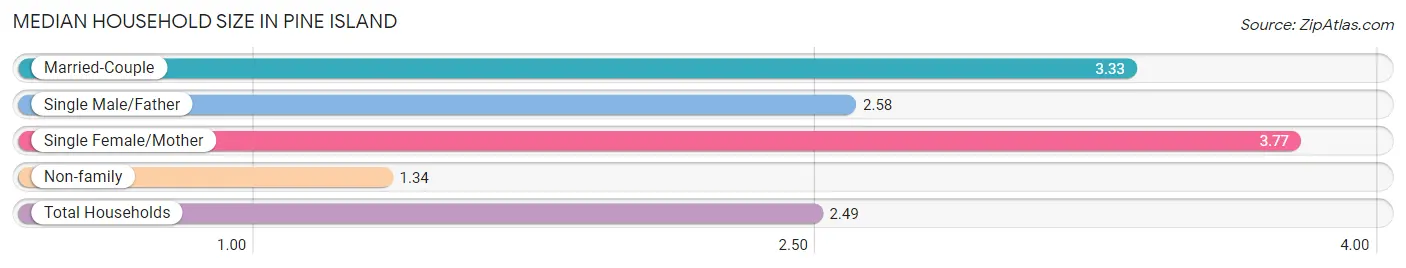
The median household size in Pine Island is 2.49 persons per household, with single female/mother households (117 | 7.8%) accounting for the largest median household size of 3.77 persons per household. non-family households (627 | 41.6%) represent the smallest median household size with 1.34 persons per household.
| Household Type | # Households | Household Size |
| Married-Couple | 680 (45.1%) | 3.33 |
| Single Male/Father | 84 (5.6%) | 2.58 |
| Single Female/Mother | 117 (7.8%) | 3.77 |
| Non-family | 627 (41.6%) | 1.34 |
| Total Households | 1,508 (100.0%) | 2.49 |
Household Size by Marriage Status in Pine Island
Out of a total of 1,508 households in Pine Island, 881 (58.4%) are family households, while 627 (41.6%) are nonfamily households. The most numerous type of family households are 2-person households, comprising 285, and the most common type of nonfamily households are 1-person households, comprising 430.
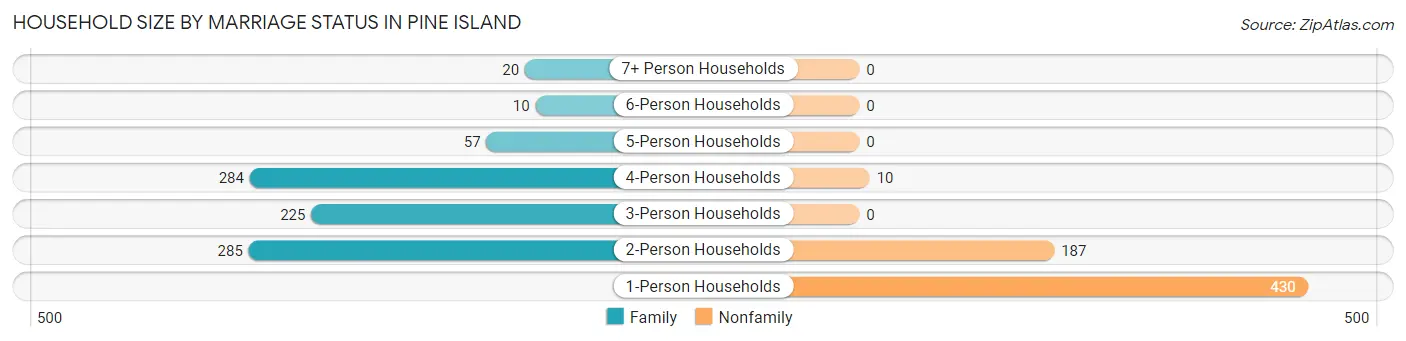
| Household Size | Family Households | Nonfamily Households |
| 1-Person Households | - | 430 (28.5%) |
| 2-Person Households | 285 (18.9%) | 187 (12.4%) |
| 3-Person Households | 225 (14.9%) | 0 (0.0%) |
| 4-Person Households | 284 (18.8%) | 10 (0.7%) |
| 5-Person Households | 57 (3.8%) | 0 (0.0%) |
| 6-Person Households | 10 (0.7%) | 0 (0.0%) |
| 7+ Person Households | 20 (1.3%) | 0 (0.0%) |
| Total | 881 (58.4%) | 627 (41.6%) |
Female Fertility in Pine Island
Fertility by Age in Pine Island
Average fertility rate in Pine Island is 45.0 births per 1,000 women. Women in the age bracket of 20 to 34 years have the highest fertility rate with 55.0 births per 1,000 women. Women in the age bracket of 20 to 34 years acount for 52.3% of all women with births.
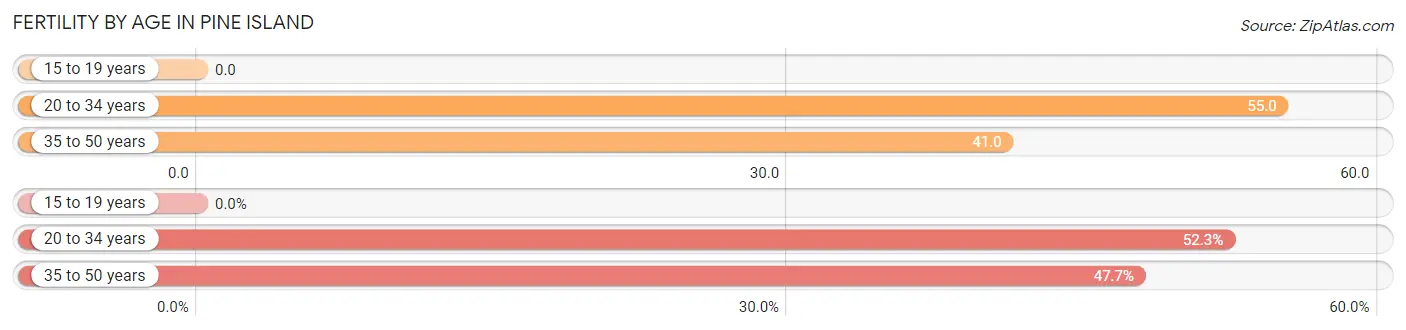
| Age Bracket | Women with Births | Births / 1,000 Women |
| 15 to 19 years | 0 (0.0%) | 0.0 |
| 20 to 34 years | 23 (52.3%) | 55.0 |
| 35 to 50 years | 21 (47.7%) | 41.0 |
| Total | 44 (100.0%) | 45.0 |
Fertility by Age by Marriage Status in Pine Island
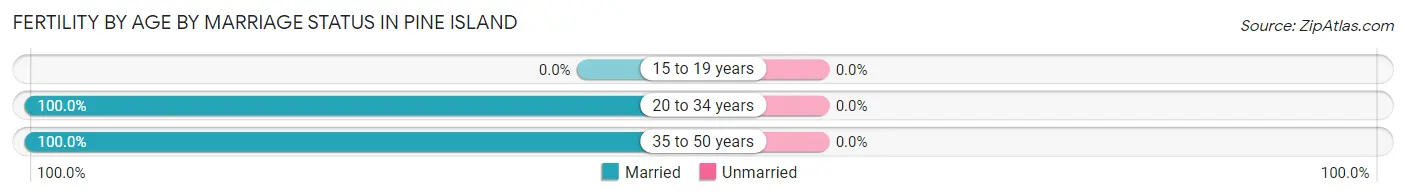
| Age Bracket | Married | Unmarried |
| 15 to 19 years | 0 (0.0%) | 0 (0.0%) |
| 20 to 34 years | 23 (100.0%) | 0 (0.0%) |
| 35 to 50 years | 21 (100.0%) | 0 (0.0%) |
| Total | 44 (100.0%) | 0 (0.0%) |
Fertility by Education in Pine Island
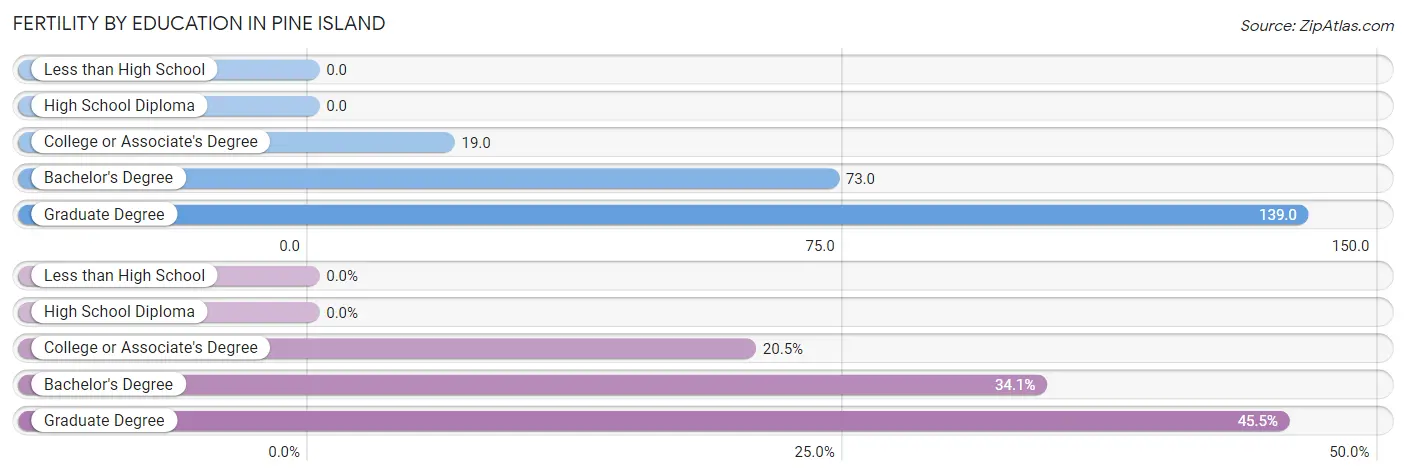
| Educational Attainment | Women with Births | Births / 1,000 Women |
| Less than High School | 0 (0.0%) | 0.0 |
| High School Diploma | 0 (0.0%) | 0.0 |
| College or Associate's Degree | 9 (20.4%) | 19.0 |
| Bachelor's Degree | 15 (34.1%) | 73.0 |
| Graduate Degree | 20 (45.5%) | 139.0 |
| Total | 44 (100.0%) | 45.0 |
Fertility by Education by Marriage Status in Pine Island
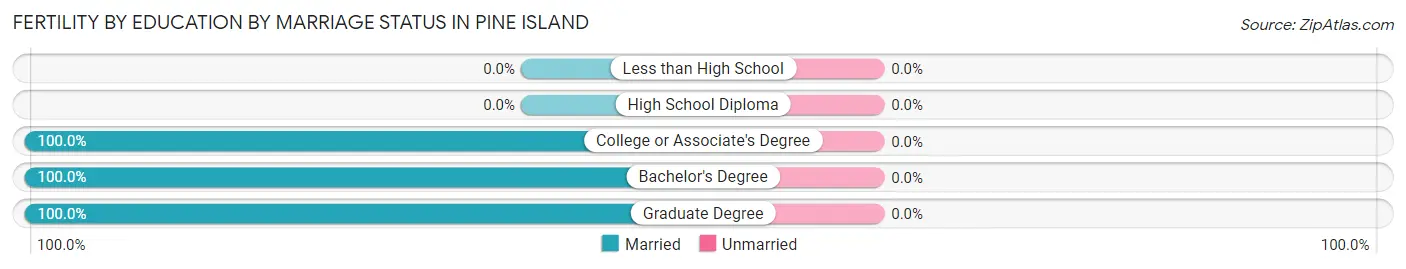
| Educational Attainment | Married | Unmarried |
| Less than High School | 0 (0.0%) | 0 (0.0%) |
| High School Diploma | 0 (0.0%) | 0 (0.0%) |
| College or Associate's Degree | 9 (100.0%) | 0 (0.0%) |
| Bachelor's Degree | 15 (100.0%) | 0 (0.0%) |
| Graduate Degree | 20 (100.0%) | 0 (0.0%) |
| Total | 44 (100.0%) | 0 (0.0%) |
Employment Characteristics in Pine Island
Employment by Class of Employer in Pine Island
Among the 2,045 employed individuals in Pine Island, private company employees (1,001 | 48.9%), not-for-profit organizations (625 | 30.6%), and local government employees (259 | 12.7%) make up the most common classes of employment.
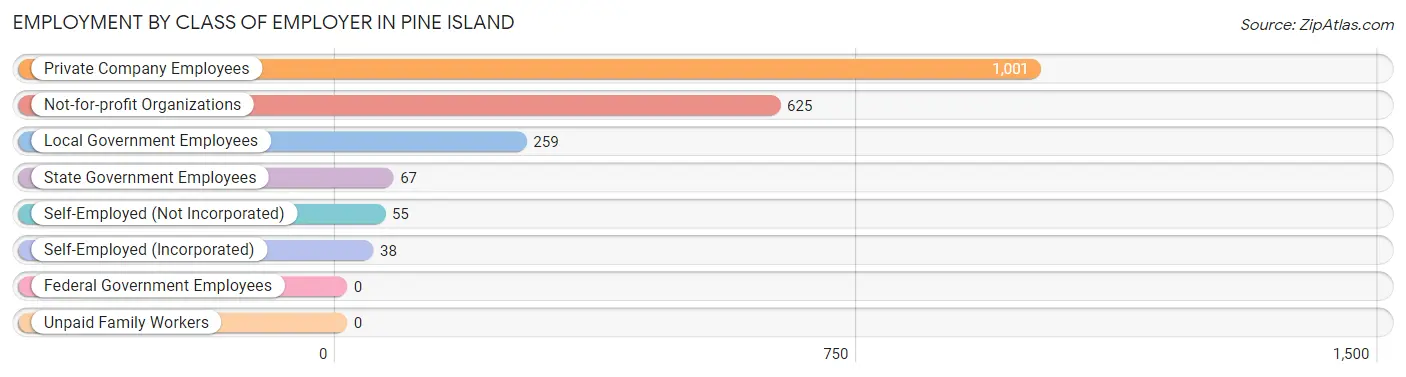
| Employer Class | # Employees | % Employees |
| Private Company Employees | 1,001 | 48.9% |
| Self-Employed (Incorporated) | 38 | 1.9% |
| Self-Employed (Not Incorporated) | 55 | 2.7% |
| Not-for-profit Organizations | 625 | 30.6% |
| Local Government Employees | 259 | 12.7% |
| State Government Employees | 67 | 3.3% |
| Federal Government Employees | 0 | 0.0% |
| Unpaid Family Workers | 0 | 0.0% |
| Total | 2,045 | 100.0% |
Employment Status by Age in Pine Island
According to the labor force statistics for Pine Island, out of the total population over 16 years of age (2,842), 74.8% or 2,126 individuals are in the labor force, with 2.3% or 49 of them unemployed. The age group with the highest labor force participation rate is 30 to 34 years, with 100.0% or 312 individuals in the labor force. Within the labor force, the 16 to 19 years age range has the highest percentage of unemployed individuals, with 18.3% or 15 of them being unemployed.
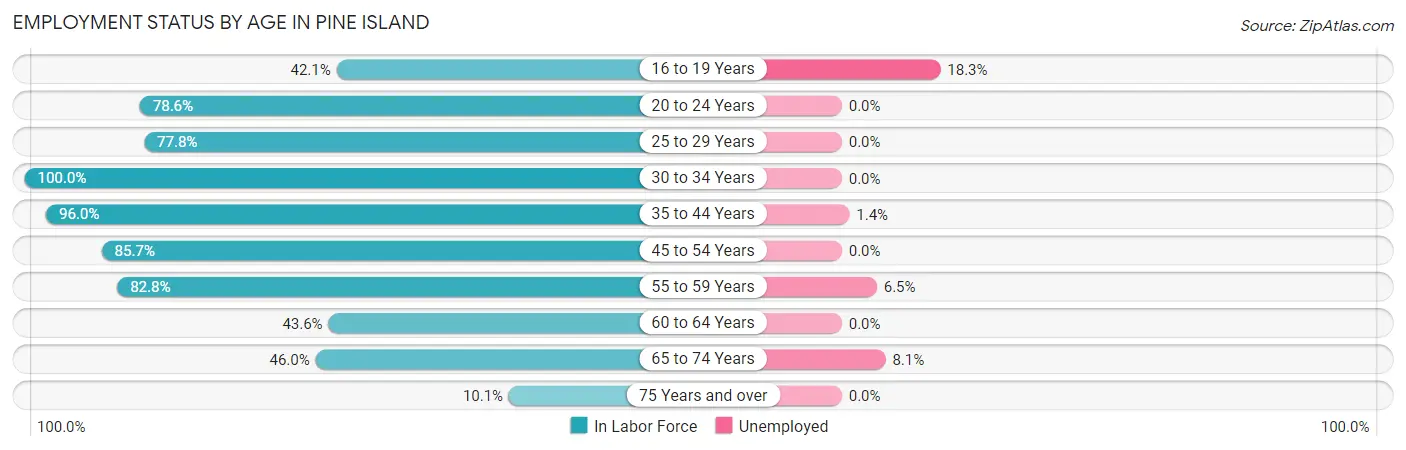
| Age Bracket | In Labor Force | Unemployed |
| 16 to 19 Years | 82 (42.1%) | 15 (18.3%) |
| 20 to 24 Years | 169 (78.6%) | 0 (0.0%) |
| 25 to 29 Years | 126 (77.8%) | 0 (0.0%) |
| 30 to 34 Years | 312 (100.0%) | 0 (0.0%) |
| 35 to 44 Years | 645 (96.0%) | 9 (1.4%) |
| 45 to 54 Years | 389 (85.7%) | 0 (0.0%) |
| 55 to 59 Years | 168 (82.8%) | 11 (6.5%) |
| 60 to 64 Years | 61 (43.6%) | 0 (0.0%) |
| 65 to 74 Years | 161 (46.0%) | 13 (8.1%) |
| 75 Years and over | 14 (10.1%) | 0 (0.0%) |
| Total | 2,126 (74.8%) | 49 (2.3%) |
Employment Status by Educational Attainment in Pine Island
According to labor force statistics for Pine Island, 87.5% of individuals (1,700) out of the total population between 25 and 64 years of age (1,943) are in the labor force, with 1.2% or 20 of them being unemployed. The group with the highest labor force participation rate are those with the educational attainment of bachelor's degree or higher, with 92.9% or 768 individuals in the labor force. Within the labor force, individuals with high school diploma education have the highest percentage of unemployment, with 4.5% or 11 of them being unemployed.
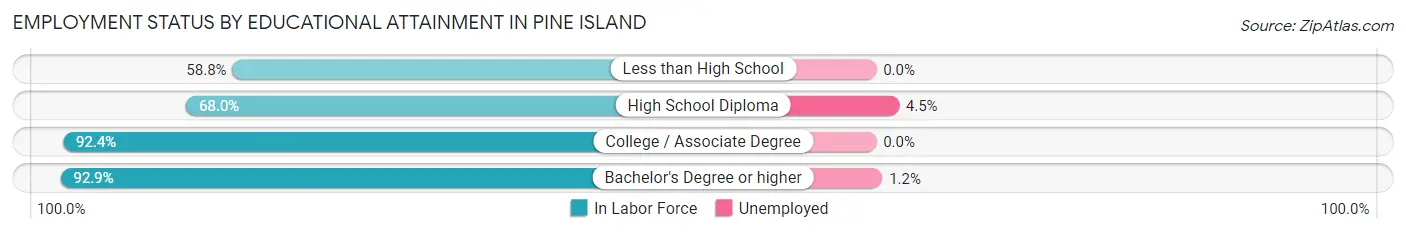
| Educational Attainment | In Labor Force | Unemployed |
| Less than High School | 20 (58.8%) | 0 (0.0%) |
| High School Diploma | 242 (68.0%) | 16 (4.5%) |
| College / Associate Degree | 671 (92.4%) | 0 (0.0%) |
| Bachelor's Degree or higher | 768 (92.9%) | 10 (1.2%) |
| Total | 1,700 (87.5%) | 23 (1.2%) |
Employment Occupations by Sex in Pine Island
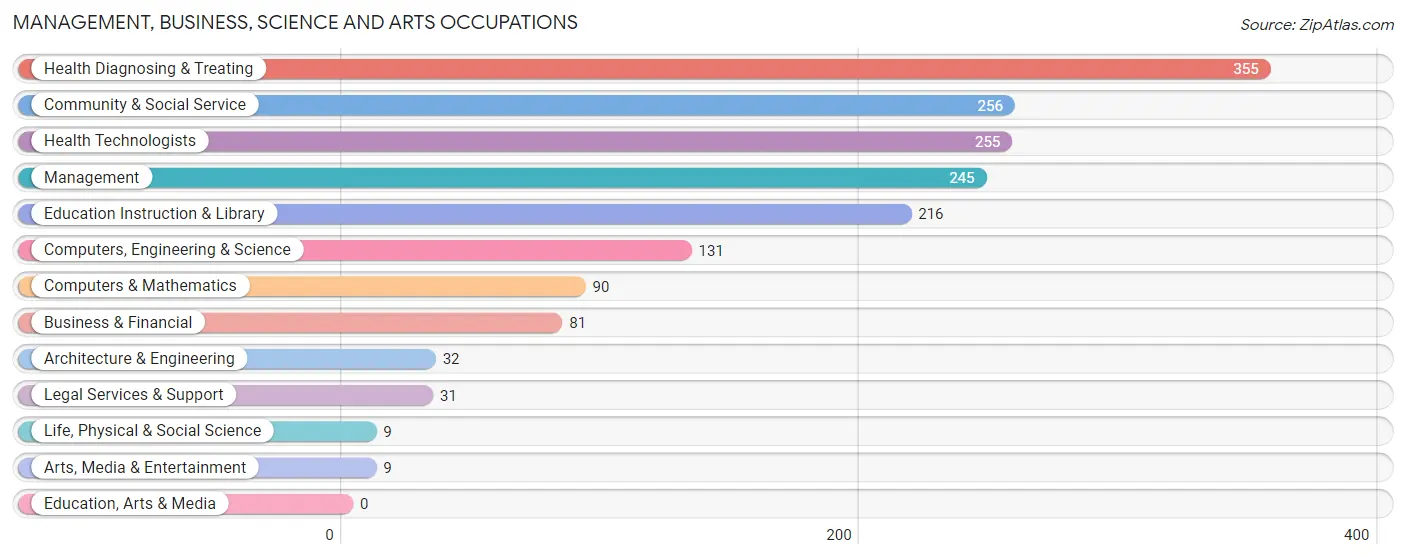
Management, Business, Science and Arts Occupations
The most common Management, Business, Science and Arts occupations in Pine Island are Health Diagnosing & Treating (355 | 17.1%), Community & Social Service (256 | 12.3%), Health Technologists (255 | 12.3%), Management (245 | 11.8%), and Education Instruction & Library (216 | 10.4%).
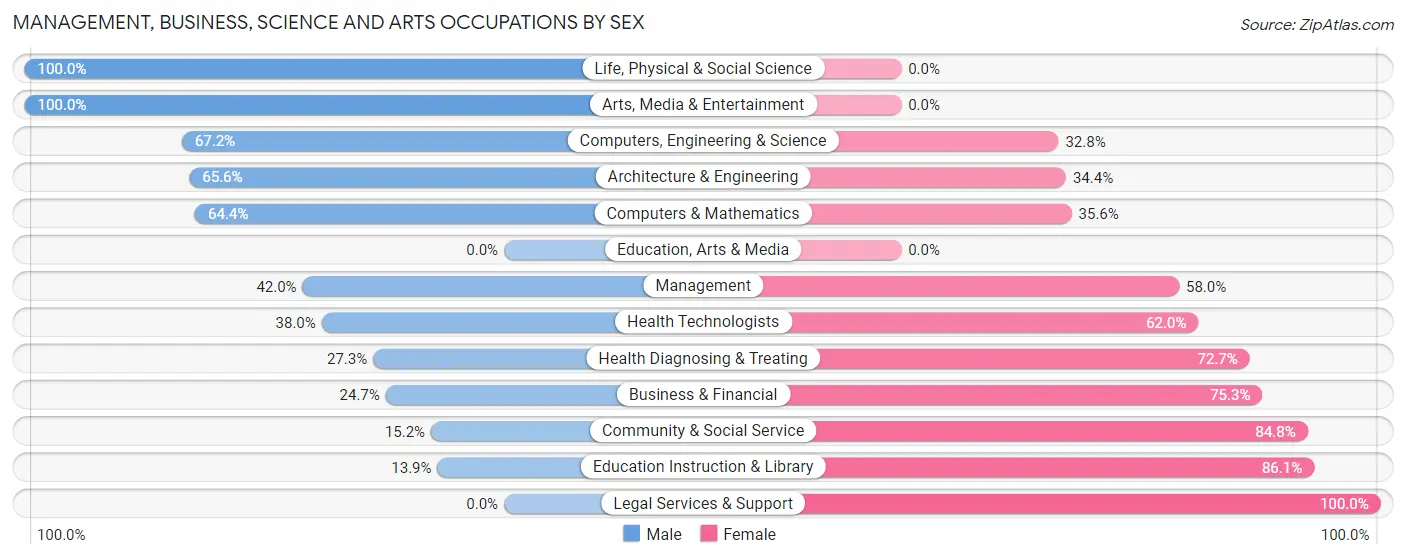
Management, Business, Science and Arts Occupations by Sex
Within the Management, Business, Science and Arts occupations in Pine Island, the most male-oriented occupations are Life, Physical & Social Science (100.0%), Arts, Media & Entertainment (100.0%), and Computers, Engineering & Science (67.2%), while the most female-oriented occupations are Legal Services & Support (100.0%), Education Instruction & Library (86.1%), and Community & Social Service (84.8%).
| Occupation | Male | Female |
| Management | 103 (42.0%) | 142 (58.0%) |
| Business & Financial | 20 (24.7%) | 61 (75.3%) |
| Computers, Engineering & Science | 88 (67.2%) | 43 (32.8%) |
| Computers & Mathematics | 58 (64.4%) | 32 (35.6%) |
| Architecture & Engineering | 21 (65.6%) | 11 (34.4%) |
| Life, Physical & Social Science | 9 (100.0%) | 0 (0.0%) |
| Community & Social Service | 39 (15.2%) | 217 (84.8%) |
| Education, Arts & Media | 0 (0.0%) | 0 (0.0%) |
| Legal Services & Support | 0 (0.0%) | 31 (100.0%) |
| Education Instruction & Library | 30 (13.9%) | 186 (86.1%) |
| Arts, Media & Entertainment | 9 (100.0%) | 0 (0.0%) |
| Health Diagnosing & Treating | 97 (27.3%) | 258 (72.7%) |
| Health Technologists | 97 (38.0%) | 158 (62.0%) |
| Total (Category) | 347 (32.5%) | 721 (67.5%) |
| Total (Overall) | 1,069 (51.4%) | 1,010 (48.6%) |
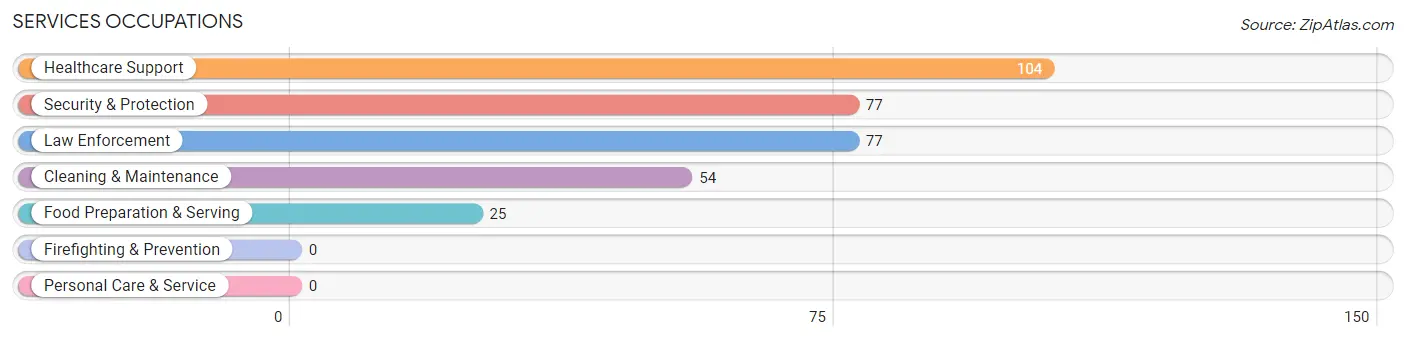
Services Occupations
The most common Services occupations in Pine Island are Healthcare Support (104 | 5.0%), Security & Protection (77 | 3.7%), Law Enforcement (77 | 3.7%), Cleaning & Maintenance (54 | 2.6%), and Food Preparation & Serving (25 | 1.2%).
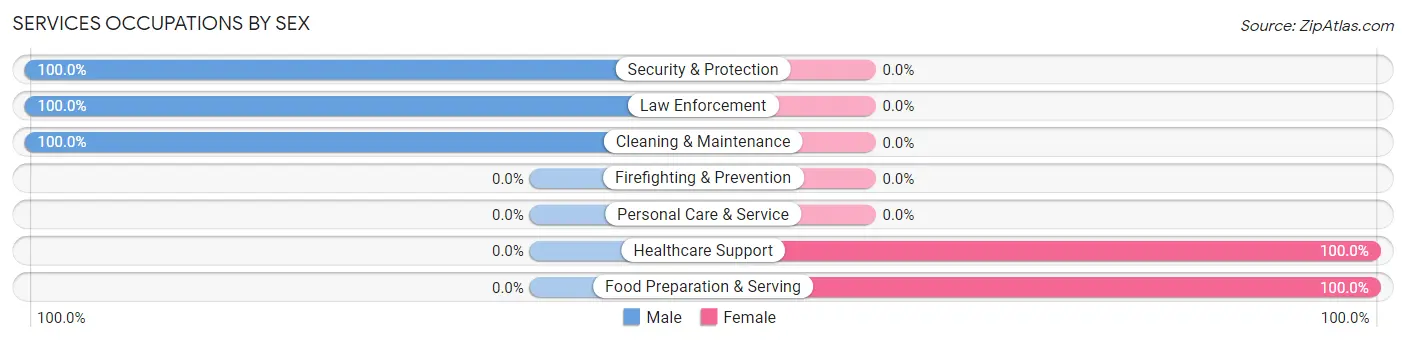
Services Occupations by Sex
Within the Services occupations in Pine Island, the most male-oriented occupations are Security & Protection (100.0%), Law Enforcement (100.0%), and Cleaning & Maintenance (100.0%), while the most female-oriented occupations are Healthcare Support (100.0%), and Food Preparation & Serving (100.0%).
| Occupation | Male | Female |
| Healthcare Support | 0 (0.0%) | 104 (100.0%) |
| Security & Protection | 77 (100.0%) | 0 (0.0%) |
| Firefighting & Prevention | 0 (0.0%) | 0 (0.0%) |
| Law Enforcement | 77 (100.0%) | 0 (0.0%) |
| Food Preparation & Serving | 0 (0.0%) | 25 (100.0%) |
| Cleaning & Maintenance | 54 (100.0%) | 0 (0.0%) |
| Personal Care & Service | 0 (0.0%) | 0 (0.0%) |
| Total (Category) | 131 (50.4%) | 129 (49.6%) |
| Total (Overall) | 1,069 (51.4%) | 1,010 (48.6%) |
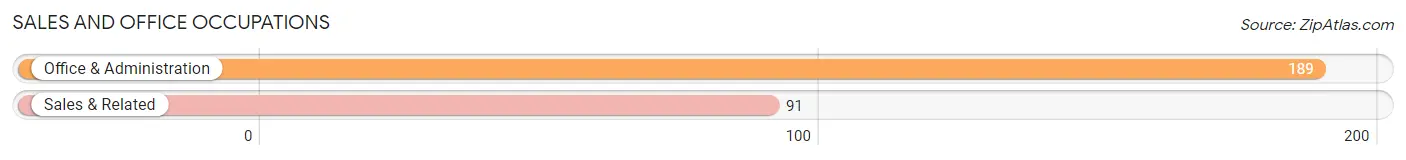
Sales and Office Occupations
The most common Sales and Office occupations in Pine Island are Office & Administration (189 | 9.1%), and Sales & Related (91 | 4.4%).
Sales and Office Occupations by Sex
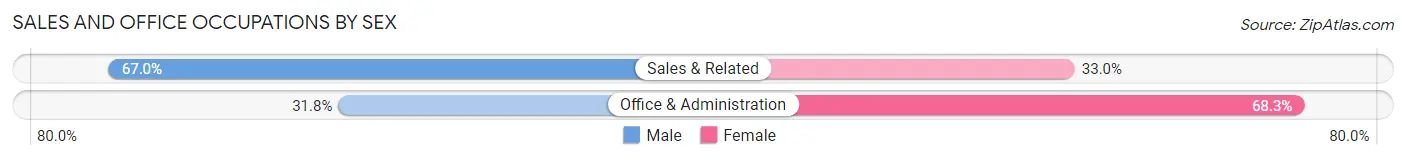
| Occupation | Male | Female |
| Sales & Related | 61 (67.0%) | 30 (33.0%) |
| Office & Administration | 60 (31.8%) | 129 (68.2%) |
| Total (Category) | 121 (43.2%) | 159 (56.8%) |
| Total (Overall) | 1,069 (51.4%) | 1,010 (48.6%) |
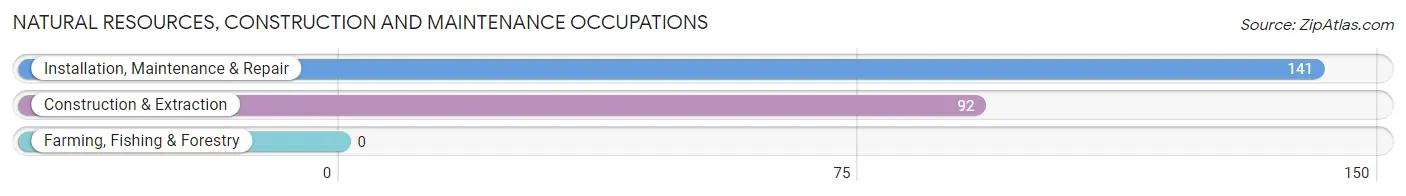
Natural Resources, Construction and Maintenance Occupations
The most common Natural Resources, Construction and Maintenance occupations in Pine Island are Installation, Maintenance & Repair (141 | 6.8%), and Construction & Extraction (92 | 4.4%).
Natural Resources, Construction and Maintenance Occupations by Sex
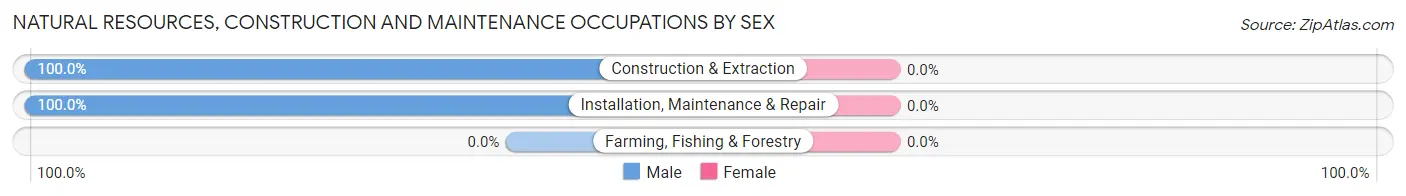
| Occupation | Male | Female |
| Farming, Fishing & Forestry | 0 (0.0%) | 0 (0.0%) |
| Construction & Extraction | 92 (100.0%) | 0 (0.0%) |
| Installation, Maintenance & Repair | 141 (100.0%) | 0 (0.0%) |
| Total (Category) | 233 (100.0%) | 0 (0.0%) |
| Total (Overall) | 1,069 (51.4%) | 1,010 (48.6%) |
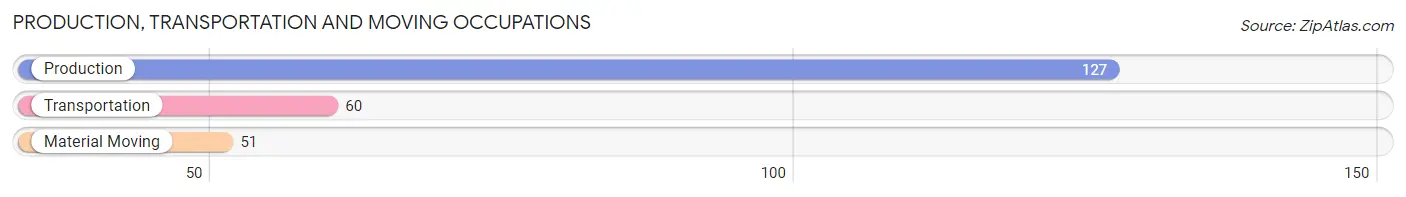
Production, Transportation and Moving Occupations
The most common Production, Transportation and Moving occupations in Pine Island are Production (127 | 6.1%), Transportation (60 | 2.9%), and Material Moving (51 | 2.5%).
Production, Transportation and Moving Occupations by Sex
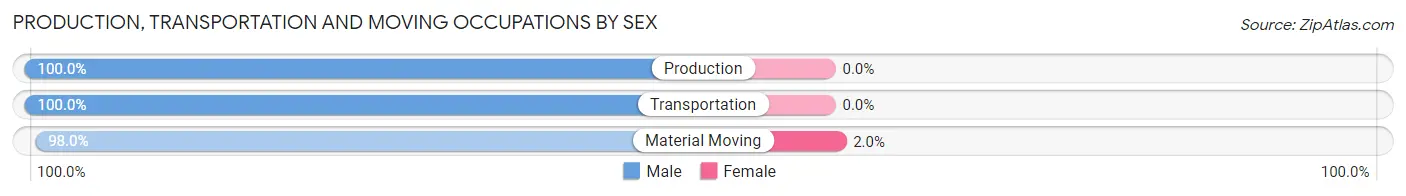
| Occupation | Male | Female |
| Production | 127 (100.0%) | 0 (0.0%) |
| Transportation | 60 (100.0%) | 0 (0.0%) |
| Material Moving | 50 (98.0%) | 1 (2.0%) |
| Total (Category) | 237 (99.6%) | 1 (0.4%) |
| Total (Overall) | 1,069 (51.4%) | 1,010 (48.6%) |
Employment Industries by Sex in Pine Island
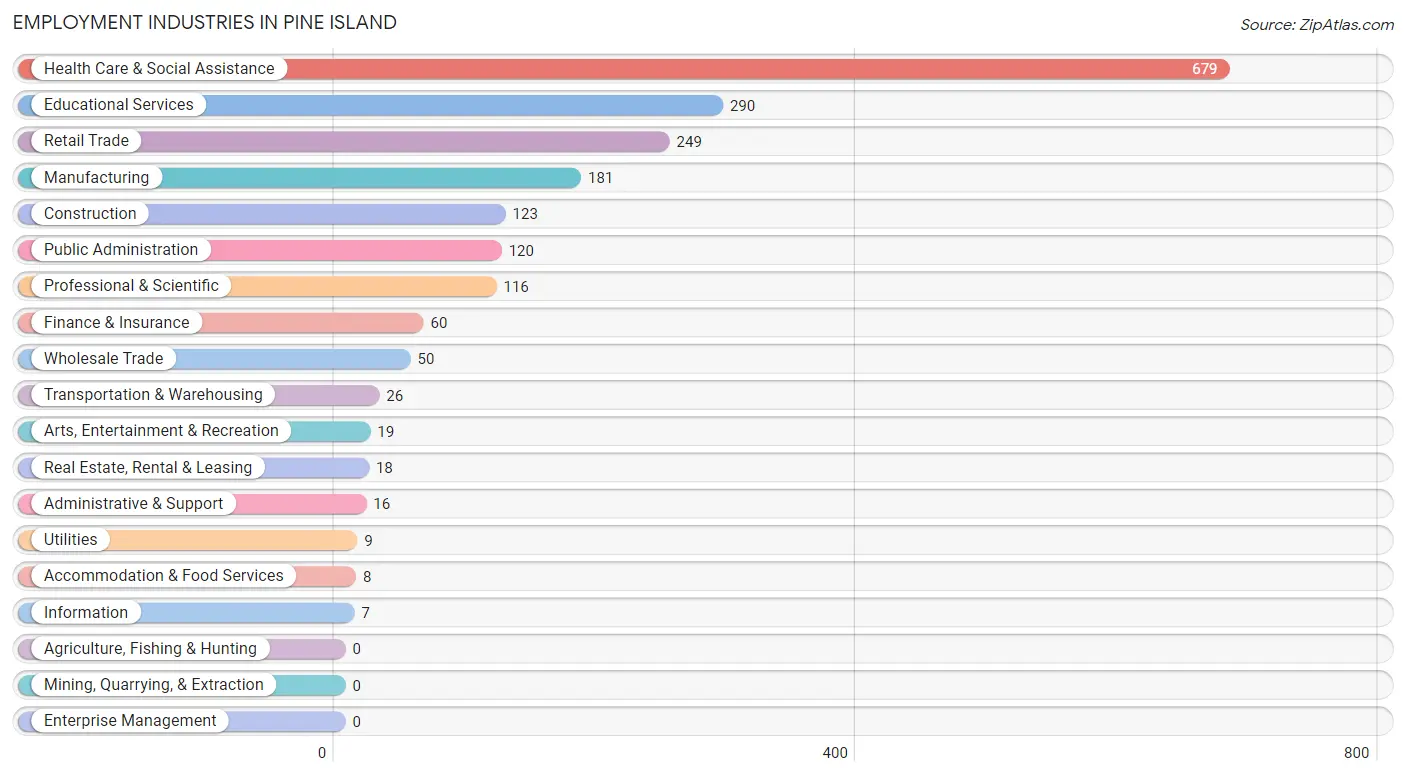
Employment Industries in Pine Island
The major employment industries in Pine Island include Health Care & Social Assistance (679 | 32.7%), Educational Services (290 | 14.0%), Retail Trade (249 | 12.0%), Manufacturing (181 | 8.7%), and Construction (123 | 5.9%).
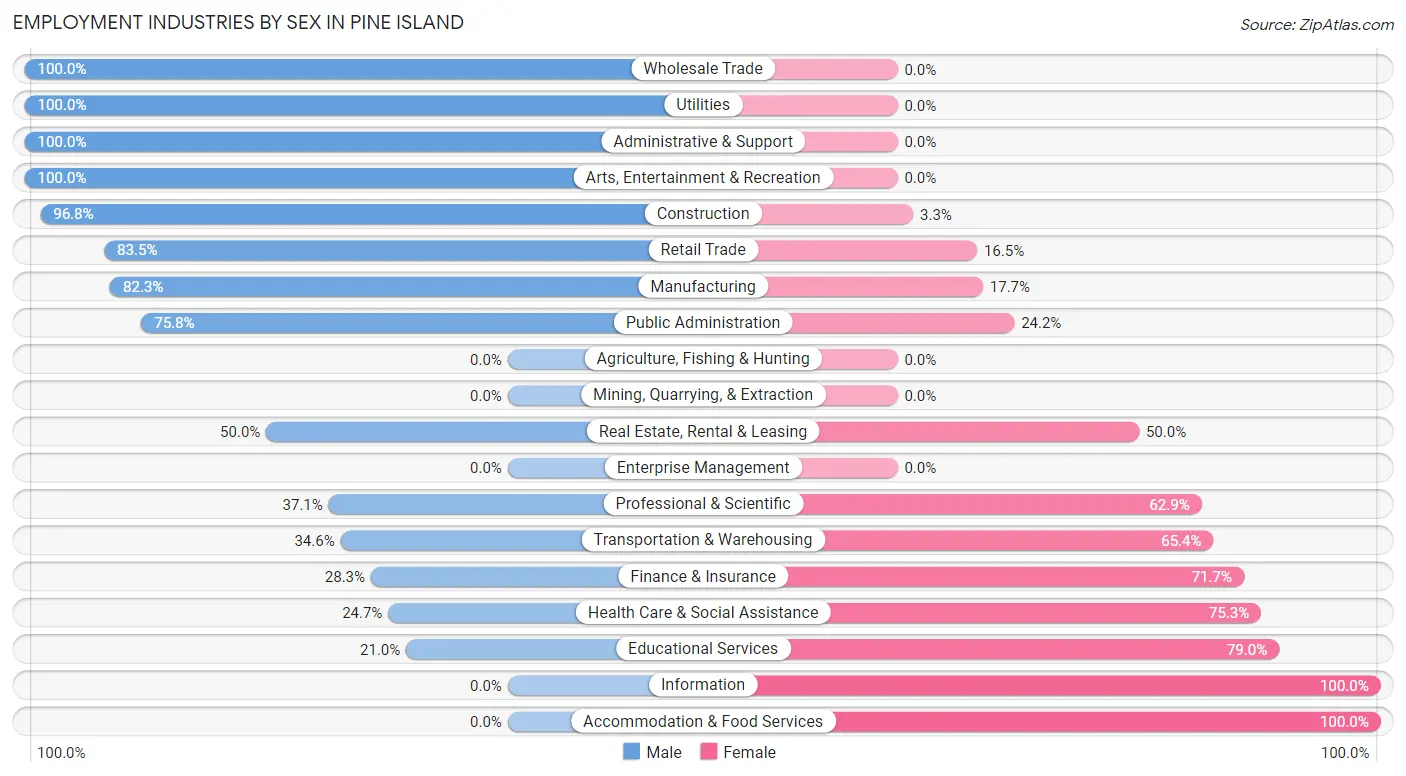
Employment Industries by Sex in Pine Island
The Pine Island industries that see more men than women are Wholesale Trade (100.0%), Utilities (100.0%), and Administrative & Support (100.0%), whereas the industries that tend to have a higher number of women are Information (100.0%), Accommodation & Food Services (100.0%), and Educational Services (79.0%).
| Industry | Male | Female |
| Agriculture, Fishing & Hunting | 0 (0.0%) | 0 (0.0%) |
| Mining, Quarrying, & Extraction | 0 (0.0%) | 0 (0.0%) |
| Construction | 119 (96.8%) | 4 (3.3%) |
| Manufacturing | 149 (82.3%) | 32 (17.7%) |
| Wholesale Trade | 50 (100.0%) | 0 (0.0%) |
| Retail Trade | 208 (83.5%) | 41 (16.5%) |
| Transportation & Warehousing | 9 (34.6%) | 17 (65.4%) |
| Utilities | 9 (100.0%) | 0 (0.0%) |
| Information | 0 (0.0%) | 7 (100.0%) |
| Finance & Insurance | 17 (28.3%) | 43 (71.7%) |
| Real Estate, Rental & Leasing | 9 (50.0%) | 9 (50.0%) |
| Professional & Scientific | 43 (37.1%) | 73 (62.9%) |
| Enterprise Management | 0 (0.0%) | 0 (0.0%) |
| Administrative & Support | 16 (100.0%) | 0 (0.0%) |
| Educational Services | 61 (21.0%) | 229 (79.0%) |
| Health Care & Social Assistance | 168 (24.7%) | 511 (75.3%) |
| Arts, Entertainment & Recreation | 19 (100.0%) | 0 (0.0%) |
| Accommodation & Food Services | 0 (0.0%) | 8 (100.0%) |
| Public Administration | 91 (75.8%) | 29 (24.2%) |
| Total | 1,069 (51.4%) | 1,010 (48.6%) |
Education in Pine Island
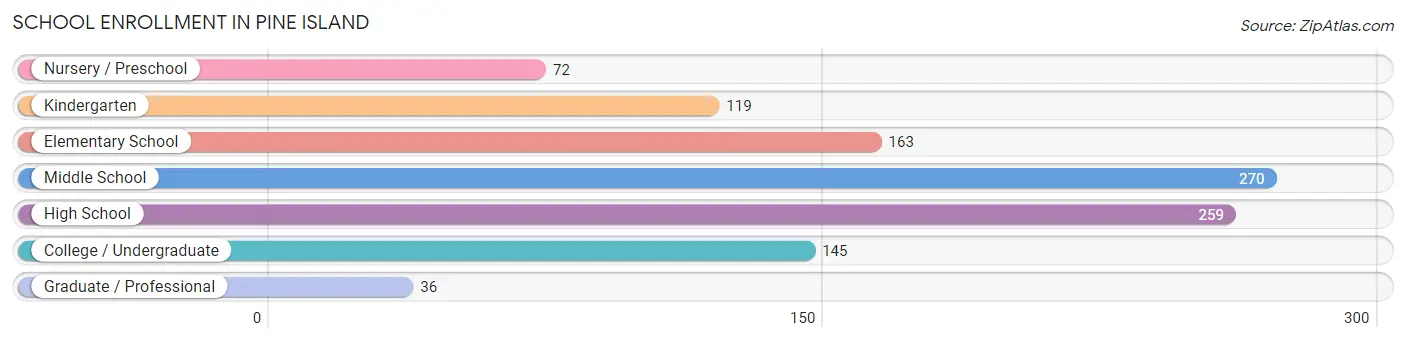
School Enrollment in Pine Island
The most common levels of schooling among the 1,064 students in Pine Island are middle school (270 | 25.4%), high school (259 | 24.3%), and elementary school (163 | 15.3%).
| School Level | # Students | % Students |
| Nursery / Preschool | 72 | 6.8% |
| Kindergarten | 119 | 11.2% |
| Elementary School | 163 | 15.3% |
| Middle School | 270 | 25.4% |
| High School | 259 | 24.3% |
| College / Undergraduate | 145 | 13.6% |
| Graduate / Professional | 36 | 3.4% |
| Total | 1,064 | 100.0% |
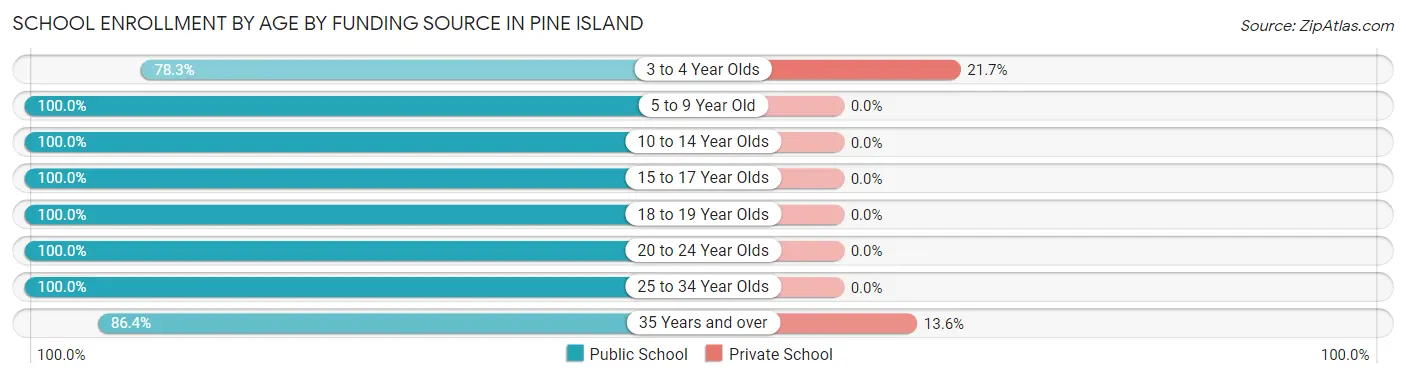
School Enrollment by Age by Funding Source in Pine Island
Out of a total of 1,064 students who are enrolled in schools in Pine Island, 19 (1.8%) attend a private institution, while the remaining 1,045 (98.2%) are enrolled in public schools. The age group of 3 to 4 year olds has the highest likelihood of being enrolled in private schools, with 10 (21.7% in the age bracket) enrolled. Conversely, the age group of 5 to 9 year old has the lowest likelihood of being enrolled in a private school, with 275 (100.0% in the age bracket) attending a public institution.
| Age Bracket | Public School | Private School |
| 3 to 4 Year Olds | 36 (78.3%) | 10 (21.7%) |
| 5 to 9 Year Old | 275 (100.0%) | 0 (0.0%) |
| 10 to 14 Year Olds | 353 (100.0%) | 0 (0.0%) |
| 15 to 17 Year Olds | 138 (100.0%) | 0 (0.0%) |
| 18 to 19 Year Olds | 71 (100.0%) | 0 (0.0%) |
| 20 to 24 Year Olds | 79 (100.0%) | 0 (0.0%) |
| 25 to 34 Year Olds | 36 (100.0%) | 0 (0.0%) |
| 35 Years and over | 57 (86.4%) | 9 (13.6%) |
| Total | 1,045 (98.2%) | 19 (1.8%) |
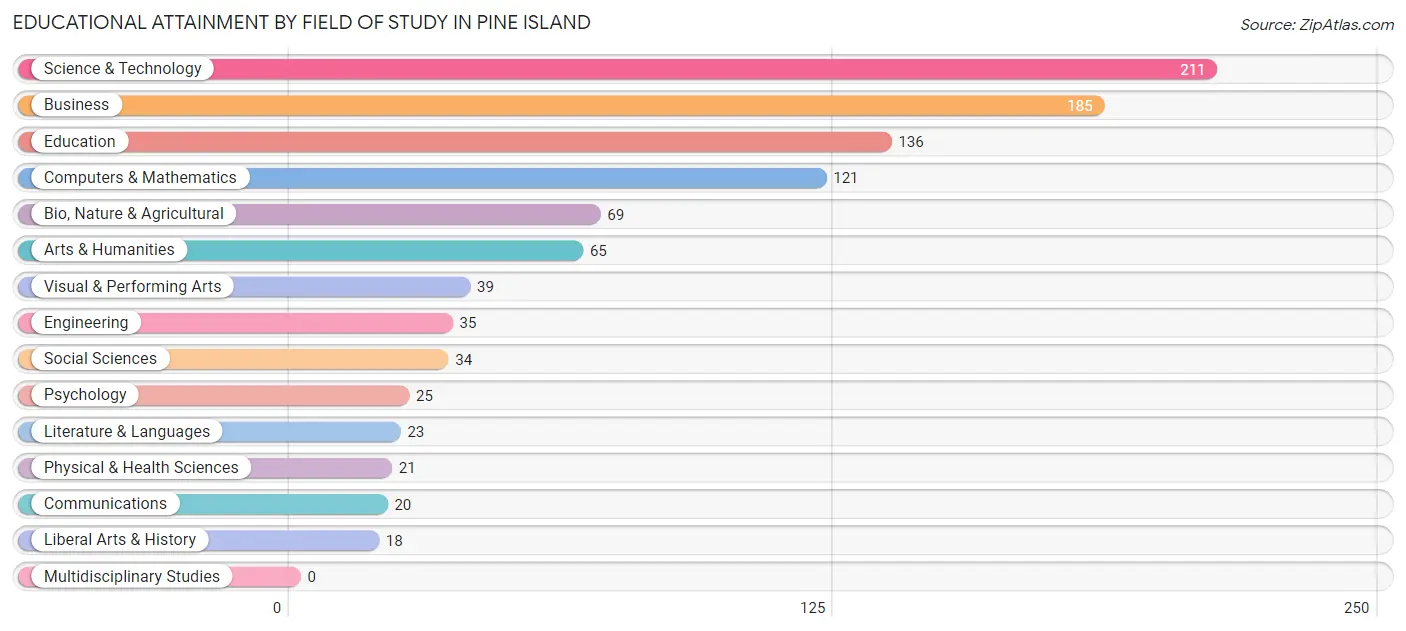
Educational Attainment by Field of Study in Pine Island
Science & technology (211 | 21.1%), business (185 | 18.5%), education (136 | 13.6%), computers & mathematics (121 | 12.1%), and bio, nature & agricultural (69 | 6.9%) are the most common fields of study among 1,002 individuals in Pine Island who have obtained a bachelor's degree or higher.
| Field of Study | # Graduates | % Graduates |
| Computers & Mathematics | 121 | 12.1% |
| Bio, Nature & Agricultural | 69 | 6.9% |
| Physical & Health Sciences | 21 | 2.1% |
| Psychology | 25 | 2.5% |
| Social Sciences | 34 | 3.4% |
| Engineering | 35 | 3.5% |
| Multidisciplinary Studies | 0 | 0.0% |
| Science & Technology | 211 | 21.1% |
| Business | 185 | 18.5% |
| Education | 136 | 13.6% |
| Literature & Languages | 23 | 2.3% |
| Liberal Arts & History | 18 | 1.8% |
| Visual & Performing Arts | 39 | 3.9% |
| Communications | 20 | 2.0% |
| Arts & Humanities | 65 | 6.5% |
| Total | 1,002 | 100.0% |
Transportation & Commute in Pine Island
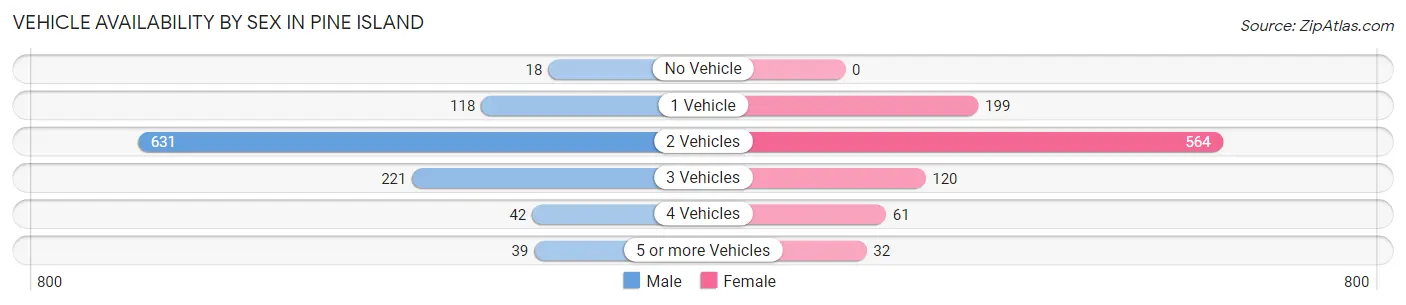
Vehicle Availability by Sex in Pine Island
The most prevalent vehicle ownership categories in Pine Island are males with 2 vehicles (631, accounting for 59.0%) and females with 2 vehicles (564, making up 64.6%).
| Vehicles Available | Male | Female |
| No Vehicle | 18 (1.7%) | 0 (0.0%) |
| 1 Vehicle | 118 (11.0%) | 199 (20.4%) |
| 2 Vehicles | 631 (59.0%) | 564 (57.8%) |
| 3 Vehicles | 221 (20.7%) | 120 (12.3%) |
| 4 Vehicles | 42 (3.9%) | 61 (6.2%) |
| 5 or more Vehicles | 39 (3.6%) | 32 (3.3%) |
| Total | 1,069 (100.0%) | 976 (100.0%) |
Commute Time in Pine Island
The most frequently occuring commute durations in Pine Island are 30 to 34 minutes (382 commuters, 21.8%), 15 to 19 minutes (363 commuters, 20.7%), and 20 to 24 minutes (288 commuters, 16.4%).
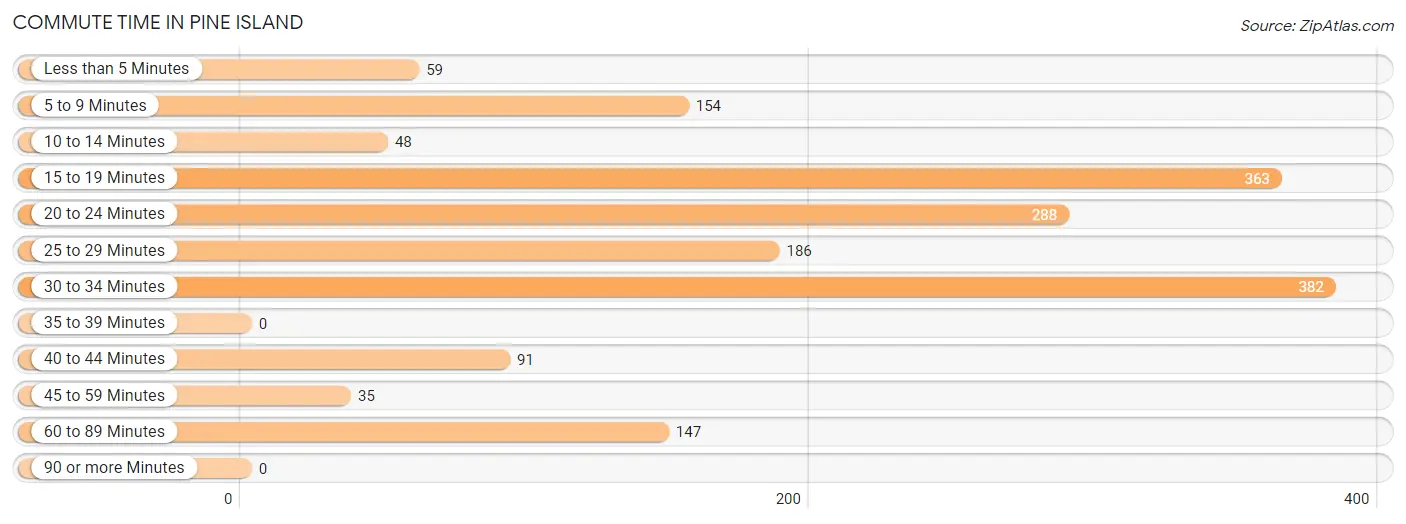
| Commute Time | # Commuters | % Commuters |
| Less than 5 Minutes | 59 | 3.4% |
| 5 to 9 Minutes | 154 | 8.8% |
| 10 to 14 Minutes | 48 | 2.7% |
| 15 to 19 Minutes | 363 | 20.7% |
| 20 to 24 Minutes | 288 | 16.4% |
| 25 to 29 Minutes | 186 | 10.6% |
| 30 to 34 Minutes | 382 | 21.8% |
| 35 to 39 Minutes | 0 | 0.0% |
| 40 to 44 Minutes | 91 | 5.2% |
| 45 to 59 Minutes | 35 | 2.0% |
| 60 to 89 Minutes | 147 | 8.4% |
| 90 or more Minutes | 0 | 0.0% |
Commute Time by Sex in Pine Island
The most common commute times in Pine Island are 20 to 24 minutes (214 commuters, 22.1%) for males and 30 to 34 minutes (226 commuters, 28.7%) for females.
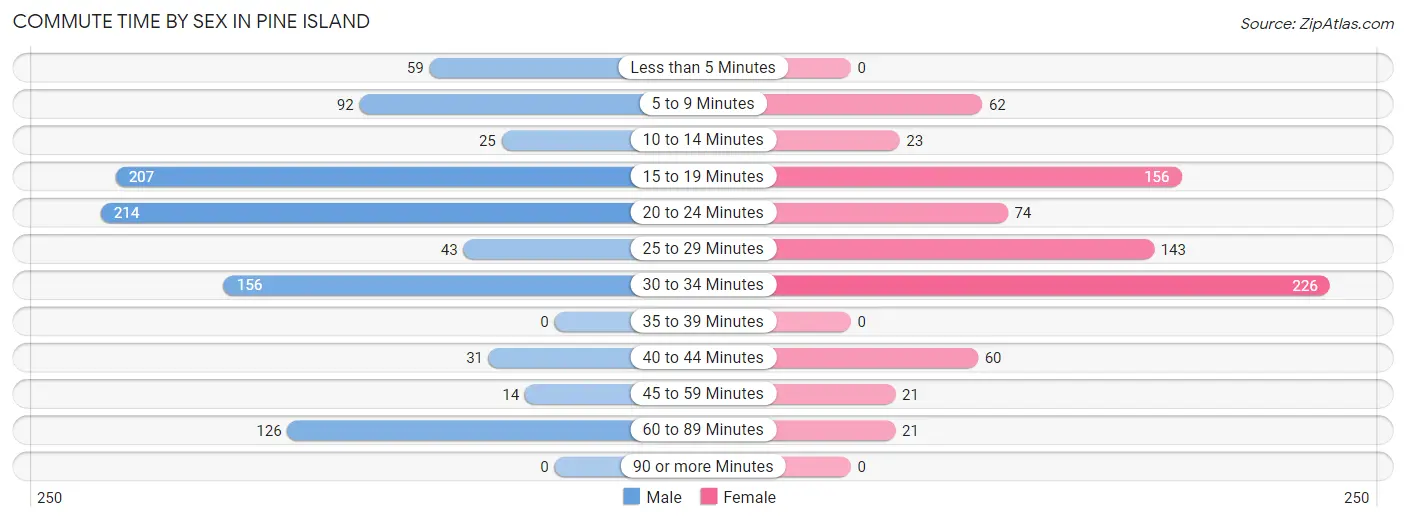
| Commute Time | Male | Female |
| Less than 5 Minutes | 59 (6.1%) | 0 (0.0%) |
| 5 to 9 Minutes | 92 (9.5%) | 62 (7.9%) |
| 10 to 14 Minutes | 25 (2.6%) | 23 (2.9%) |
| 15 to 19 Minutes | 207 (21.4%) | 156 (19.9%) |
| 20 to 24 Minutes | 214 (22.1%) | 74 (9.4%) |
| 25 to 29 Minutes | 43 (4.4%) | 143 (18.2%) |
| 30 to 34 Minutes | 156 (16.1%) | 226 (28.7%) |
| 35 to 39 Minutes | 0 (0.0%) | 0 (0.0%) |
| 40 to 44 Minutes | 31 (3.2%) | 60 (7.6%) |
| 45 to 59 Minutes | 14 (1.5%) | 21 (2.7%) |
| 60 to 89 Minutes | 126 (13.0%) | 21 (2.7%) |
| 90 or more Minutes | 0 (0.0%) | 0 (0.0%) |
Time of Departure to Work by Sex in Pine Island
The most frequent times of departure to work in Pine Island are 6:30 AM to 6:59 AM (211, 21.8%) for males and 7:00 AM to 7:29 AM (151, 19.2%) for females.
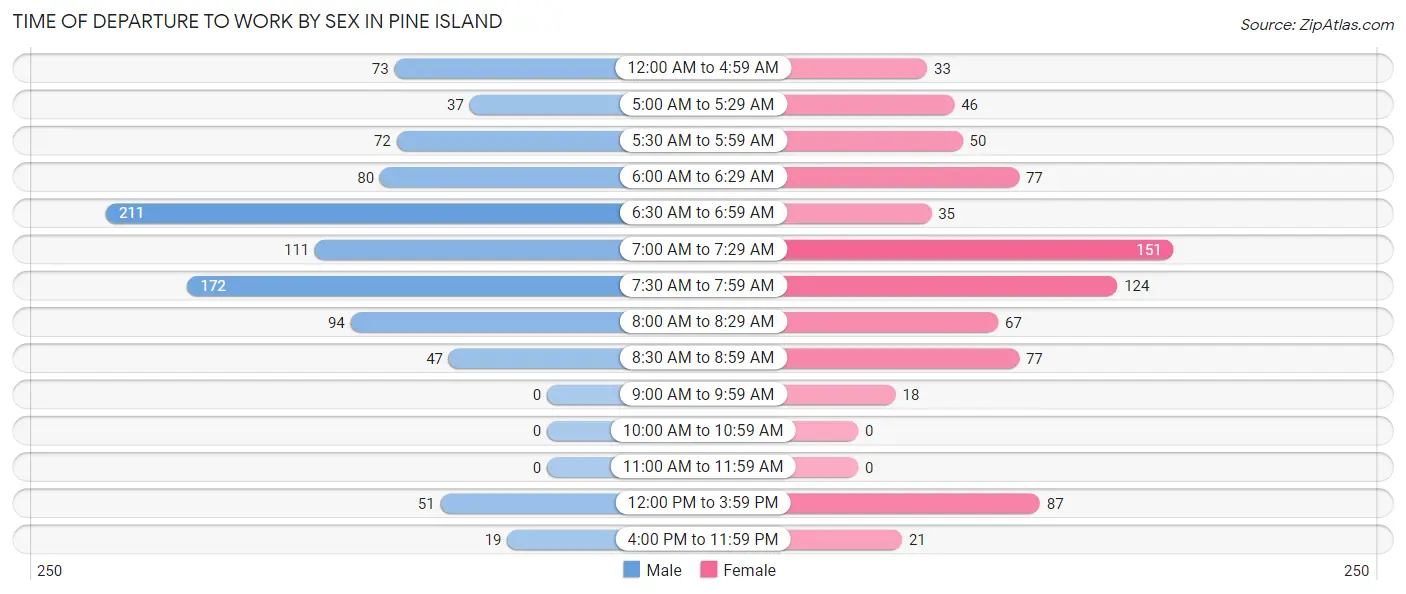
| Time of Departure | Male | Female |
| 12:00 AM to 4:59 AM | 73 (7.5%) | 33 (4.2%) |
| 5:00 AM to 5:29 AM | 37 (3.8%) | 46 (5.9%) |
| 5:30 AM to 5:59 AM | 72 (7.4%) | 50 (6.4%) |
| 6:00 AM to 6:29 AM | 80 (8.3%) | 77 (9.8%) |
| 6:30 AM to 6:59 AM | 211 (21.8%) | 35 (4.4%) |
| 7:00 AM to 7:29 AM | 111 (11.5%) | 151 (19.2%) |
| 7:30 AM to 7:59 AM | 172 (17.8%) | 124 (15.8%) |
| 8:00 AM to 8:29 AM | 94 (9.7%) | 67 (8.5%) |
| 8:30 AM to 8:59 AM | 47 (4.9%) | 77 (9.8%) |
| 9:00 AM to 9:59 AM | 0 (0.0%) | 18 (2.3%) |
| 10:00 AM to 10:59 AM | 0 (0.0%) | 0 (0.0%) |
| 11:00 AM to 11:59 AM | 0 (0.0%) | 0 (0.0%) |
| 12:00 PM to 3:59 PM | 51 (5.3%) | 87 (11.1%) |
| 4:00 PM to 11:59 PM | 19 (2.0%) | 21 (2.7%) |
| Total | 967 (100.0%) | 786 (100.0%) |
Housing Occupancy in Pine Island
Occupancy by Ownership in Pine Island
Of the total 1,508 dwellings in Pine Island, owner-occupied units account for 1,116 (74.0%), while renter-occupied units make up 392 (26.0%).
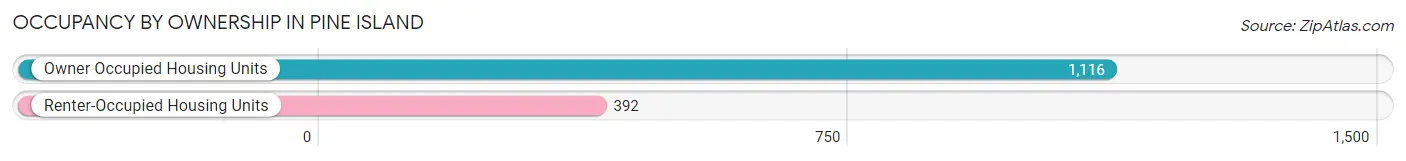
| Occupancy | # Housing Units | % Housing Units |
| Owner Occupied Housing Units | 1,116 | 74.0% |
| Renter-Occupied Housing Units | 392 | 26.0% |
| Total Occupied Housing Units | 1,508 | 100.0% |
Occupancy by Household Size in Pine Island
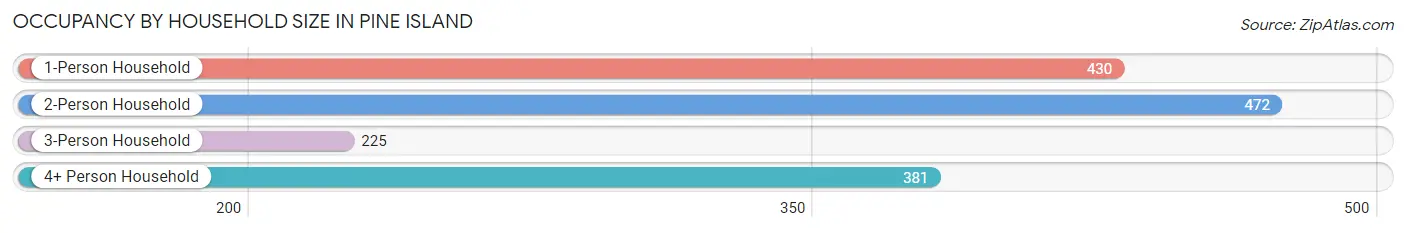
| Household Size | # Housing Units | % Housing Units |
| 1-Person Household | 430 | 28.5% |
| 2-Person Household | 472 | 31.3% |
| 3-Person Household | 225 | 14.9% |
| 4+ Person Household | 381 | 25.3% |
| Total Housing Units | 1,508 | 100.0% |
Occupancy by Ownership by Household Size in Pine Island
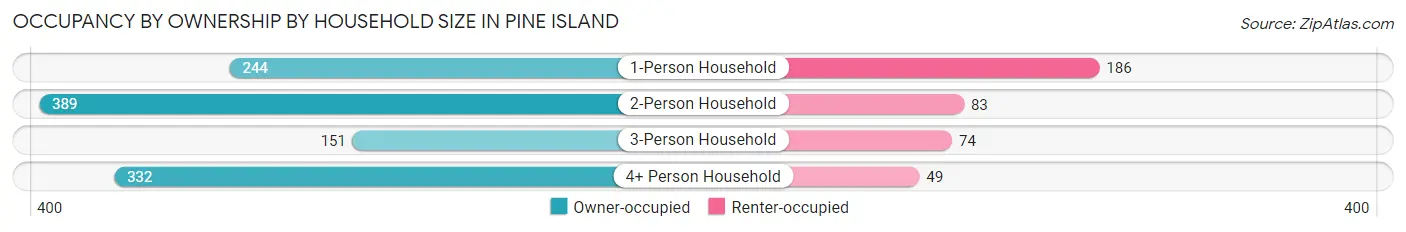
| Household Size | Owner-occupied | Renter-occupied |
| 1-Person Household | 244 (56.7%) | 186 (43.3%) |
| 2-Person Household | 389 (82.4%) | 83 (17.6%) |
| 3-Person Household | 151 (67.1%) | 74 (32.9%) |
| 4+ Person Household | 332 (87.1%) | 49 (12.9%) |
| Total Housing Units | 1,116 (74.0%) | 392 (26.0%) |
Occupancy by Educational Attainment in Pine Island
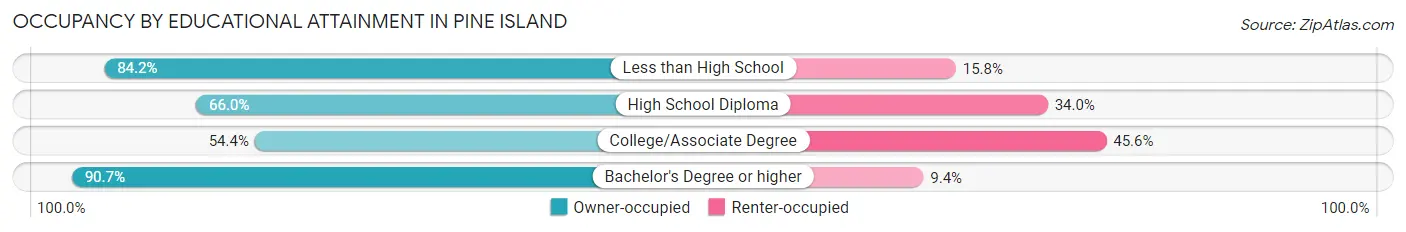
| Household Size | Owner-occupied | Renter-occupied |
| Less than High School | 48 (84.2%) | 9 (15.8%) |
| High School Diploma | 262 (66.0%) | 135 (34.0%) |
| College/Associate Degree | 224 (54.4%) | 188 (45.6%) |
| Bachelor's Degree or higher | 582 (90.6%) | 60 (9.3%) |
Occupancy by Age of Householder in Pine Island
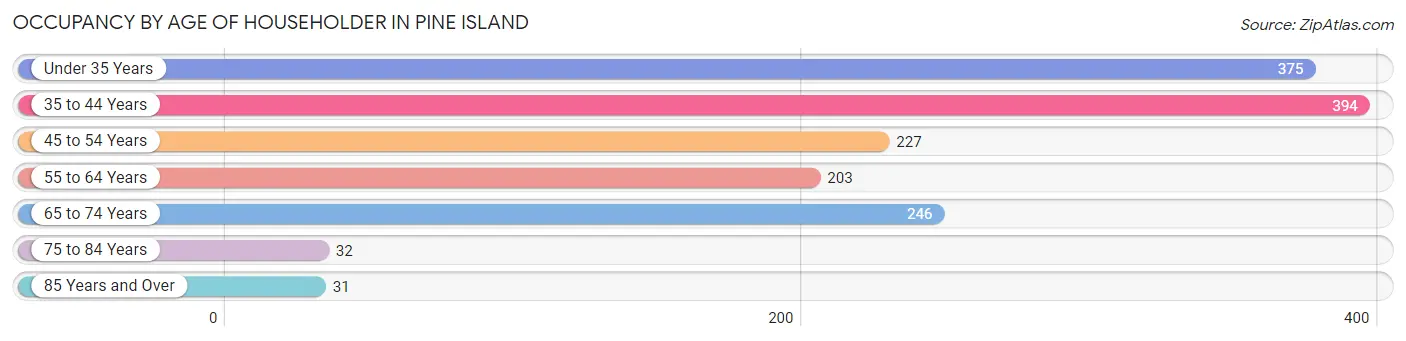
| Age Bracket | # Households | % Households |
| Under 35 Years | 375 | 24.9% |
| 35 to 44 Years | 394 | 26.1% |
| 45 to 54 Years | 227 | 15.0% |
| 55 to 64 Years | 203 | 13.5% |
| 65 to 74 Years | 246 | 16.3% |
| 75 to 84 Years | 32 | 2.1% |
| 85 Years and Over | 31 | 2.1% |
| Total | 1,508 | 100.0% |
Housing Finances in Pine Island
Median Income by Occupancy in Pine Island
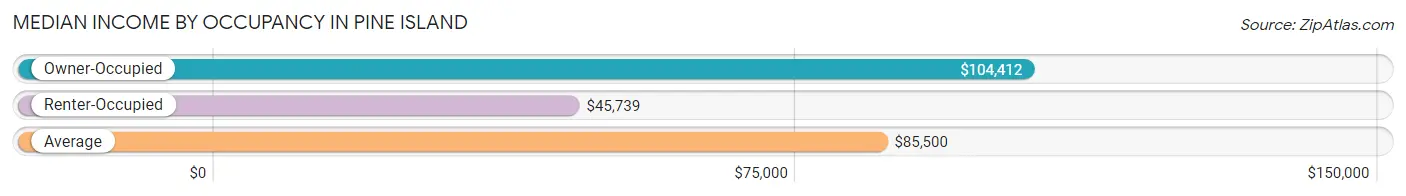
| Occupancy Type | # Households | Median Income |
| Owner-Occupied | 1,116 (74.0%) | $104,412 |
| Renter-Occupied | 392 (26.0%) | $45,739 |
| Average | 1,508 (100.0%) | $85,500 |
Occupancy by Householder Income Bracket in Pine Island
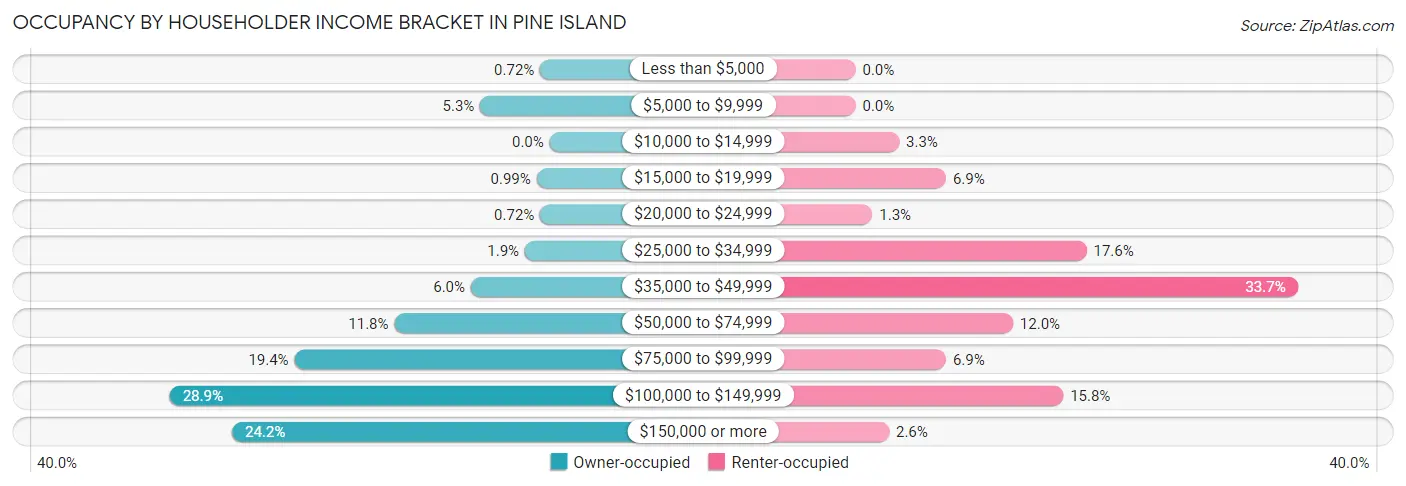
| Income Bracket | Owner-occupied | Renter-occupied |
| Less than $5,000 | 8 (0.7%) | 0 (0.0%) |
| $5,000 to $9,999 | 59 (5.3%) | 0 (0.0%) |
| $10,000 to $14,999 | 0 (0.0%) | 13 (3.3%) |
| $15,000 to $19,999 | 11 (1.0%) | 27 (6.9%) |
| $20,000 to $24,999 | 8 (0.7%) | 5 (1.3%) |
| $25,000 to $34,999 | 21 (1.9%) | 69 (17.6%) |
| $35,000 to $49,999 | 67 (6.0%) | 132 (33.7%) |
| $50,000 to $74,999 | 132 (11.8%) | 47 (12.0%) |
| $75,000 to $99,999 | 217 (19.4%) | 27 (6.9%) |
| $100,000 to $149,999 | 323 (28.9%) | 62 (15.8%) |
| $150,000 or more | 270 (24.2%) | 10 (2.5%) |
| Total | 1,116 (100.0%) | 392 (100.0%) |
Monthly Housing Cost Tiers in Pine Island
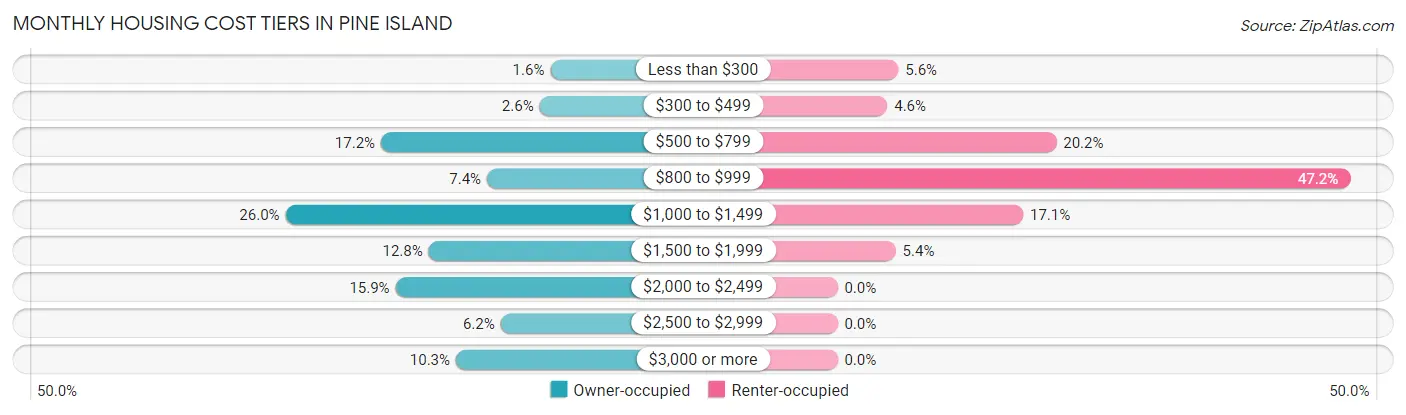
| Monthly Cost | Owner-occupied | Renter-occupied |
| Less than $300 | 18 (1.6%) | 22 (5.6%) |
| $300 to $499 | 29 (2.6%) | 18 (4.6%) |
| $500 to $799 | 192 (17.2%) | 79 (20.2%) |
| $800 to $999 | 83 (7.4%) | 185 (47.2%) |
| $1,000 to $1,499 | 290 (26.0%) | 67 (17.1%) |
| $1,500 to $1,999 | 143 (12.8%) | 21 (5.4%) |
| $2,000 to $2,499 | 177 (15.9%) | 0 (0.0%) |
| $2,500 to $2,999 | 69 (6.2%) | 0 (0.0%) |
| $3,000 or more | 115 (10.3%) | 0 (0.0%) |
| Total | 1,116 (100.0%) | 392 (100.0%) |
Physical Housing Characteristics in Pine Island
Housing Structures in Pine Island
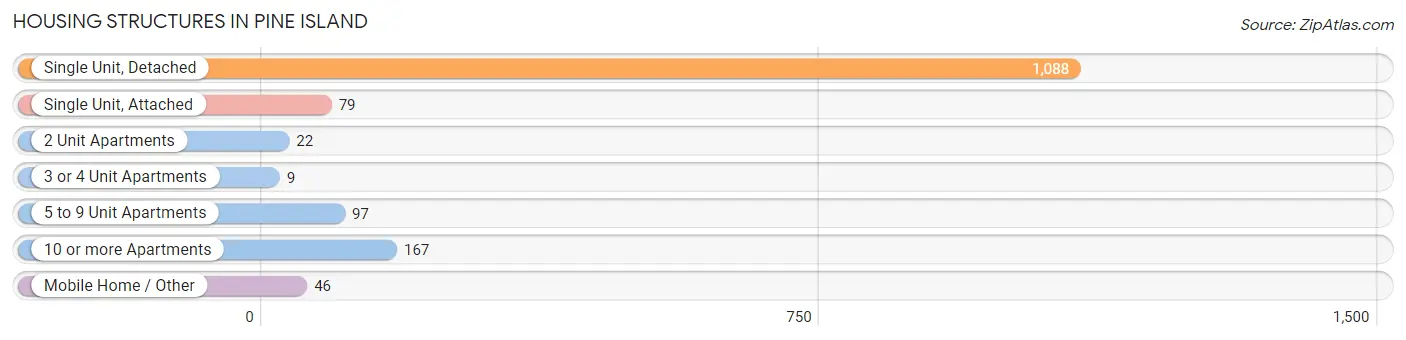
| Structure Type | # Housing Units | % Housing Units |
| Single Unit, Detached | 1,088 | 72.2% |
| Single Unit, Attached | 79 | 5.2% |
| 2 Unit Apartments | 22 | 1.5% |
| 3 or 4 Unit Apartments | 9 | 0.6% |
| 5 to 9 Unit Apartments | 97 | 6.4% |
| 10 or more Apartments | 167 | 11.1% |
| Mobile Home / Other | 46 | 3.0% |
| Total | 1,508 | 100.0% |
Housing Structures by Occupancy in Pine Island
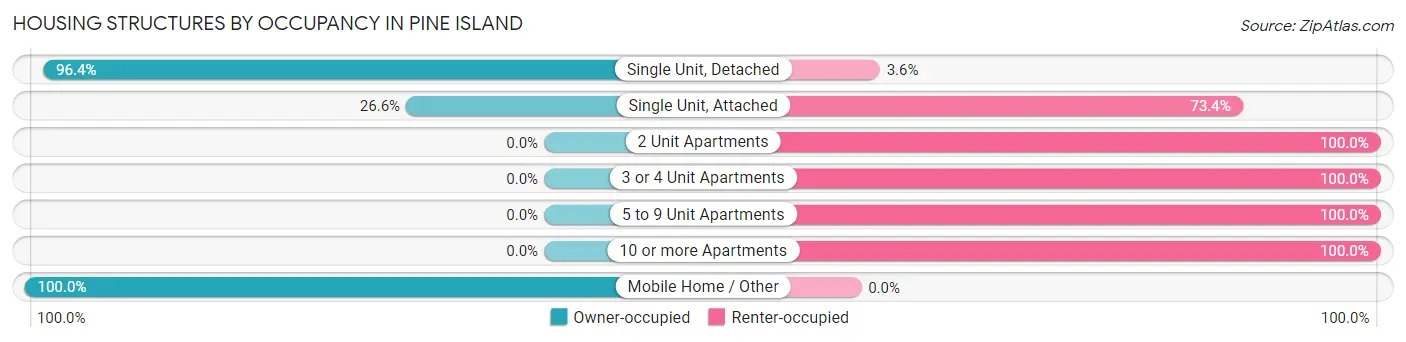
| Structure Type | Owner-occupied | Renter-occupied |
| Single Unit, Detached | 1,049 (96.4%) | 39 (3.6%) |
| Single Unit, Attached | 21 (26.6%) | 58 (73.4%) |
| 2 Unit Apartments | 0 (0.0%) | 22 (100.0%) |
| 3 or 4 Unit Apartments | 0 (0.0%) | 9 (100.0%) |
| 5 to 9 Unit Apartments | 0 (0.0%) | 97 (100.0%) |
| 10 or more Apartments | 0 (0.0%) | 167 (100.0%) |
| Mobile Home / Other | 46 (100.0%) | 0 (0.0%) |
| Total | 1,116 (74.0%) | 392 (26.0%) |
Housing Structures by Number of Rooms in Pine Island
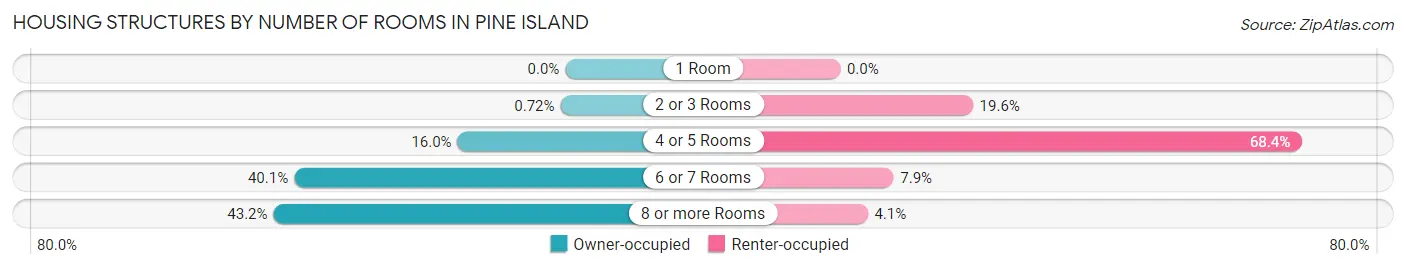
| Number of Rooms | Owner-occupied | Renter-occupied |
| 1 Room | 0 (0.0%) | 0 (0.0%) |
| 2 or 3 Rooms | 8 (0.7%) | 77 (19.6%) |
| 4 or 5 Rooms | 178 (16.0%) | 268 (68.4%) |
| 6 or 7 Rooms | 448 (40.1%) | 31 (7.9%) |
| 8 or more Rooms | 482 (43.2%) | 16 (4.1%) |
| Total | 1,116 (100.0%) | 392 (100.0%) |
Housing Structure by Heating Type in Pine Island
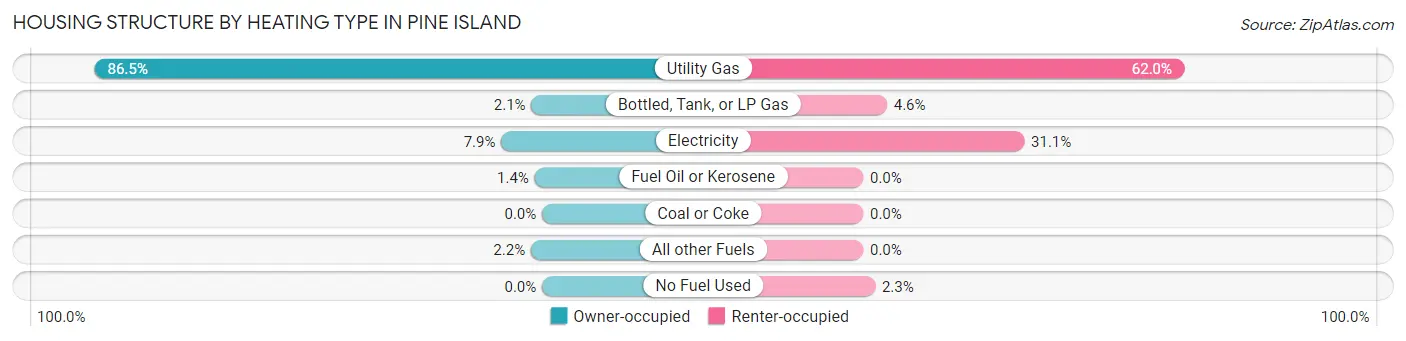
| Heating Type | Owner-occupied | Renter-occupied |
| Utility Gas | 965 (86.5%) | 243 (62.0%) |
| Bottled, Tank, or LP Gas | 23 (2.1%) | 18 (4.6%) |
| Electricity | 88 (7.9%) | 122 (31.1%) |
| Fuel Oil or Kerosene | 16 (1.4%) | 0 (0.0%) |
| Coal or Coke | 0 (0.0%) | 0 (0.0%) |
| All other Fuels | 24 (2.1%) | 0 (0.0%) |
| No Fuel Used | 0 (0.0%) | 9 (2.3%) |
| Total | 1,116 (100.0%) | 392 (100.0%) |
Household Vehicle Usage in Pine Island
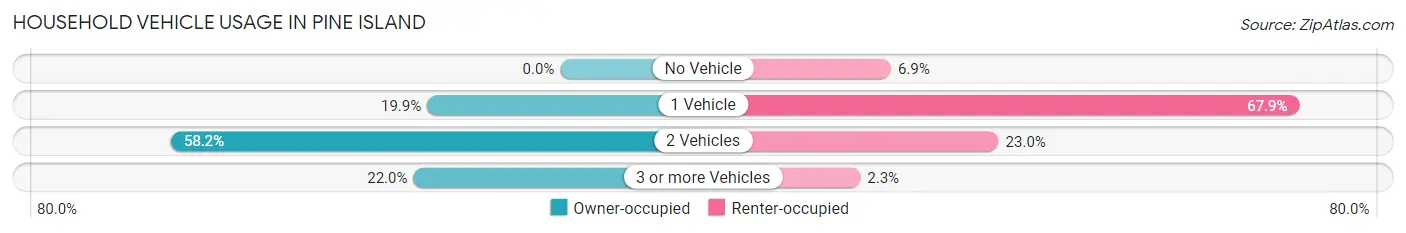
| Vehicles per Household | Owner-occupied | Renter-occupied |
| No Vehicle | 0 (0.0%) | 27 (6.9%) |
| 1 Vehicle | 222 (19.9%) | 266 (67.9%) |
| 2 Vehicles | 649 (58.2%) | 90 (23.0%) |
| 3 or more Vehicles | 245 (22.0%) | 9 (2.3%) |
| Total | 1,116 (100.0%) | 392 (100.0%) |
Real Estate & Mortgages in Pine Island
Real Estate and Mortgage Overview in Pine Island
| Characteristic | Without Mortgage | With Mortgage |
| Housing Units | 334 | 782 |
| Median Property Value | $302,800 | $289,800 |
| Median Household Income | $63,750 | $250 |
| Monthly Housing Costs | $636 | $115 |
| Real Estate Taxes | $3,637 | $0 |
Property Value by Mortgage Status in Pine Island
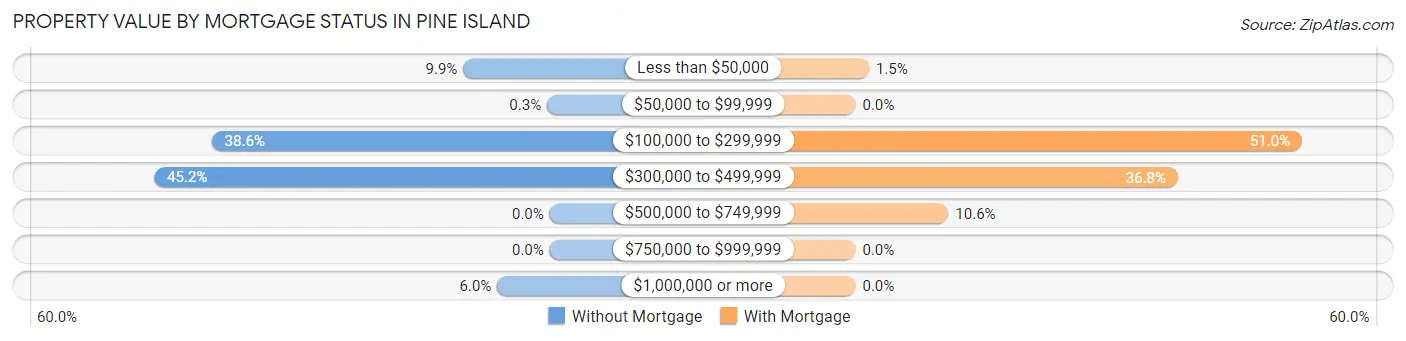
| Property Value | Without Mortgage | With Mortgage |
| Less than $50,000 | 33 (9.9%) | 12 (1.5%) |
| $50,000 to $99,999 | 1 (0.3%) | 0 (0.0%) |
| $100,000 to $299,999 | 129 (38.6%) | 399 (51.0%) |
| $300,000 to $499,999 | 151 (45.2%) | 288 (36.8%) |
| $500,000 to $749,999 | 0 (0.0%) | 83 (10.6%) |
| $750,000 to $999,999 | 0 (0.0%) | 0 (0.0%) |
| $1,000,000 or more | 20 (6.0%) | 0 (0.0%) |
| Total | 334 (100.0%) | 782 (100.0%) |
Household Income by Mortgage Status in Pine Island
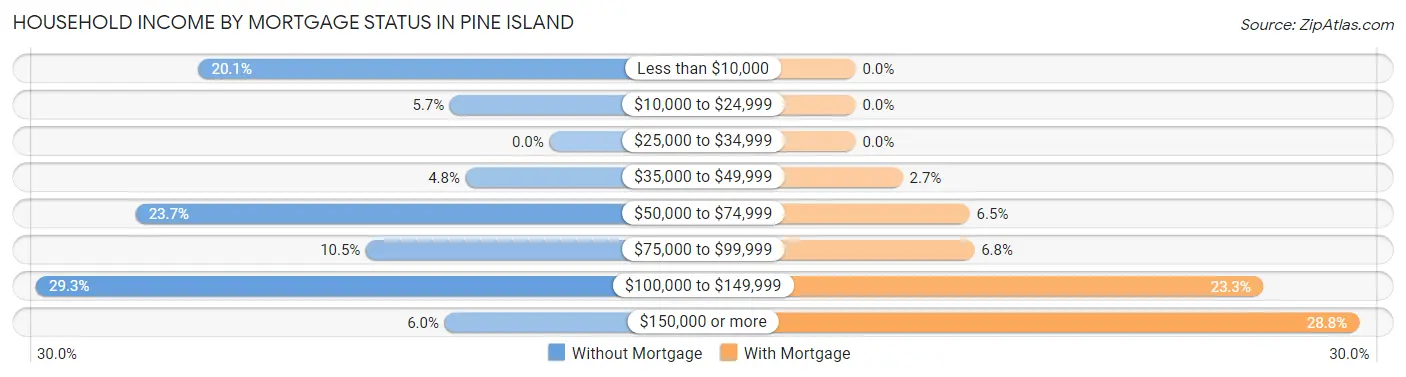
| Household Income | Without Mortgage | With Mortgage |
| Less than $10,000 | 67 (20.1%) | 0 (0.0%) |
| $10,000 to $24,999 | 19 (5.7%) | 0 (0.0%) |
| $25,000 to $34,999 | 0 (0.0%) | 0 (0.0%) |
| $35,000 to $49,999 | 16 (4.8%) | 21 (2.7%) |
| $50,000 to $74,999 | 79 (23.6%) | 51 (6.5%) |
| $75,000 to $99,999 | 35 (10.5%) | 53 (6.8%) |
| $100,000 to $149,999 | 98 (29.3%) | 182 (23.3%) |
| $150,000 or more | 20 (6.0%) | 225 (28.8%) |
| Total | 334 (100.0%) | 782 (100.0%) |
Property Value to Household Income Ratio in Pine Island
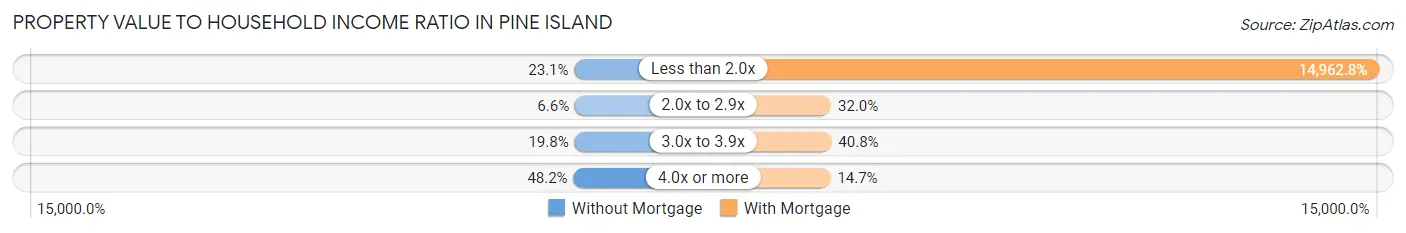
| Value-to-Income Ratio | Without Mortgage | With Mortgage |
| Less than 2.0x | 77 (23.1%) | 117,009 (14,962.8%) |
| 2.0x to 2.9x | 22 (6.6%) | 250 (32.0%) |
| 3.0x to 3.9x | 66 (19.8%) | 319 (40.8%) |
| 4.0x or more | 161 (48.2%) | 115 (14.7%) |
| Total | 334 (100.0%) | 782 (100.0%) |
Real Estate Taxes by Mortgage Status in Pine Island
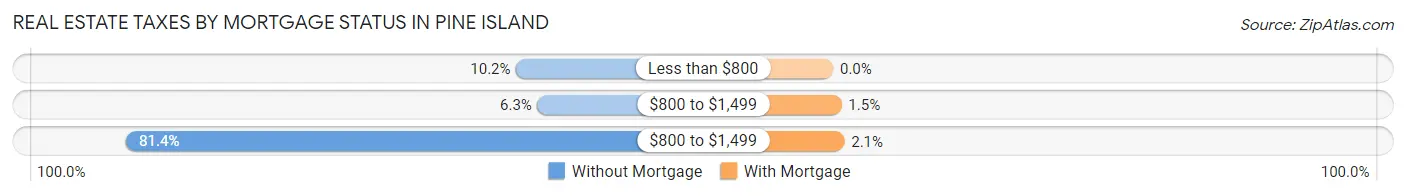
| Property Taxes | Without Mortgage | With Mortgage |
| Less than $800 | 34 (10.2%) | 0 (0.0%) |
| $800 to $1,499 | 21 (6.3%) | 12 (1.5%) |
| $800 to $1,499 | 272 (81.4%) | 16 (2.1%) |
| Total | 334 (100.0%) | 782 (100.0%) |
Health & Disability in Pine Island
Health Insurance Coverage by Age in Pine Island
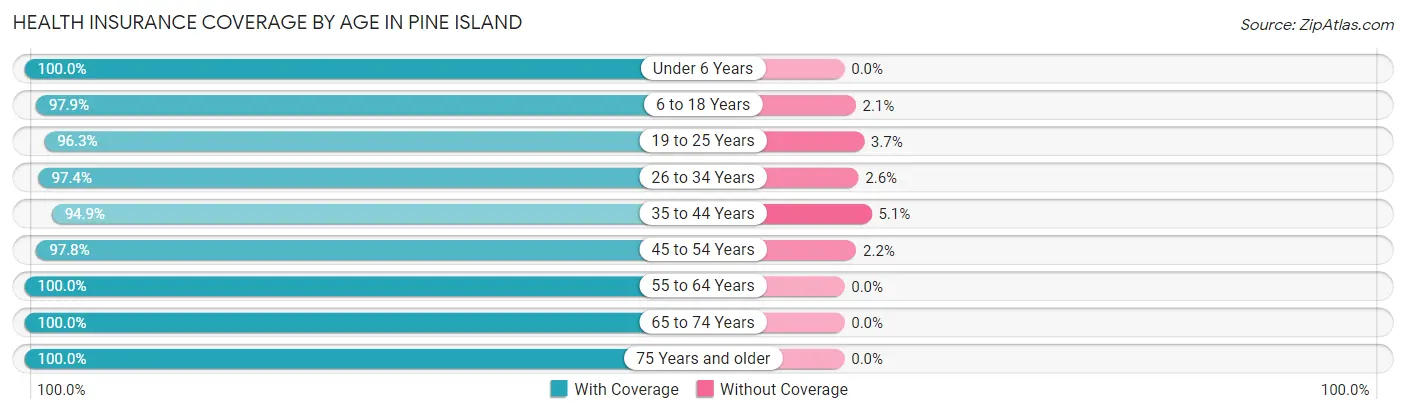
| Age Bracket | With Coverage | Without Coverage |
| Under 6 Years | 337 (100.0%) | 0 (0.0%) |
| 6 to 18 Years | 745 (97.9%) | 16 (2.1%) |
| 19 to 25 Years | 342 (96.3%) | 13 (3.7%) |
| 26 to 34 Years | 409 (97.4%) | 11 (2.6%) |
| 35 to 44 Years | 638 (94.9%) | 34 (5.1%) |
| 45 to 54 Years | 444 (97.8%) | 10 (2.2%) |
| 55 to 64 Years | 315 (100.0%) | 0 (0.0%) |
| 65 to 74 Years | 334 (100.0%) | 0 (0.0%) |
| 75 Years and older | 112 (100.0%) | 0 (0.0%) |
| Total | 3,676 (97.8%) | 84 (2.2%) |
Health Insurance Coverage by Citizenship Status in Pine Island
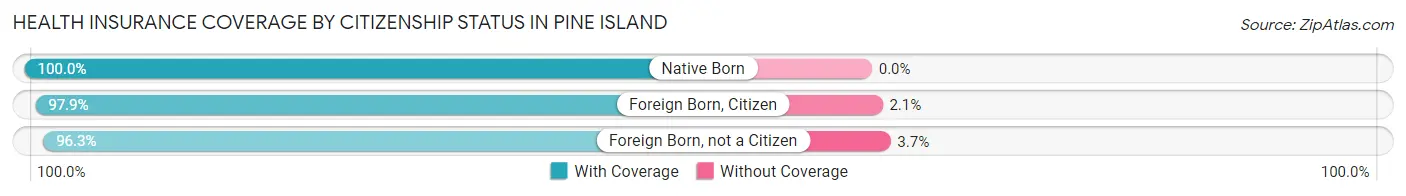
| Citizenship Status | With Coverage | Without Coverage |
| Native Born | 337 (100.0%) | 0 (0.0%) |
| Foreign Born, Citizen | 745 (97.9%) | 16 (2.1%) |
| Foreign Born, not a Citizen | 342 (96.3%) | 13 (3.7%) |
Health Insurance Coverage by Household Income in Pine Island
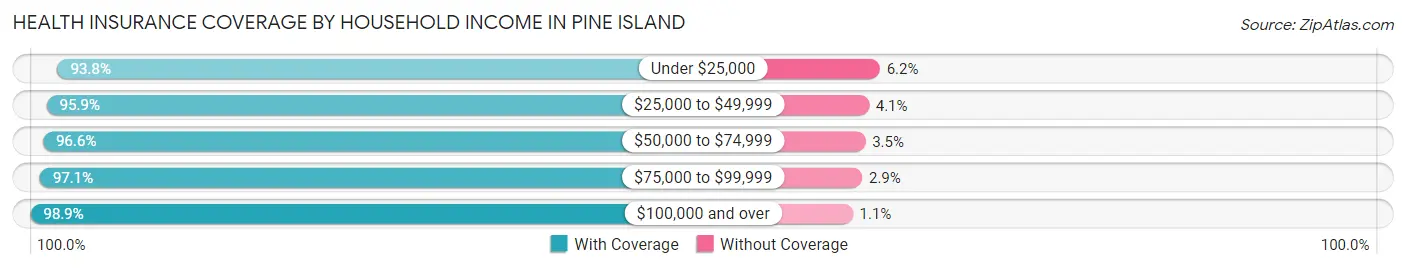
| Household Income | With Coverage | Without Coverage |
| Under $25,000 | 152 (93.8%) | 10 (6.2%) |
| $25,000 to $49,999 | 442 (95.9%) | 19 (4.1%) |
| $50,000 to $74,999 | 448 (96.6%) | 16 (3.5%) |
| $75,000 to $99,999 | 544 (97.1%) | 16 (2.9%) |
| $100,000 and over | 2,090 (98.9%) | 23 (1.1%) |
Public vs Private Health Insurance Coverage by Age in Pine Island
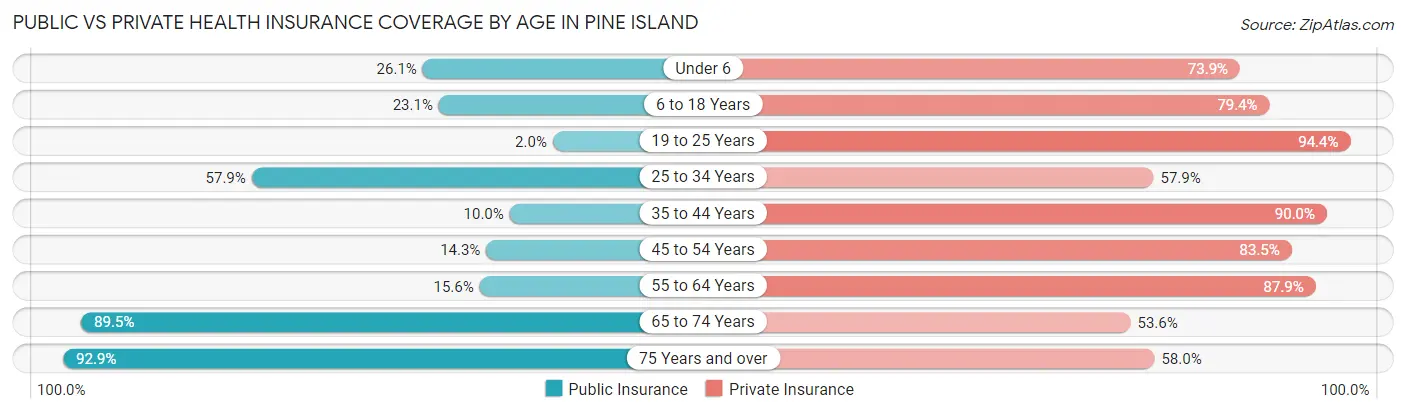
| Age Bracket | Public Insurance | Private Insurance |
| Under 6 | 88 (26.1%) | 249 (73.9%) |
| 6 to 18 Years | 176 (23.1%) | 604 (79.4%) |
| 19 to 25 Years | 7 (2.0%) | 335 (94.4%) |
| 25 to 34 Years | 243 (57.9%) | 243 (57.9%) |
| 35 to 44 Years | 67 (10.0%) | 605 (90.0%) |
| 45 to 54 Years | 65 (14.3%) | 379 (83.5%) |
| 55 to 64 Years | 49 (15.6%) | 277 (87.9%) |
| 65 to 74 Years | 299 (89.5%) | 179 (53.6%) |
| 75 Years and over | 104 (92.9%) | 65 (58.0%) |
| Total | 1,098 (29.2%) | 2,936 (78.1%) |
Disability Status by Sex by Age in Pine Island
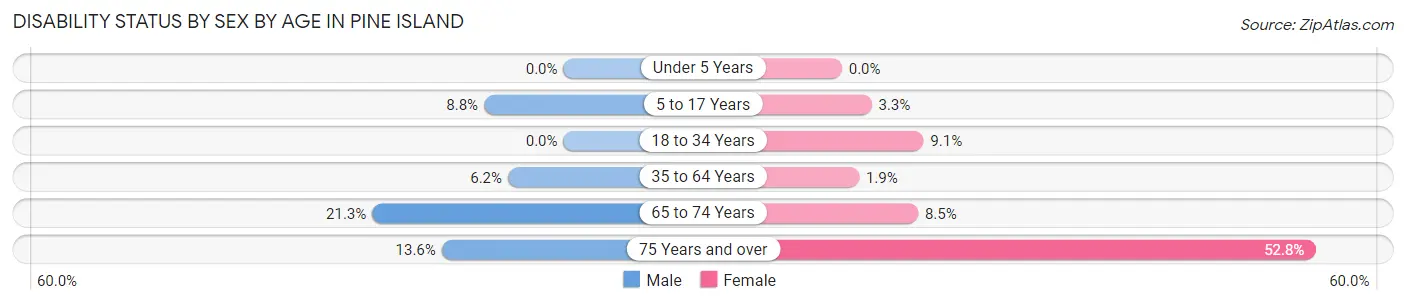
| Age Bracket | Male | Female |
| Under 5 Years | 0 (0.0%) | 0 (0.0%) |
| 5 to 17 Years | 39 (8.8%) | 12 (3.3%) |
| 18 to 34 Years | 0 (0.0%) | 38 (9.1%) |
| 35 to 64 Years | 47 (6.2%) | 13 (1.9%) |
| 65 to 74 Years | 36 (21.3%) | 14 (8.5%) |
| 75 Years and over | 8 (13.6%) | 28 (52.8%) |
Disability Class by Sex by Age in Pine Island
Disability Class: Hearing Difficulty
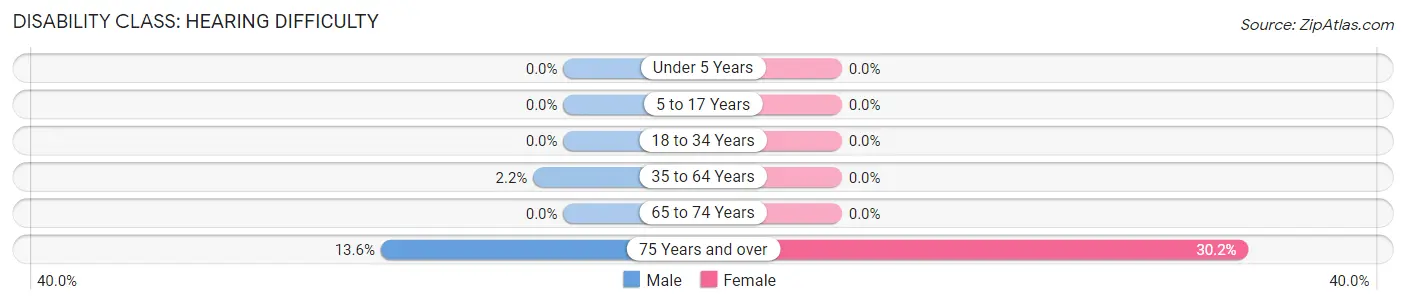
| Age Bracket | Male | Female |
| Under 5 Years | 0 (0.0%) | 0 (0.0%) |
| 5 to 17 Years | 0 (0.0%) | 0 (0.0%) |
| 18 to 34 Years | 0 (0.0%) | 0 (0.0%) |
| 35 to 64 Years | 17 (2.2%) | 0 (0.0%) |
| 65 to 74 Years | 0 (0.0%) | 0 (0.0%) |
| 75 Years and over | 8 (13.6%) | 16 (30.2%) |
Disability Class: Vision Difficulty
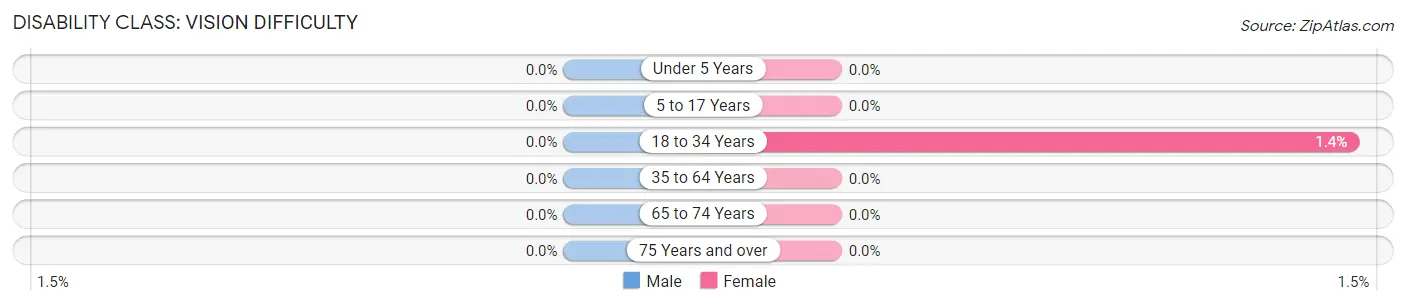
| Age Bracket | Male | Female |
| Under 5 Years | 0 (0.0%) | 0 (0.0%) |
| 5 to 17 Years | 0 (0.0%) | 0 (0.0%) |
| 18 to 34 Years | 0 (0.0%) | 6 (1.4%) |
| 35 to 64 Years | 0 (0.0%) | 0 (0.0%) |
| 65 to 74 Years | 0 (0.0%) | 0 (0.0%) |
| 75 Years and over | 0 (0.0%) | 0 (0.0%) |
Disability Class: Cognitive Difficulty
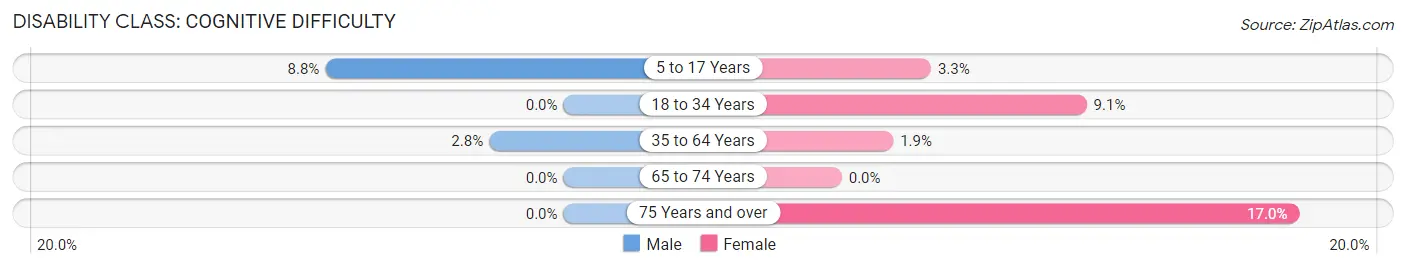
| Age Bracket | Male | Female |
| 5 to 17 Years | 39 (8.8%) | 12 (3.3%) |
| 18 to 34 Years | 0 (0.0%) | 38 (9.1%) |
| 35 to 64 Years | 21 (2.8%) | 13 (1.9%) |
| 65 to 74 Years | 0 (0.0%) | 0 (0.0%) |
| 75 Years and over | 0 (0.0%) | 9 (17.0%) |
Disability Class: Ambulatory Difficulty
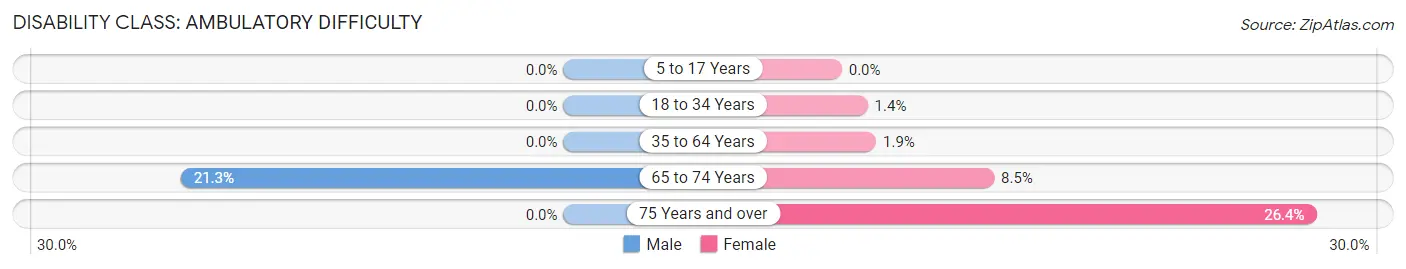
| Age Bracket | Male | Female |
| 5 to 17 Years | 0 (0.0%) | 0 (0.0%) |
| 18 to 34 Years | 0 (0.0%) | 6 (1.4%) |
| 35 to 64 Years | 0 (0.0%) | 13 (1.9%) |
| 65 to 74 Years | 36 (21.3%) | 14 (8.5%) |
| 75 Years and over | 0 (0.0%) | 14 (26.4%) |
Disability Class: Self-Care Difficulty
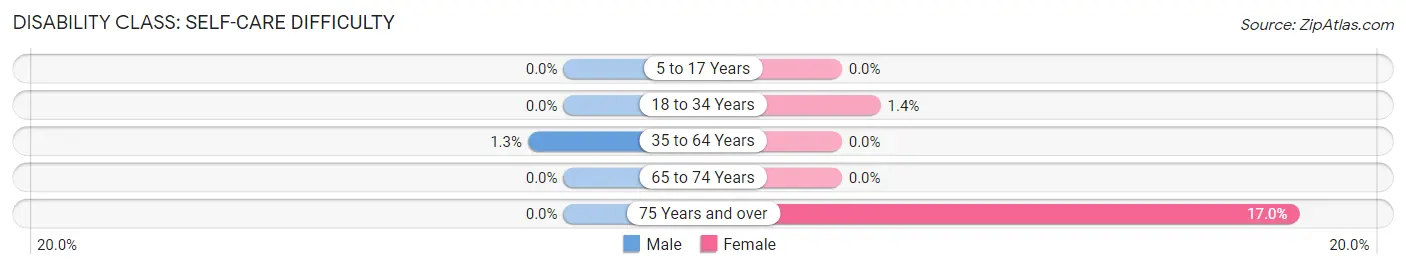
| Age Bracket | Male | Female |
| 5 to 17 Years | 0 (0.0%) | 0 (0.0%) |
| 18 to 34 Years | 0 (0.0%) | 6 (1.4%) |
| 35 to 64 Years | 10 (1.3%) | 0 (0.0%) |
| 65 to 74 Years | 0 (0.0%) | 0 (0.0%) |
| 75 Years and over | 0 (0.0%) | 9 (17.0%) |
Technology Access in Pine Island
Computing Device Access in Pine Island
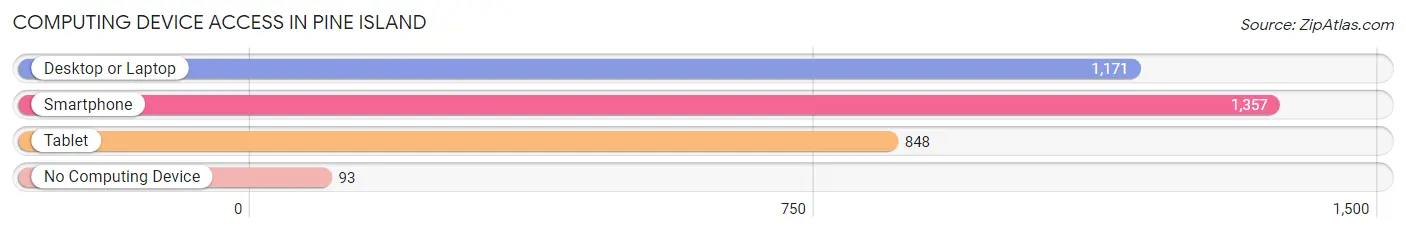
| Device Type | # Households | % Households |
| Desktop or Laptop | 1,171 | 77.6% |
| Smartphone | 1,357 | 90.0% |
| Tablet | 848 | 56.2% |
| No Computing Device | 93 | 6.2% |
| Total | 1,508 | 100.0% |
Internet Access in Pine Island
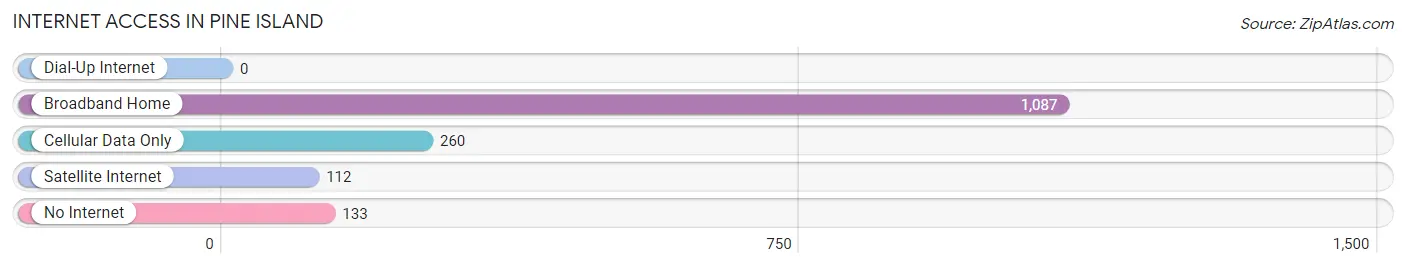
| Internet Type | # Households | % Households |
| Dial-Up Internet | 0 | 0.0% |
| Broadband Home | 1,087 | 72.1% |
| Cellular Data Only | 260 | 17.2% |
| Satellite Internet | 112 | 7.4% |
| No Internet | 133 | 8.8% |
| Total | 1,508 | 100.0% |
Pine Island Summary
Pine Island, Minnesota is a small city located in Goodhue County, Minnesota. It is situated on the banks of the Zumbro River, about 25 miles south of the Twin Cities. The city has a population of approximately 3,000 people and is known for its rural charm and small-town atmosphere.
History
Pine Island was first settled in 1854 by a group of Swedish immigrants. The city was originally known as Swede Town, but was later renamed Pine Island after the abundance of pine trees in the area. The city was officially incorporated in 1872.
In the late 19th century, Pine Island was a thriving agricultural community. The city was home to several grain mills, a creamery, and a cheese factory. The city also had a thriving lumber industry, with several sawmills located in the area.
In the early 20th century, Pine Island began to experience a decline in its agricultural industry. This was due to the introduction of new farming technologies and the increasing popularity of larger cities. The city’s population began to decline as people moved away in search of better opportunities.
Geography
Pine Island is located in the southeastern corner of Goodhue County, Minnesota. The city is situated on the banks of the Zumbro River, about 25 miles south of the Twin Cities. The city is surrounded by rolling hills and farmland, with the Zumbro River running through the center of town.
The city has a total area of 2.2 square miles, all of which is land. The city has a humid continental climate, with cold winters and hot summers. The average annual temperature is around 40 degrees Fahrenheit.
Economy
Pine Island’s economy is largely based on agriculture and tourism. The city is home to several farms, which produce a variety of crops, including corn, soybeans, and wheat. The city also has a thriving tourism industry, with many visitors coming to the area to enjoy the rural charm and small-town atmosphere.
The city is also home to several small businesses, including restaurants, retail stores, and service providers. The city also has a small manufacturing sector, with several companies producing a variety of products, including furniture, clothing, and electronics.
Demographics
As of the 2010 census, Pine Island had a population of 3,000 people. The racial makeup of the city was 97.2% White, 0.7% African American, 0.3% Native American, 0.3% Asian, 0.1% Pacific Islander, and 1.4% from other races. The median household income was $50,000, and the median family income was $54,000.
Pine Island is a small city with a rural charm and small-town atmosphere. The city is home to a diverse population and a thriving economy. The city is a great place to live, work, and raise a family.
Common Questions
What is Per Capita Income in Pine Island?
Per Capita income in Pine Island is $38,479.
What is the Median Family Income in Pine Island?
Median Family Income in Pine Island is $117,005.
What is the Median Household income in Pine Island?
Median Household Income in Pine Island is $85,500.
What is Income or Wage Gap in Pine Island?
Income or Wage Gap in Pine Island is 8.9%.
Women in Pine Island earn 91.1 cents for every dollar earned by a man.
What is Inequality or Gini Index in Pine Island?
Inequality or Gini Index in Pine Island is 0.36.
What is the Total Population of Pine Island?
Total Population of Pine Island is 3,831.
What is the Total Male Population of Pine Island?
Total Male Population of Pine Island is 1,977.
What is the Total Female Population of Pine Island?
Total Female Population of Pine Island is 1,854.
What is the Ratio of Males per 100 Females in Pine Island?
There are 106.63 Males per 100 Females in Pine Island.
What is the Ratio of Females per 100 Males in Pine Island?
There are 93.78 Females per 100 Males in Pine Island.
What is the Median Population Age in Pine Island?
Median Population Age in Pine Island is 35.4 Years.
What is the Average Family Size in Pine Island
Average Family Size in Pine Island is 3.3 People.
What is the Average Household Size in Pine Island
Average Household Size in Pine Island is 2.5 People.
How Large is the Labor Force in Pine Island?
There are 2,126 People in the Labor Forcein in Pine Island.
What is the Percentage of People in the Labor Force in Pine Island?
74.8% of People are in the Labor Force in Pine Island.
What is the Unemployment Rate in Pine Island?
Unemployment Rate in Pine Island is 2.3%.