Waverly, MN Map & Demographics
Waverly Map
Waverly Overview
$42,055
PER CAPITA INCOME
$108,615
AVG FAMILY INCOME
$108,731
AVG HOUSEHOLD INCOME
16.3%
WAGE / INCOME GAP [ % ]
83.7¢/ $1
WAGE / INCOME GAP [ $ ]
$18,745
FAMILY INCOME DEFICIT
0.29
INEQUALITY / GINI INDEX
1,803
TOTAL POPULATION
1,003
MALE POPULATION
800
FEMALE POPULATION
125.38
MALES / 100 FEMALES
79.76
FEMALES / 100 MALES
34.4
MEDIAN AGE
2.9
AVG FAMILY SIZE
2.7
AVG HOUSEHOLD SIZE
1,050
LABOR FORCE [ PEOPLE ]
75.3%
PERCENT IN LABOR FORCE
0.4%
UNEMPLOYMENT RATE
Waverly Zip Codes
Income in Waverly
Income Overview in Waverly
Per Capita Income in Waverly is $42,055, while median incomes of families and households are $108,615 and $108,731 respectively.
| Characteristic | Number | Measure |
| Per Capita Income | 1,803 | $42,055 |
| Median Family Income | 512 | $108,615 |
| Mean Family Income | 512 | $119,016 |
| Median Household Income | 650 | $108,731 |
| Mean Household Income | 650 | $116,406 |
| Income Deficit | 512 | $18,745 |
| Wage / Income Gap (%) | 1,803 | 16.30% |
| Wage / Income Gap ($) | 1,803 | 83.70¢ per $1 |
| Gini / Inequality Index | 1,803 | 0.29 |
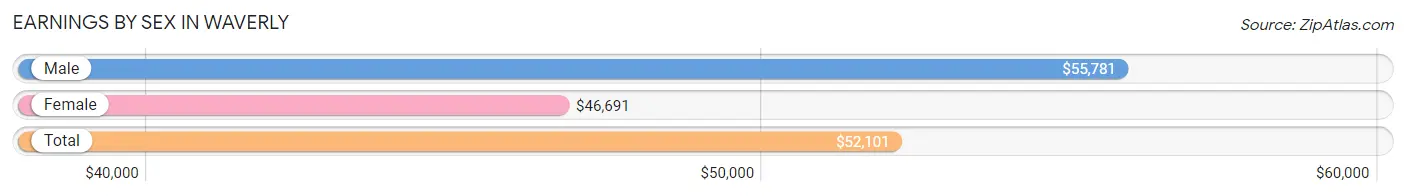
Earnings by Sex in Waverly
Average Earnings in Waverly are $52,101, $55,781 for men and $46,691 for women, a difference of 16.3%.
| Sex | Number | Average Earnings |
| Male | 626 (56.4%) | $55,781 |
| Female | 484 (43.6%) | $46,691 |
| Total | 1,110 (100.0%) | $52,101 |
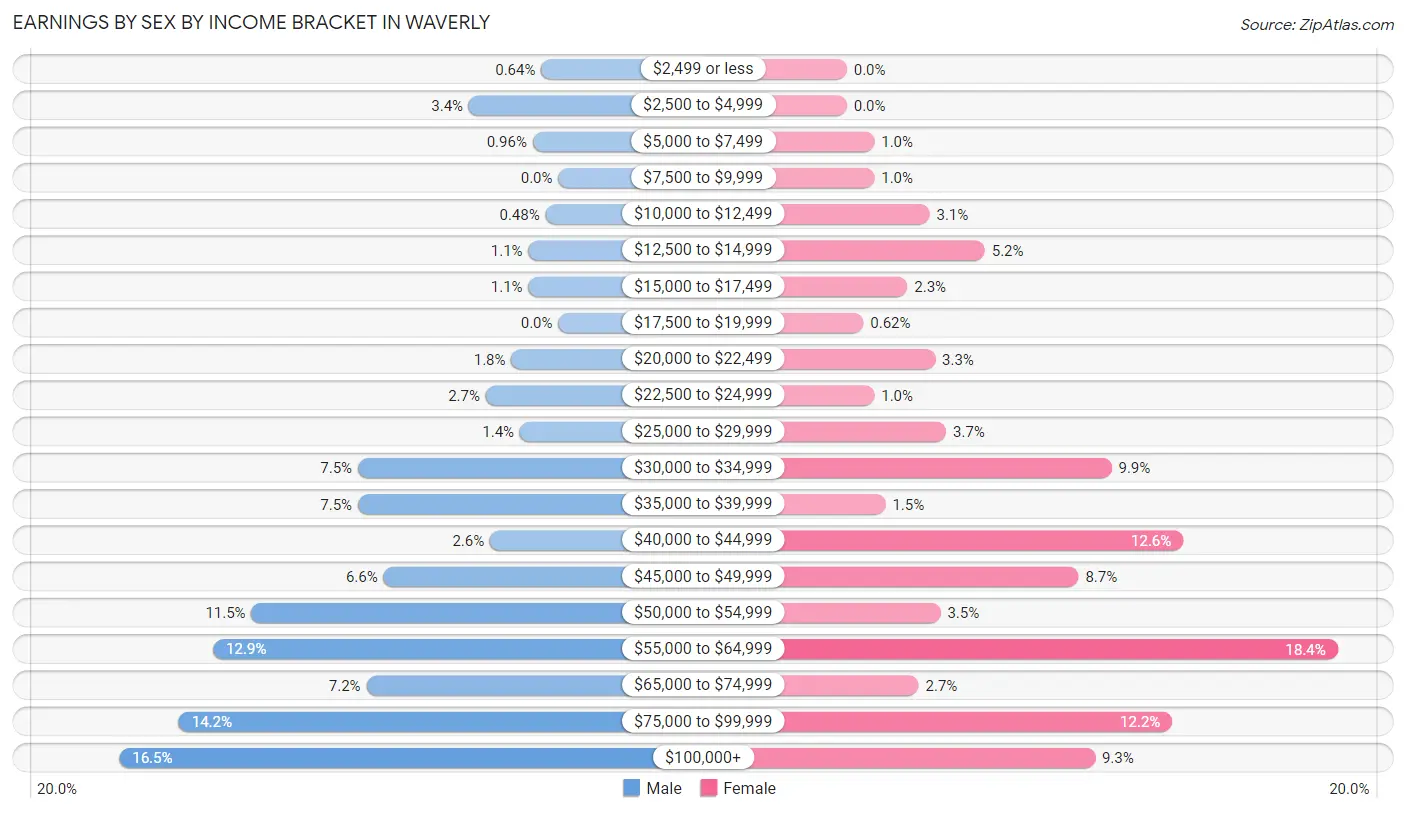
Earnings by Sex by Income Bracket in Waverly
The most common earnings brackets in Waverly are $100,000+ for men (103 | 16.5%) and $55,000 to $64,999 for women (89 | 18.4%).
| Income | Male | Female |
| $2,499 or less | 4 (0.6%) | 0 (0.0%) |
| $2,500 to $4,999 | 21 (3.4%) | 0 (0.0%) |
| $5,000 to $7,499 | 6 (1.0%) | 5 (1.0%) |
| $7,500 to $9,999 | 0 (0.0%) | 5 (1.0%) |
| $10,000 to $12,499 | 3 (0.5%) | 15 (3.1%) |
| $12,500 to $14,999 | 7 (1.1%) | 25 (5.2%) |
| $15,000 to $17,499 | 7 (1.1%) | 11 (2.3%) |
| $17,500 to $19,999 | 0 (0.0%) | 3 (0.6%) |
| $20,000 to $22,499 | 11 (1.8%) | 16 (3.3%) |
| $22,500 to $24,999 | 17 (2.7%) | 5 (1.0%) |
| $25,000 to $29,999 | 9 (1.4%) | 18 (3.7%) |
| $30,000 to $34,999 | 47 (7.5%) | 48 (9.9%) |
| $35,000 to $39,999 | 47 (7.5%) | 7 (1.5%) |
| $40,000 to $44,999 | 16 (2.6%) | 61 (12.6%) |
| $45,000 to $49,999 | 41 (6.6%) | 42 (8.7%) |
| $50,000 to $54,999 | 72 (11.5%) | 17 (3.5%) |
| $55,000 to $64,999 | 81 (12.9%) | 89 (18.4%) |
| $65,000 to $74,999 | 45 (7.2%) | 13 (2.7%) |
| $75,000 to $99,999 | 89 (14.2%) | 59 (12.2%) |
| $100,000+ | 103 (16.5%) | 45 (9.3%) |
| Total | 626 (100.0%) | 484 (100.0%) |
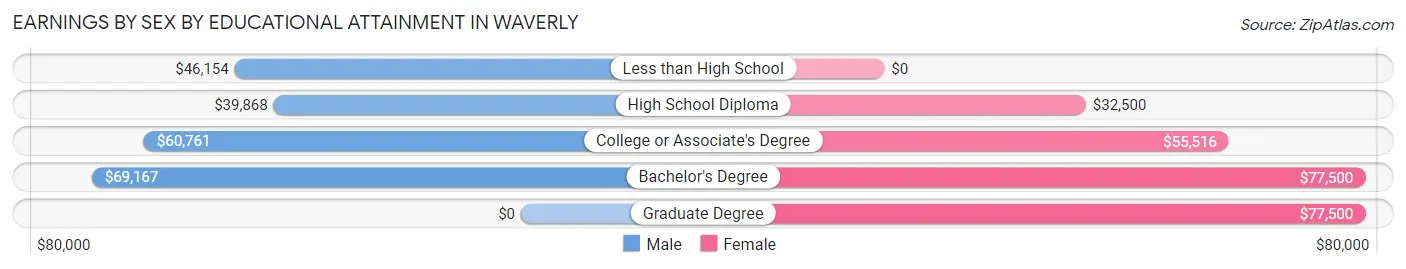
Earnings by Sex by Educational Attainment in Waverly
Average earnings in Waverly are $58,177 for men and $49,063 for women, a difference of 15.7%. Men with an educational attainment of bachelor's degree enjoy the highest average annual earnings of $69,167, while those with high school diploma education earn the least with $39,868. Women with an educational attainment of bachelor's degree earn the most with the average annual earnings of $77,500, while those with high school diploma education have the smallest earnings of $32,500.
| Educational Attainment | Male Income | Female Income |
| Less than High School | $46,154 | $0 |
| High School Diploma | $39,868 | $32,500 |
| College or Associate's Degree | $60,761 | $55,516 |
| Bachelor's Degree | $69,167 | $77,500 |
| Graduate Degree | - | - |
| Total | $58,177 | $49,063 |
Family Income in Waverly
Family Income Brackets in Waverly
According to the Waverly family income data, there are 216 families falling into the $100,000 to $149,999 income range, which is the most common income bracket and makes up 42.2% of all families. Conversely, the $15,000 to $24,999 income bracket is the least frequent group with only 3 families (0.6%) belonging to this category.
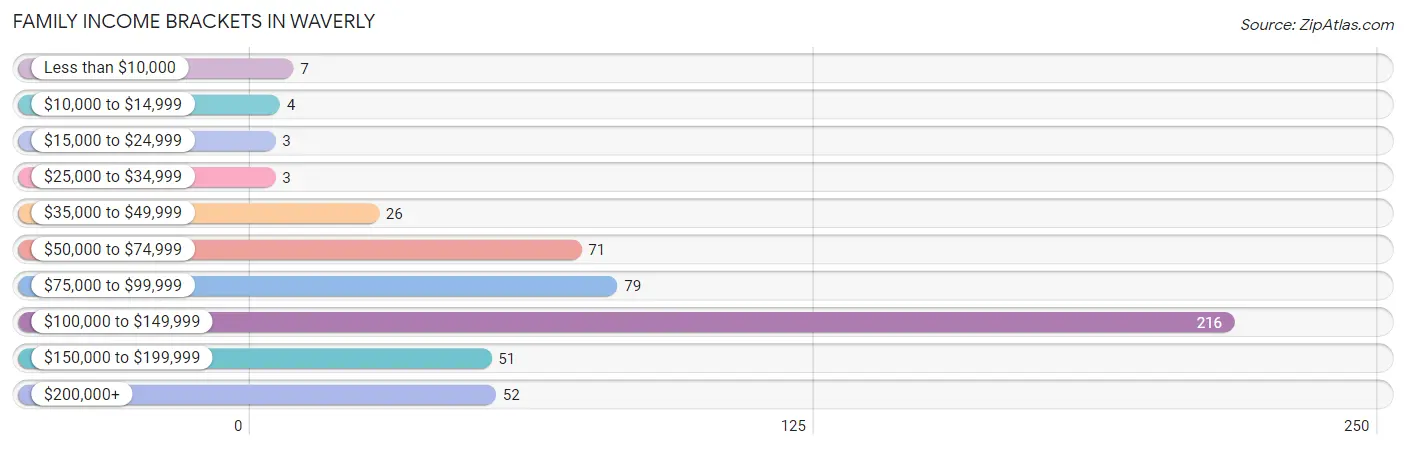
| Income Bracket | # Families | % Families |
| Less than $10,000 | 7 | 1.4% |
| $10,000 to $14,999 | 4 | 0.8% |
| $15,000 to $24,999 | 3 | 0.6% |
| $25,000 to $34,999 | 3 | 0.6% |
| $35,000 to $49,999 | 26 | 5.1% |
| $50,000 to $74,999 | 71 | 13.9% |
| $75,000 to $99,999 | 79 | 15.4% |
| $100,000 to $149,999 | 216 | 42.2% |
| $150,000 to $199,999 | 51 | 10.0% |
| $200,000+ | 52 | 10.2% |
Family Income by Famaliy Size in Waverly
5-person families (29 | 5.7%) account for the highest median family income in Waverly with $152,813 per family, while 2-person families (228 | 44.5%) have the highest median income of $42,322 per family member.
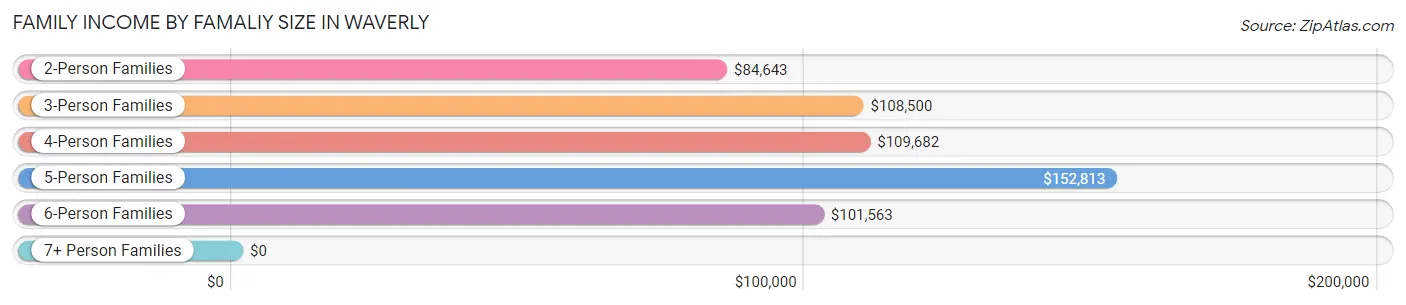
| Income Bracket | # Families | Median Income |
| 2-Person Families | 228 (44.5%) | $84,643 |
| 3-Person Families | 90 (17.6%) | $108,500 |
| 4-Person Families | 150 (29.3%) | $109,682 |
| 5-Person Families | 29 (5.7%) | $152,813 |
| 6-Person Families | 15 (2.9%) | $101,563 |
| 7+ Person Families | 0 (0.0%) | $0 |
| Total | 512 (100.0%) | $108,615 |
Family Income by Number of Earners in Waverly
The median family income in Waverly is $108,615, with families comprising 3+ earners (51) having the highest median family income of $137,083, while families with no earners (44) have the lowest median family income of $58,333, accounting for 10.0% and 8.6% of families, respectively.
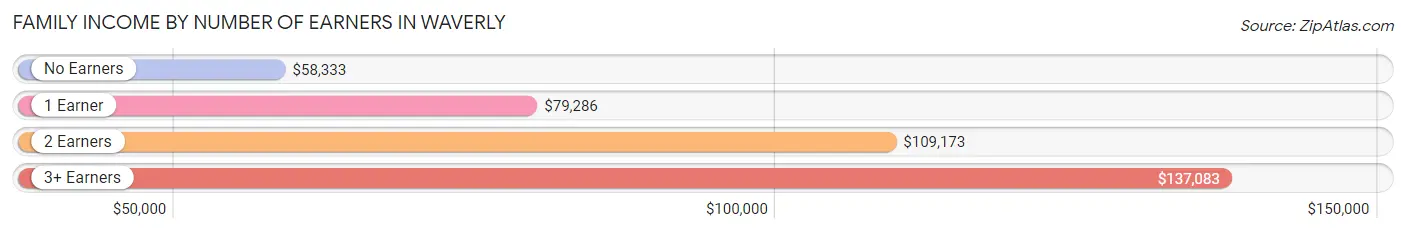
| Number of Earners | # Families | Median Income |
| No Earners | 44 (8.6%) | $58,333 |
| 1 Earner | 98 (19.1%) | $79,286 |
| 2 Earners | 319 (62.3%) | $109,173 |
| 3+ Earners | 51 (10.0%) | $137,083 |
| Total | 512 (100.0%) | $108,615 |
Household Income in Waverly
Household Income Brackets in Waverly
With 257 households falling in the category, the $100,000 to $149,999 income range is the most frequent in Waverly, accounting for 39.5% of all households.
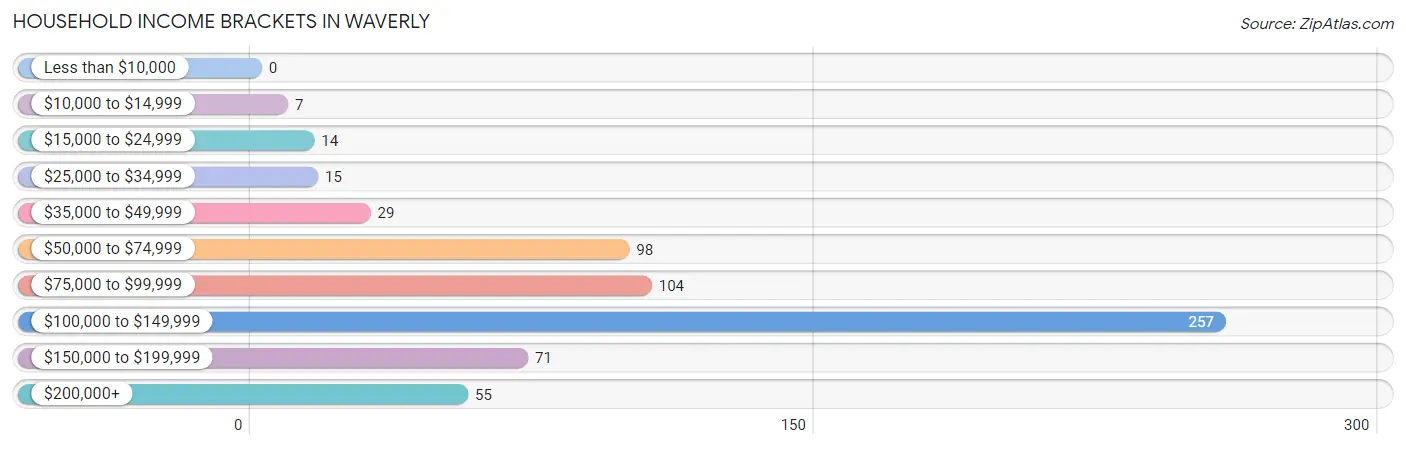
| Income Bracket | # Households | % Households |
| Less than $10,000 | 0 | 0.0% |
| $10,000 to $14,999 | 7 | 1.1% |
| $15,000 to $24,999 | 14 | 2.2% |
| $25,000 to $34,999 | 15 | 2.3% |
| $35,000 to $49,999 | 29 | 4.5% |
| $50,000 to $74,999 | 98 | 15.1% |
| $75,000 to $99,999 | 104 | 16.0% |
| $100,000 to $149,999 | 257 | 39.5% |
| $150,000 to $199,999 | 71 | 10.9% |
| $200,000+ | 55 | 8.5% |
Household Income by Householder Age in Waverly
The median household income in Waverly is $108,731, with the highest median household income of $113,177 found in the 45 to 64 years age bracket for the primary householder. A total of 249 households (38.3%) fall into this category.
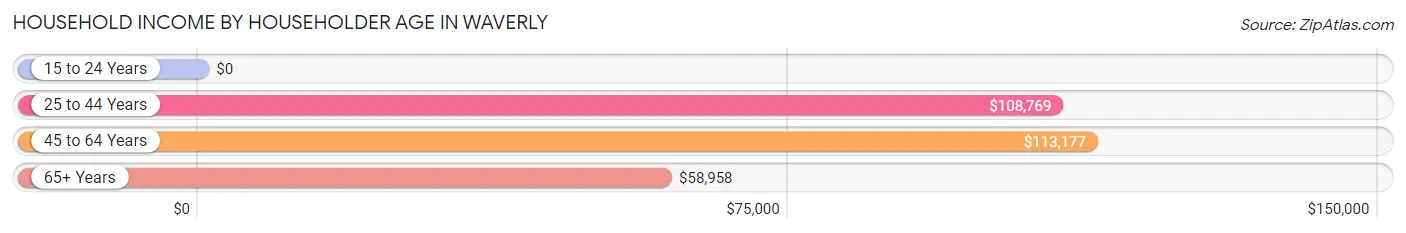
| Income Bracket | # Households | Median Income |
| 15 to 24 Years | 0 (0.0%) | $0 |
| 25 to 44 Years | 336 (51.7%) | $108,769 |
| 45 to 64 Years | 249 (38.3%) | $113,177 |
| 65+ Years | 65 (10.0%) | $58,958 |
| Total | 650 (100.0%) | $108,731 |
Poverty in Waverly
Income Below Poverty by Sex and Age in Waverly
With 10.1% poverty level for males and 3.5% for females among the residents of Waverly, 18 to 24 year old males and 5 year old females are the most vulnerable to poverty, with 6 males (18.2%) and 8 females (57.1%) in their respective age groups living below the poverty level.
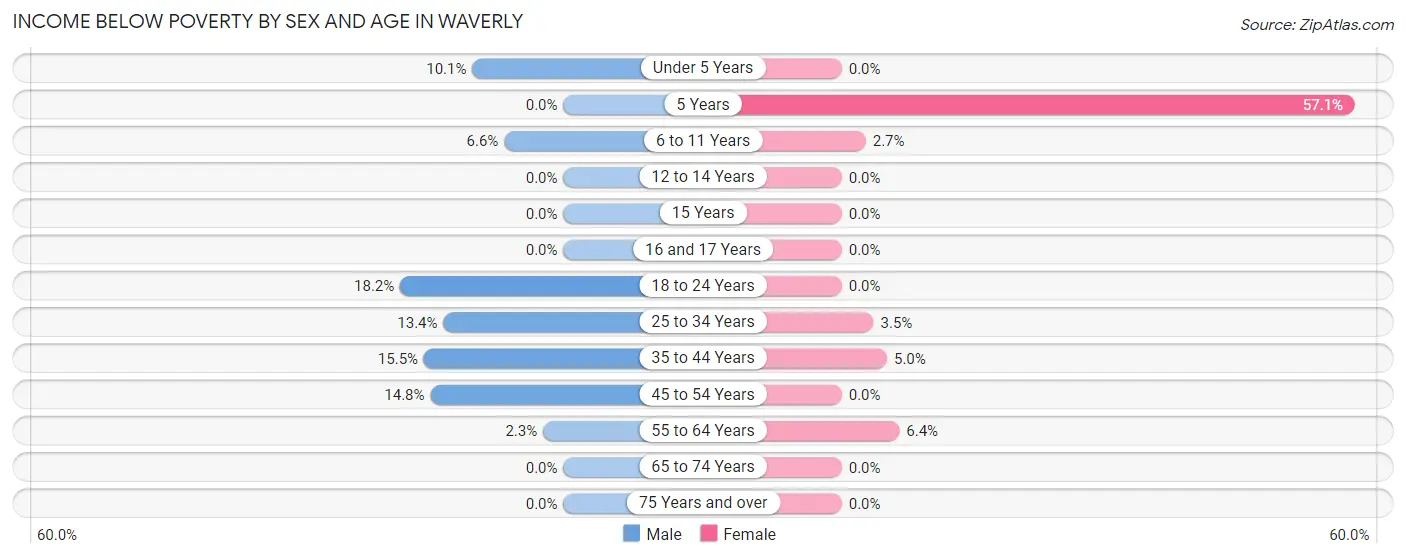
| Age Bracket | Male | Female |
| Under 5 Years | 7 (10.1%) | 0 (0.0%) |
| 5 Years | 0 (0.0%) | 8 (57.1%) |
| 6 to 11 Years | 6 (6.6%) | 2 (2.7%) |
| 12 to 14 Years | 0 (0.0%) | 0 (0.0%) |
| 15 Years | 0 (0.0%) | 0 (0.0%) |
| 16 and 17 Years | 0 (0.0%) | 0 (0.0%) |
| 18 to 24 Years | 6 (18.2%) | 0 (0.0%) |
| 25 to 34 Years | 29 (13.4%) | 7 (3.5%) |
| 35 to 44 Years | 25 (15.5%) | 6 (5.0%) |
| 45 to 54 Years | 24 (14.8%) | 0 (0.0%) |
| 55 to 64 Years | 3 (2.3%) | 5 (6.4%) |
| 65 to 74 Years | 0 (0.0%) | 0 (0.0%) |
| 75 Years and over | 0 (0.0%) | 0 (0.0%) |
| Total | 100 (10.1%) | 28 (3.5%) |
Income Above Poverty by Sex and Age in Waverly
According to the poverty statistics in Waverly, males aged 5 years and females aged under 5 years are the age groups that are most secure financially, with 100.0% of males and 100.0% of females in these age groups living above the poverty line.
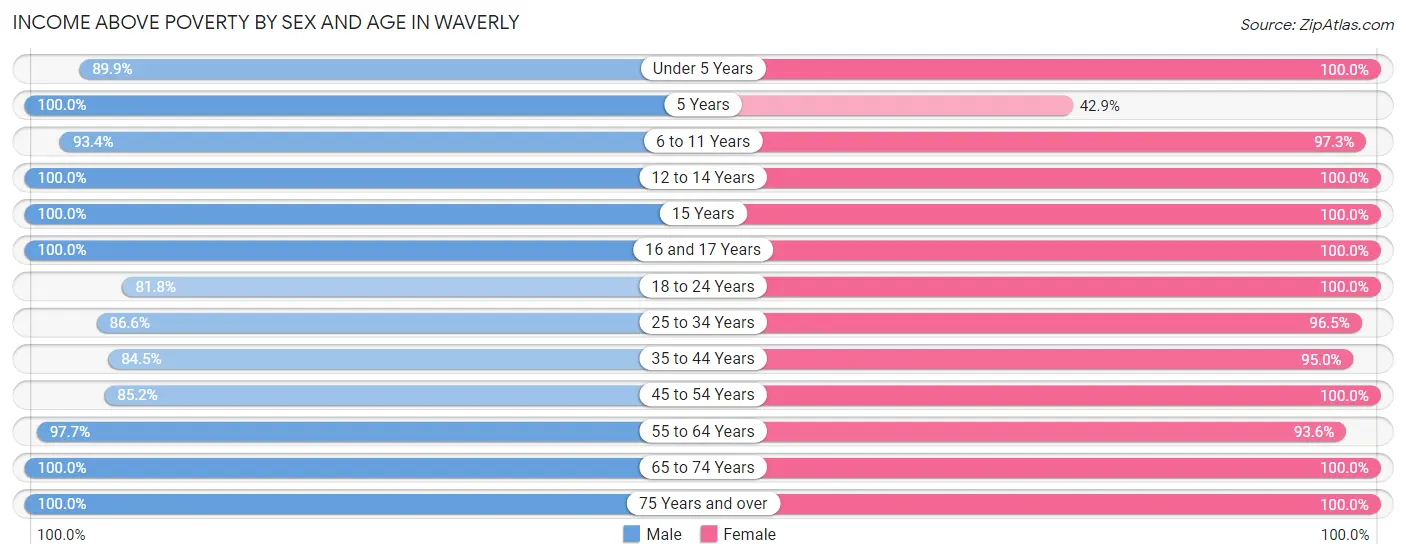
| Age Bracket | Male | Female |
| Under 5 Years | 62 (89.9%) | 58 (100.0%) |
| 5 Years | 17 (100.0%) | 6 (42.9%) |
| 6 to 11 Years | 85 (93.4%) | 73 (97.3%) |
| 12 to 14 Years | 29 (100.0%) | 14 (100.0%) |
| 15 Years | 9 (100.0%) | 18 (100.0%) |
| 16 and 17 Years | 17 (100.0%) | 1 (100.0%) |
| 18 to 24 Years | 27 (81.8%) | 42 (100.0%) |
| 25 to 34 Years | 188 (86.6%) | 191 (96.5%) |
| 35 to 44 Years | 136 (84.5%) | 113 (95.0%) |
| 45 to 54 Years | 138 (85.2%) | 131 (100.0%) |
| 55 to 64 Years | 130 (97.7%) | 73 (93.6%) |
| 65 to 74 Years | 28 (100.0%) | 35 (100.0%) |
| 75 Years and over | 23 (100.0%) | 17 (100.0%) |
| Total | 889 (89.9%) | 772 (96.5%) |
Income Below Poverty Among Married-Couple Families in Waverly
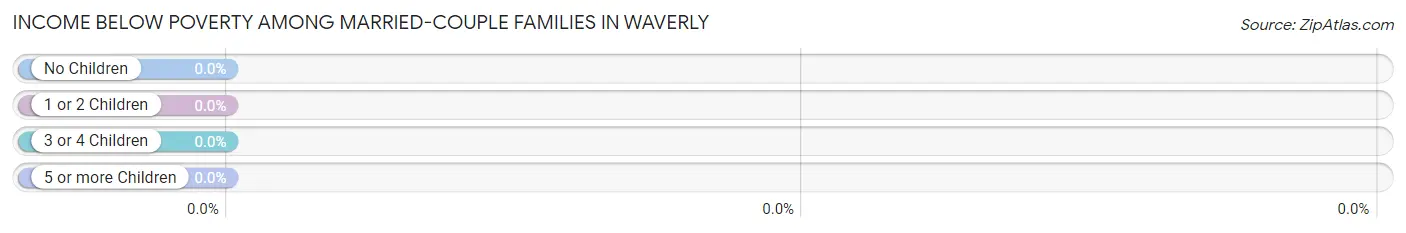
| Children | Above Poverty | Below Poverty |
| No Children | 217 (100.0%) | 0 (0.0%) |
| 1 or 2 Children | 216 (100.0%) | 0 (0.0%) |
| 3 or 4 Children | 23 (100.0%) | 0 (0.0%) |
| 5 or more Children | 0 (0.0%) | 0 (0.0%) |
| Total | 456 (100.0%) | 0 (0.0%) |
Income Below Poverty Among Single-Parent Households in Waverly
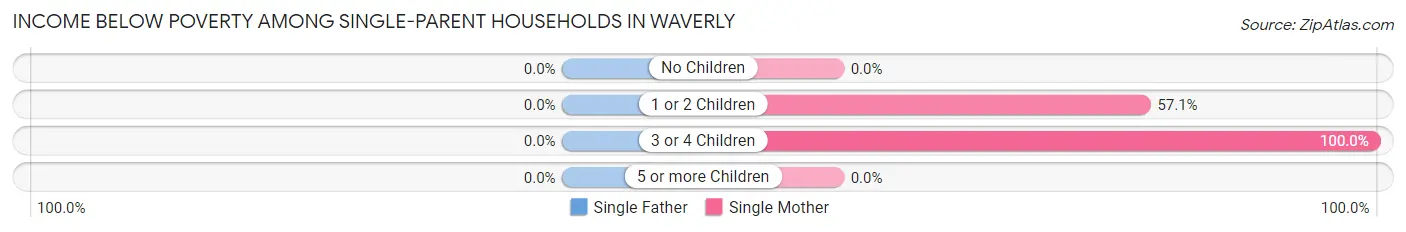
| Children | Single Father | Single Mother |
| No Children | 0 (0.0%) | 0 (0.0%) |
| 1 or 2 Children | 0 (0.0%) | 8 (57.1%) |
| 3 or 4 Children | 0 (0.0%) | 3 (100.0%) |
| 5 or more Children | 0 (0.0%) | 0 (0.0%) |
| Total | 0 (0.0%) | 11 (40.7%) |
Income Below Poverty Among Married-Couple vs Single-Parent Households in Waverly
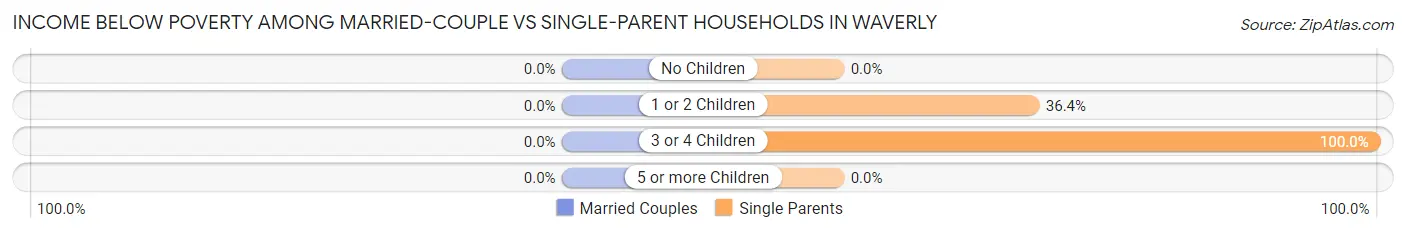
| Children | Married-Couple Families | Single-Parent Households |
| No Children | 0 (0.0%) | 0 (0.0%) |
| 1 or 2 Children | 0 (0.0%) | 8 (36.4%) |
| 3 or 4 Children | 0 (0.0%) | 3 (100.0%) |
| 5 or more Children | 0 (0.0%) | 0 (0.0%) |
| Total | 0 (0.0%) | 11 (19.6%) |
Race in Waverly
The most populous races in Waverly are White / Caucasian (1,619 | 89.8%), Two or more Races (91 | 5.1%), and Hispanic or Latino (79 | 4.4%).
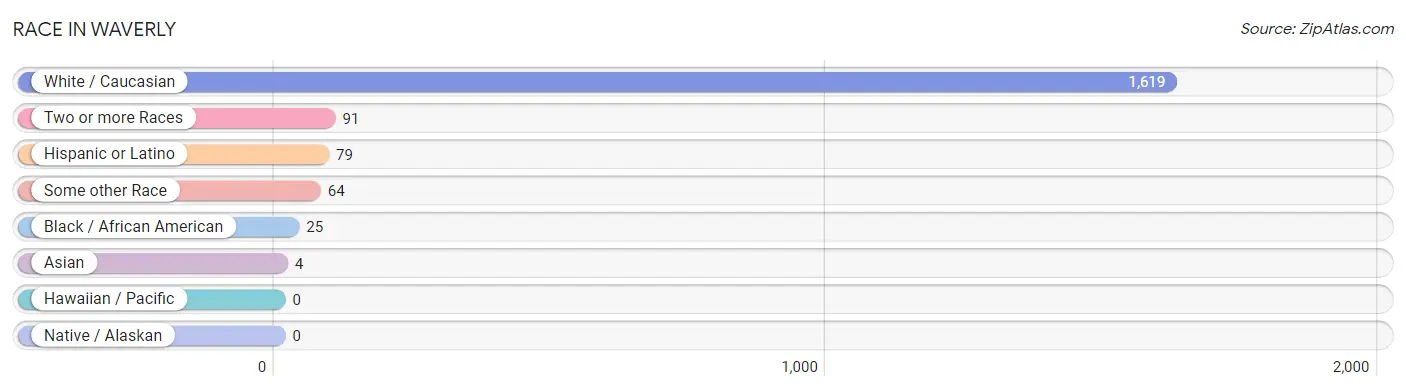
| Race | # Population | % Population |
| Asian | 4 | 0.2% |
| Black / African American | 25 | 1.4% |
| Hawaiian / Pacific | 0 | 0.0% |
| Hispanic or Latino | 79 | 4.4% |
| Native / Alaskan | 0 | 0.0% |
| White / Caucasian | 1,619 | 89.8% |
| Two or more Races | 91 | 5.1% |
| Some other Race | 64 | 3.5% |
| Total | 1,803 | 100.0% |
Ancestry in Waverly
The most populous ancestries reported in Waverly are German (582 | 32.3%), Polish (252 | 14.0%), Irish (174 | 9.7%), Norwegian (162 | 9.0%), and Swedish (147 | 8.2%), together accounting for 73.1% of all Waverly residents.
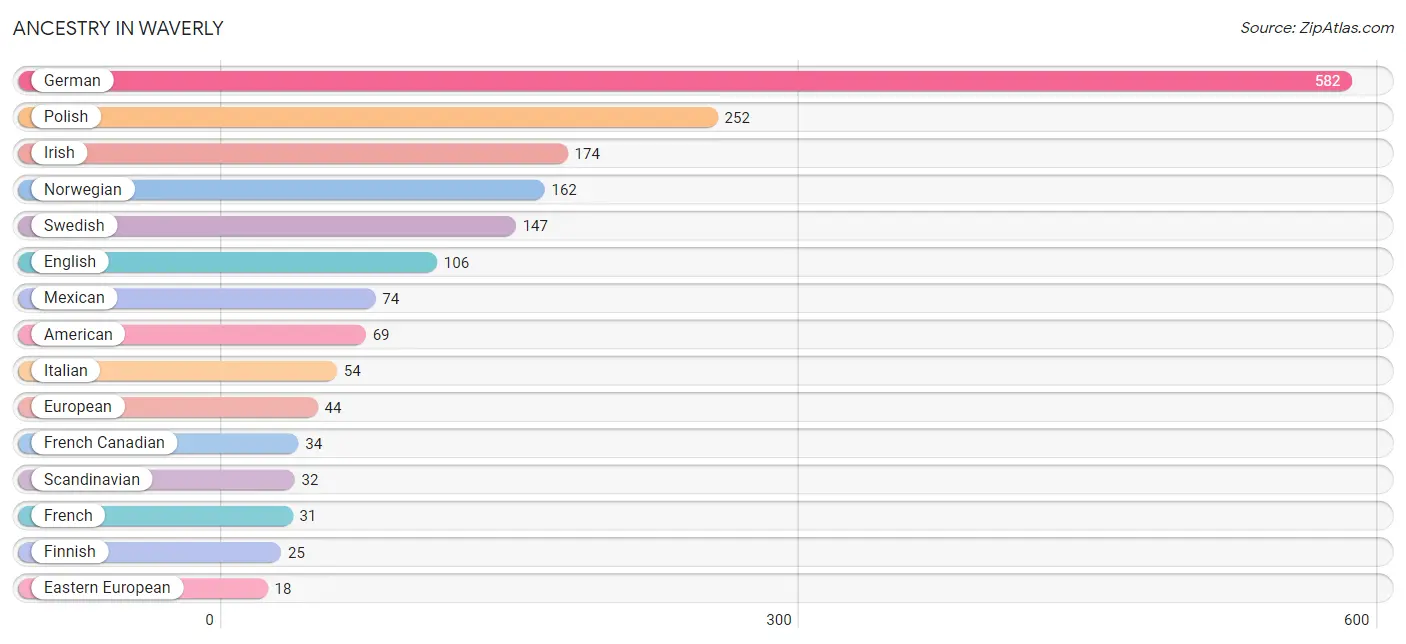
| Ancestry | # Population | % Population |
| African | 4 | 0.2% |
| American | 69 | 3.8% |
| Austrian | 4 | 0.2% |
| Brazilian | 2 | 0.1% |
| British | 13 | 0.7% |
| Burmese | 2 | 0.1% |
| Cherokee | 11 | 0.6% |
| Chippewa | 4 | 0.2% |
| Czech | 16 | 0.9% |
| Czechoslovakian | 2 | 0.1% |
| Danish | 5 | 0.3% |
| Dutch | 6 | 0.3% |
| Eastern European | 18 | 1.0% |
| English | 106 | 5.9% |
| European | 44 | 2.4% |
| Finnish | 25 | 1.4% |
| French | 31 | 1.7% |
| French Canadian | 34 | 1.9% |
| German | 582 | 32.3% |
| Indian (Asian) | 6 | 0.3% |
| Irish | 174 | 9.7% |
| Italian | 54 | 3.0% |
| Mexican | 74 | 4.1% |
| Norwegian | 162 | 9.0% |
| Polish | 252 | 14.0% |
| Scandinavian | 32 | 1.8% |
| Scotch-Irish | 12 | 0.7% |
| Scottish | 17 | 0.9% |
| Sioux | 6 | 0.3% |
| Slovene | 2 | 0.1% |
| Subsaharan African | 4 | 0.2% |
| Swedish | 147 | 8.2% |
| Ukrainian | 8 | 0.4% |
| Yugoslavian | 17 | 0.9% | View All 34 Rows |
Immigrants in Waverly
The most numerous immigrant groups reported in Waverly came from Central America (55 | 3.0%), Latin America (55 | 3.0%), Mexico (55 | 3.0%), Eastern Europe (12 | 0.7%), and Europe (12 | 0.7%), together accounting for 10.5% of all Waverly residents.
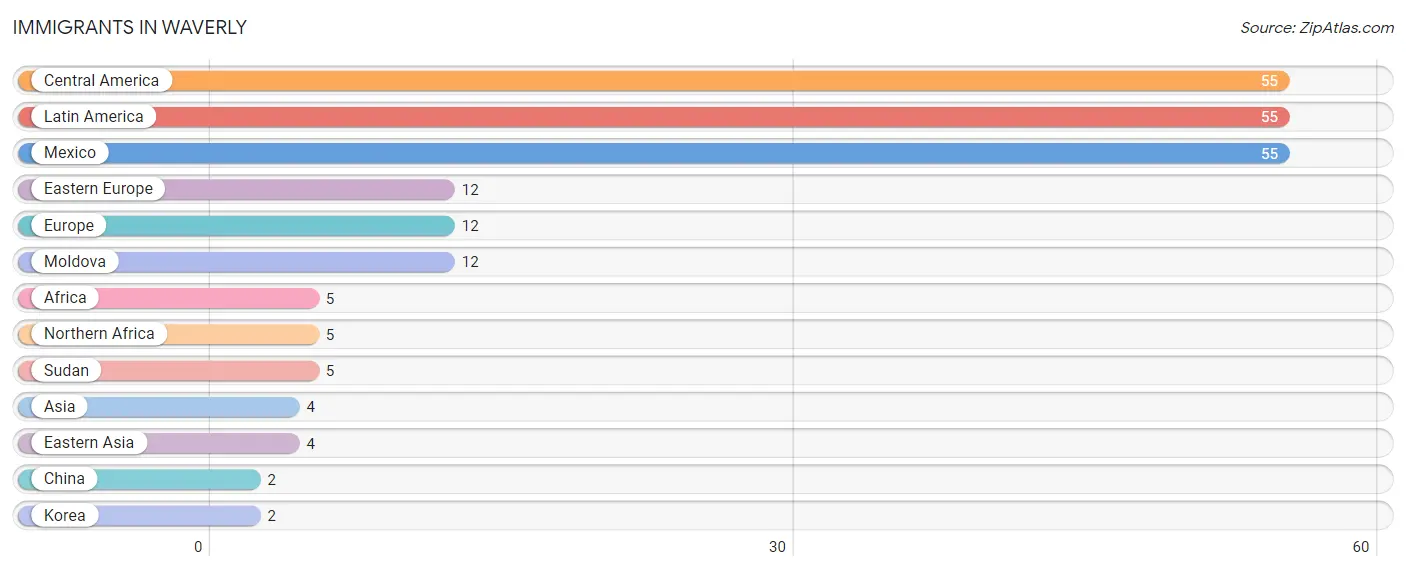
| Immigration Origin | # Population | % Population |
| Africa | 5 | 0.3% |
| Asia | 4 | 0.2% |
| Central America | 55 | 3.0% |
| China | 2 | 0.1% |
| Eastern Asia | 4 | 0.2% |
| Eastern Europe | 12 | 0.7% |
| Europe | 12 | 0.7% |
| Korea | 2 | 0.1% |
| Latin America | 55 | 3.0% |
| Mexico | 55 | 3.0% |
| Moldova | 12 | 0.7% |
| Northern Africa | 5 | 0.3% |
| Sudan | 5 | 0.3% | View All 13 Rows |
Sex and Age in Waverly
Sex and Age in Waverly
The most populous age groups in Waverly are 25 to 29 Years (158 | 15.8%) for men and 25 to 29 Years (159 | 19.9%) for women.
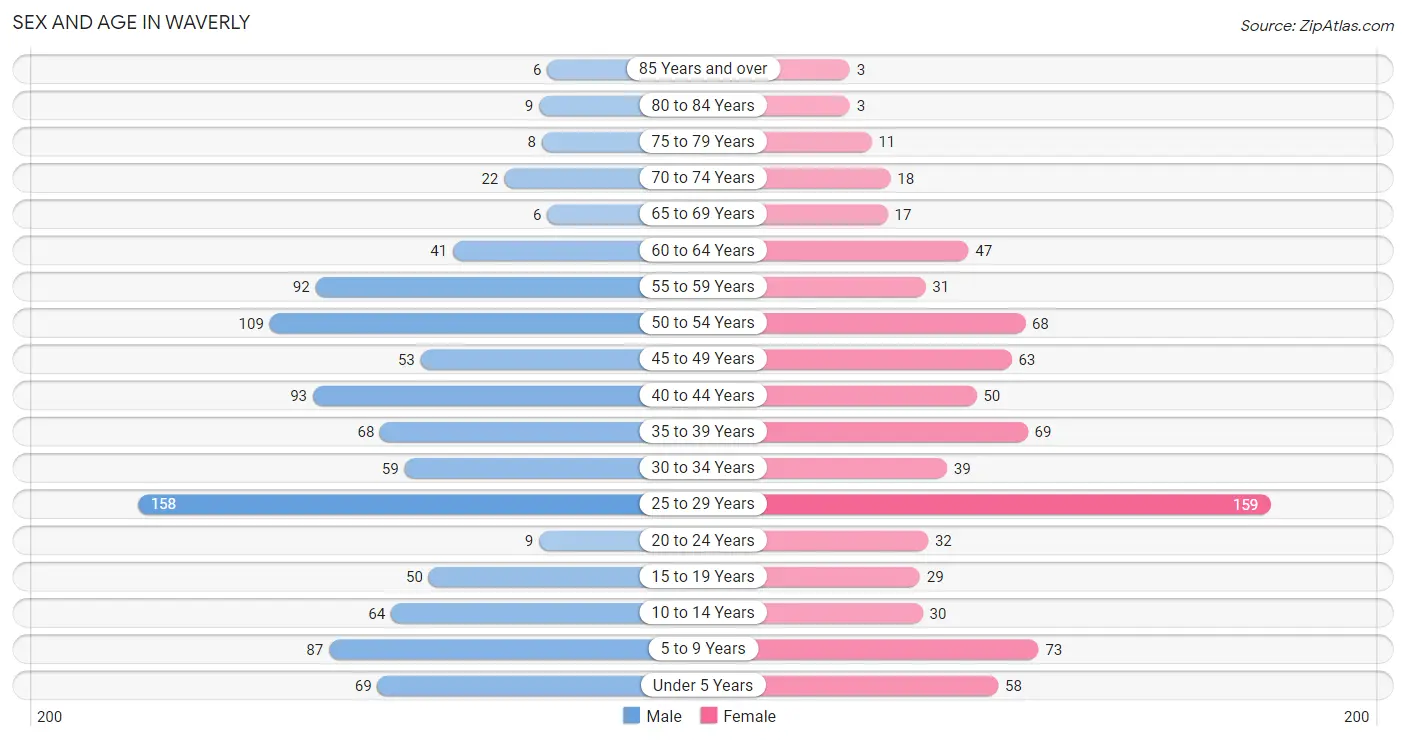
| Age Bracket | Male | Female |
| Under 5 Years | 69 (6.9%) | 58 (7.2%) |
| 5 to 9 Years | 87 (8.7%) | 73 (9.1%) |
| 10 to 14 Years | 64 (6.4%) | 30 (3.7%) |
| 15 to 19 Years | 50 (5.0%) | 29 (3.6%) |
| 20 to 24 Years | 9 (0.9%) | 32 (4.0%) |
| 25 to 29 Years | 158 (15.8%) | 159 (19.9%) |
| 30 to 34 Years | 59 (5.9%) | 39 (4.9%) |
| 35 to 39 Years | 68 (6.8%) | 69 (8.6%) |
| 40 to 44 Years | 93 (9.3%) | 50 (6.2%) |
| 45 to 49 Years | 53 (5.3%) | 63 (7.9%) |
| 50 to 54 Years | 109 (10.9%) | 68 (8.5%) |
| 55 to 59 Years | 92 (9.2%) | 31 (3.9%) |
| 60 to 64 Years | 41 (4.1%) | 47 (5.9%) |
| 65 to 69 Years | 6 (0.6%) | 17 (2.1%) |
| 70 to 74 Years | 22 (2.2%) | 18 (2.2%) |
| 75 to 79 Years | 8 (0.8%) | 11 (1.4%) |
| 80 to 84 Years | 9 (0.9%) | 3 (0.4%) |
| 85 Years and over | 6 (0.6%) | 3 (0.4%) |
| Total | 1,003 (100.0%) | 800 (100.0%) |
Families and Households in Waverly
Median Family Size in Waverly
The median family size in Waverly is 2.89 persons per family, with married-couple families (456 | 89.1%) accounting for the largest median family size of 2.93 persons per family. On the other hand, single male/father families (29 | 5.7%) represent the smallest median family size with 2.41 persons per family.
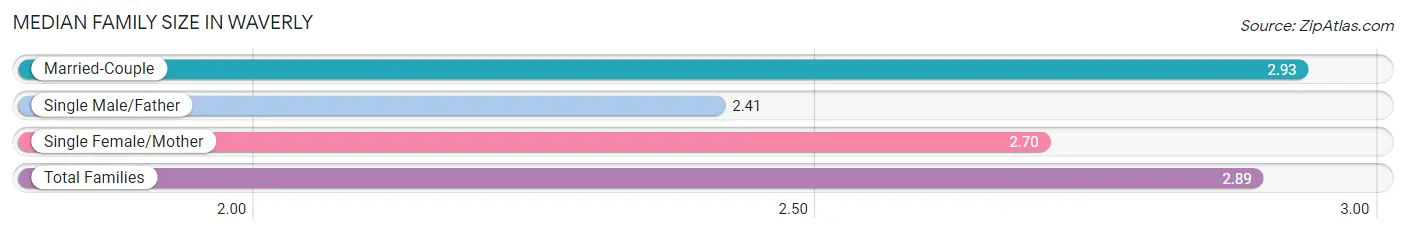
| Family Type | # Families | Family Size |
| Married-Couple | 456 (89.1%) | 2.93 |
| Single Male/Father | 29 (5.7%) | 2.41 |
| Single Female/Mother | 27 (5.3%) | 2.70 |
| Total Families | 512 (100.0%) | 2.89 |
Median Household Size in Waverly
The median household size in Waverly is 2.67 persons per household, with single female/mother households (27 | 4.2%) accounting for the largest median household size of 3.48 persons per household. non-family households (138 | 21.2%) represent the smallest median household size with 1.47 persons per household.
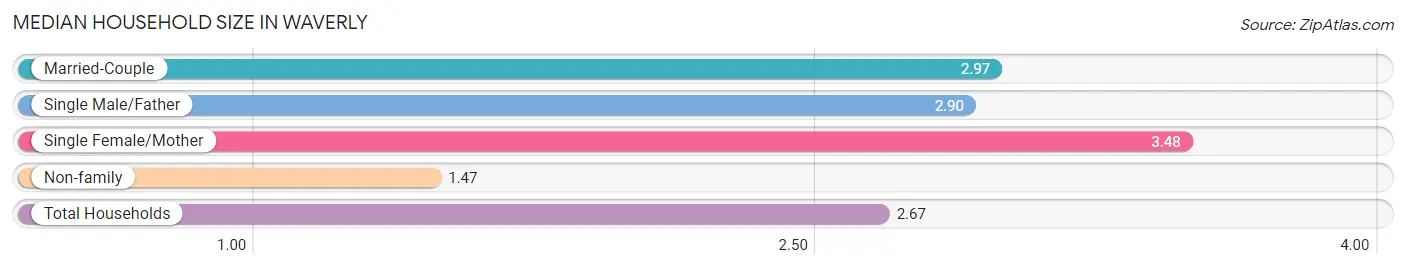
| Household Type | # Households | Household Size |
| Married-Couple | 456 (70.2%) | 2.97 |
| Single Male/Father | 29 (4.5%) | 2.90 |
| Single Female/Mother | 27 (4.2%) | 3.48 |
| Non-family | 138 (21.2%) | 1.47 |
| Total Households | 650 (100.0%) | 2.67 |
Household Size by Marriage Status in Waverly
Out of a total of 650 households in Waverly, 512 (78.8%) are family households, while 138 (21.2%) are nonfamily households. The most numerous type of family households are 2-person households, comprising 202, and the most common type of nonfamily households are 1-person households, comprising 82.
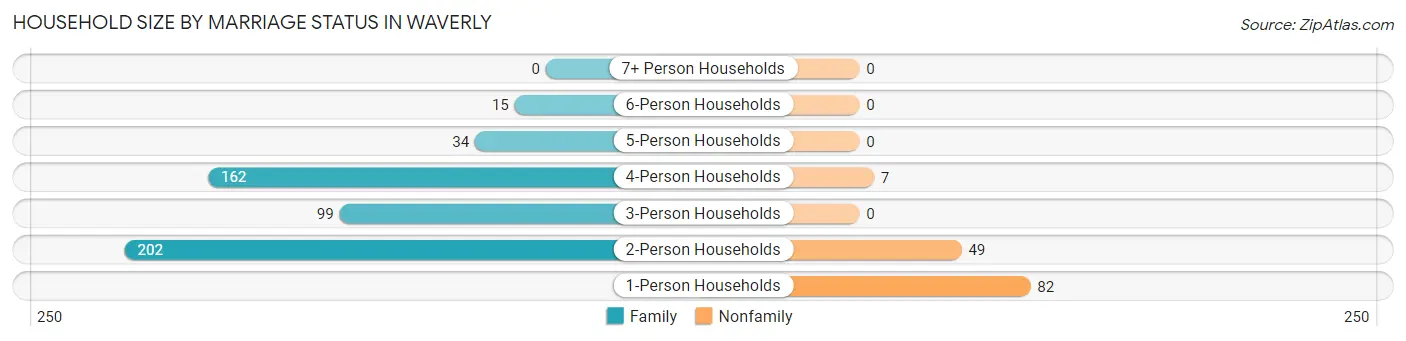
| Household Size | Family Households | Nonfamily Households |
| 1-Person Households | - | 82 (12.6%) |
| 2-Person Households | 202 (31.1%) | 49 (7.5%) |
| 3-Person Households | 99 (15.2%) | 0 (0.0%) |
| 4-Person Households | 162 (24.9%) | 7 (1.1%) |
| 5-Person Households | 34 (5.2%) | 0 (0.0%) |
| 6-Person Households | 15 (2.3%) | 0 (0.0%) |
| 7+ Person Households | 0 (0.0%) | 0 (0.0%) |
| Total | 512 (78.8%) | 138 (21.2%) |
Female Fertility in Waverly
Fertility by Age in Waverly
Average fertility rate in Waverly is 47.0 births per 1,000 women. Women in the age bracket of 20 to 34 years have the highest fertility rate with 91.0 births per 1,000 women. Women in the age bracket of 20 to 34 years acount for 100.0% of all women with births.
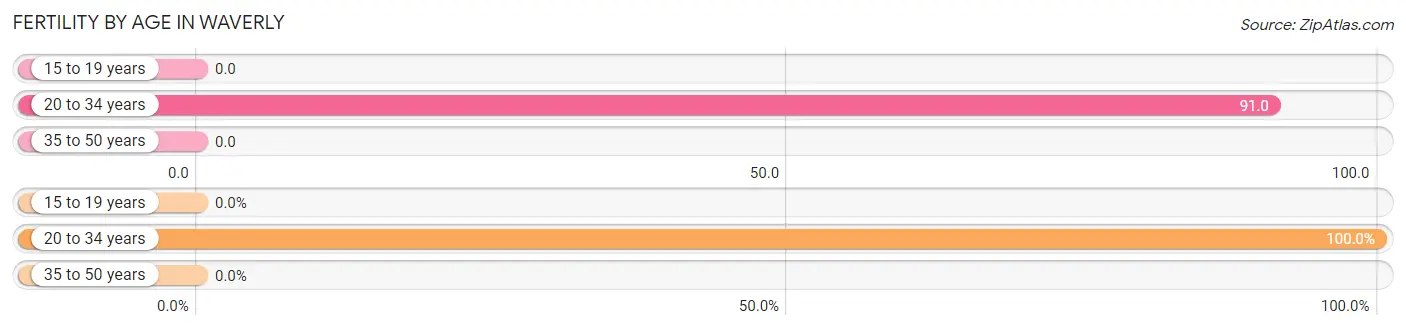
| Age Bracket | Women with Births | Births / 1,000 Women |
| 15 to 19 years | 0 (0.0%) | 0.0 |
| 20 to 34 years | 21 (100.0%) | 91.0 |
| 35 to 50 years | 0 (0.0%) | 0.0 |
| Total | 21 (100.0%) | 47.0 |
Fertility by Age by Marriage Status in Waverly
76.2% of women with births (21) in Waverly are married. The highest percentage of unmarried women with births falls into 20 to 34 years age bracket with 23.8% of them unmarried at the time of birth, while the lowest percentage of unmarried women with births belong to 20 to 34 years age bracket with 23.8% of them unmarried.
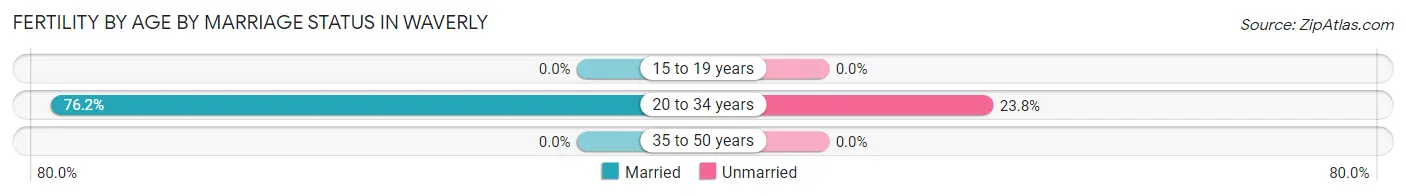
| Age Bracket | Married | Unmarried |
| 15 to 19 years | 0 (0.0%) | 0 (0.0%) |
| 20 to 34 years | 16 (76.2%) | 5 (23.8%) |
| 35 to 50 years | 0 (0.0%) | 0 (0.0%) |
| Total | 16 (76.2%) | 5 (23.8%) |
Fertility by Education in Waverly
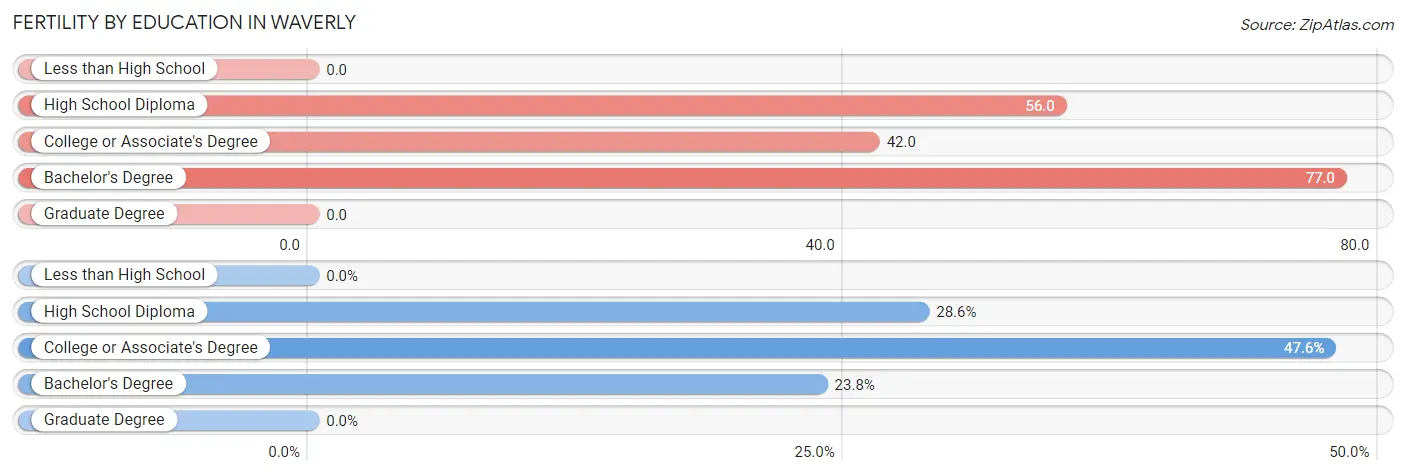
| Educational Attainment | Women with Births | Births / 1,000 Women |
| Less than High School | 0 (0.0%) | 0.0 |
| High School Diploma | 6 (28.6%) | 56.0 |
| College or Associate's Degree | 10 (47.6%) | 42.0 |
| Bachelor's Degree | 5 (23.8%) | 77.0 |
| Graduate Degree | 0 (0.0%) | 0.0 |
| Total | 21 (100.0%) | 47.0 |
Fertility by Education by Marriage Status in Waverly
23.8% of women with births in Waverly are unmarried. Women with the educational attainment of high school diploma are most likely to be married with 100.0% of them married at childbirth, while women with the educational attainment of college or associate's degree are least likely to be married with 50.0% of them unmarried at childbirth.
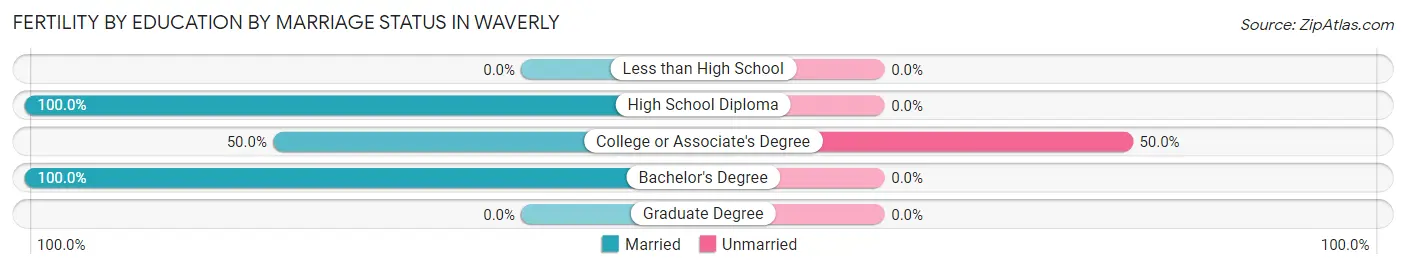
| Educational Attainment | Married | Unmarried |
| Less than High School | 0 (0.0%) | 0 (0.0%) |
| High School Diploma | 6 (100.0%) | 0 (0.0%) |
| College or Associate's Degree | 5 (50.0%) | 5 (50.0%) |
| Bachelor's Degree | 5 (100.0%) | 0 (0.0%) |
| Graduate Degree | 0 (0.0%) | 0 (0.0%) |
| Total | 16 (76.2%) | 5 (23.8%) |
Employment Characteristics in Waverly
Employment by Class of Employer in Waverly
Among the 1,041 employed individuals in Waverly, private company employees (823 | 79.1%), local government employees (79 | 7.6%), and not-for-profit organizations (76 | 7.3%) make up the most common classes of employment.
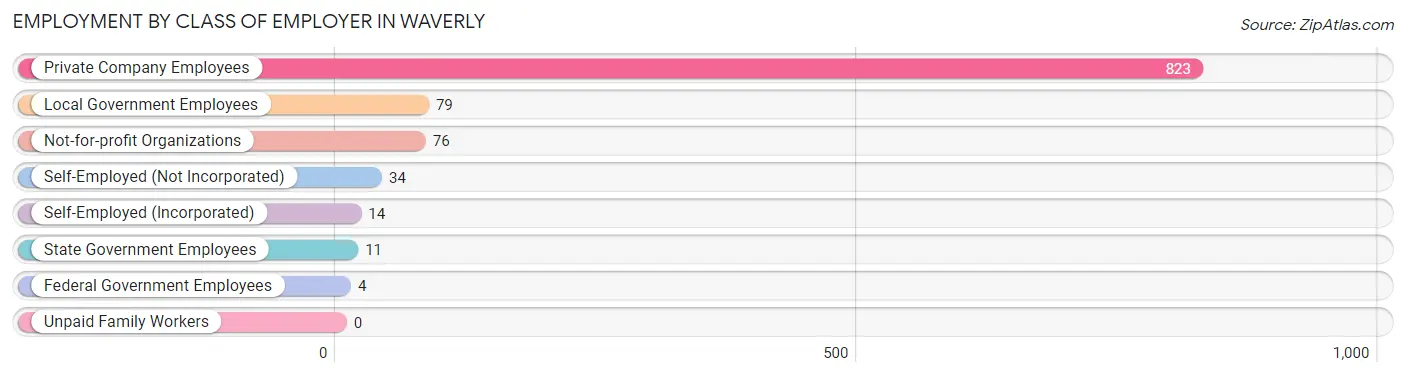
| Employer Class | # Employees | % Employees |
| Private Company Employees | 823 | 79.1% |
| Self-Employed (Incorporated) | 14 | 1.3% |
| Self-Employed (Not Incorporated) | 34 | 3.3% |
| Not-for-profit Organizations | 76 | 7.3% |
| Local Government Employees | 79 | 7.6% |
| State Government Employees | 11 | 1.1% |
| Federal Government Employees | 4 | 0.4% |
| Unpaid Family Workers | 0 | 0.0% |
| Total | 1,041 | 100.0% |
Employment Status by Age in Waverly
According to the labor force statistics for Waverly, out of the total population over 16 years of age (1,395), 75.3% or 1,050 individuals are in the labor force, with 0.4% or 4 of them unemployed. The age group with the highest labor force participation rate is 55 to 59 years, with 92.7% or 114 individuals in the labor force. Within the labor force, the 25 to 29 years age range has the highest percentage of unemployed individuals, with 1.4% or 4 of them being unemployed.
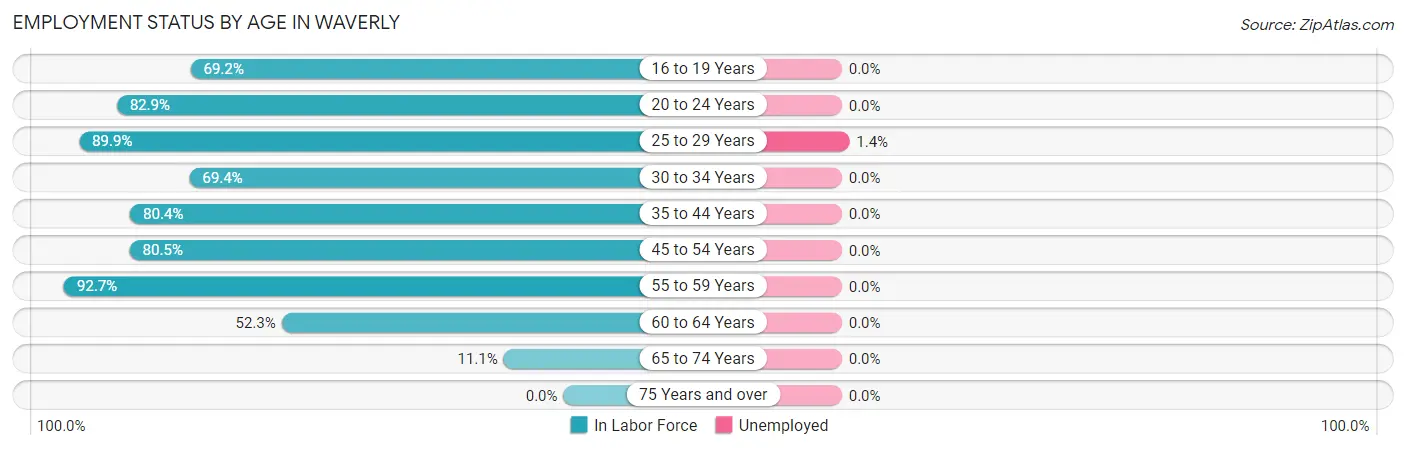
| Age Bracket | In Labor Force | Unemployed |
| 16 to 19 Years | 36 (69.2%) | 0 (0.0%) |
| 20 to 24 Years | 34 (82.9%) | 0 (0.0%) |
| 25 to 29 Years | 285 (89.9%) | 4 (1.4%) |
| 30 to 34 Years | 68 (69.4%) | 0 (0.0%) |
| 35 to 44 Years | 225 (80.4%) | 0 (0.0%) |
| 45 to 54 Years | 236 (80.5%) | 0 (0.0%) |
| 55 to 59 Years | 114 (92.7%) | 0 (0.0%) |
| 60 to 64 Years | 46 (52.3%) | 0 (0.0%) |
| 65 to 74 Years | 7 (11.1%) | 0 (0.0%) |
| 75 Years and over | 0 (0.0%) | 0 (0.0%) |
| Total | 1,050 (75.3%) | 4 (0.4%) |
Employment Status by Educational Attainment in Waverly
According to labor force statistics for Waverly, 81.2% of individuals (974) out of the total population between 25 and 64 years of age (1,199) are in the labor force, with 0.4% or 4 of them being unemployed. The group with the highest labor force participation rate are those with the educational attainment of bachelor's degree or higher, with 92.1% or 221 individuals in the labor force. Within the labor force, individuals with college / associate degree education have the highest percentage of unemployment, with 0.8% or 4 of them being unemployed.
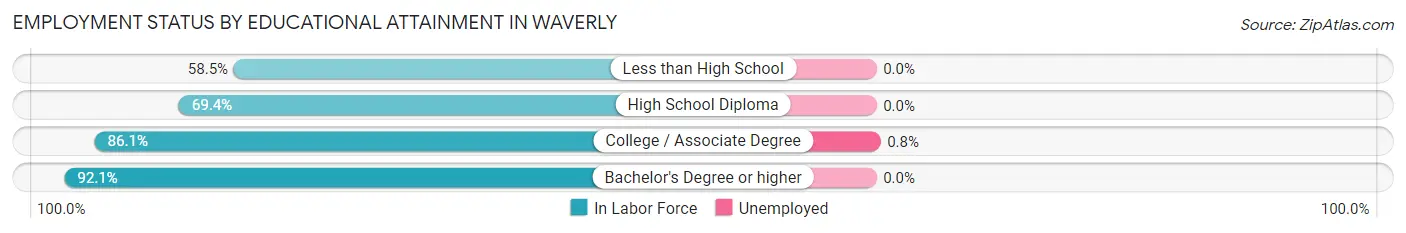
| Educational Attainment | In Labor Force | Unemployed |
| Less than High School | 31 (58.5%) | 0 (0.0%) |
| High School Diploma | 240 (69.4%) | 0 (0.0%) |
| College / Associate Degree | 482 (86.1%) | 4 (0.8%) |
| Bachelor's Degree or higher | 221 (92.1%) | 0 (0.0%) |
| Total | 974 (81.2%) | 5 (0.4%) |
Employment Occupations by Sex in Waverly
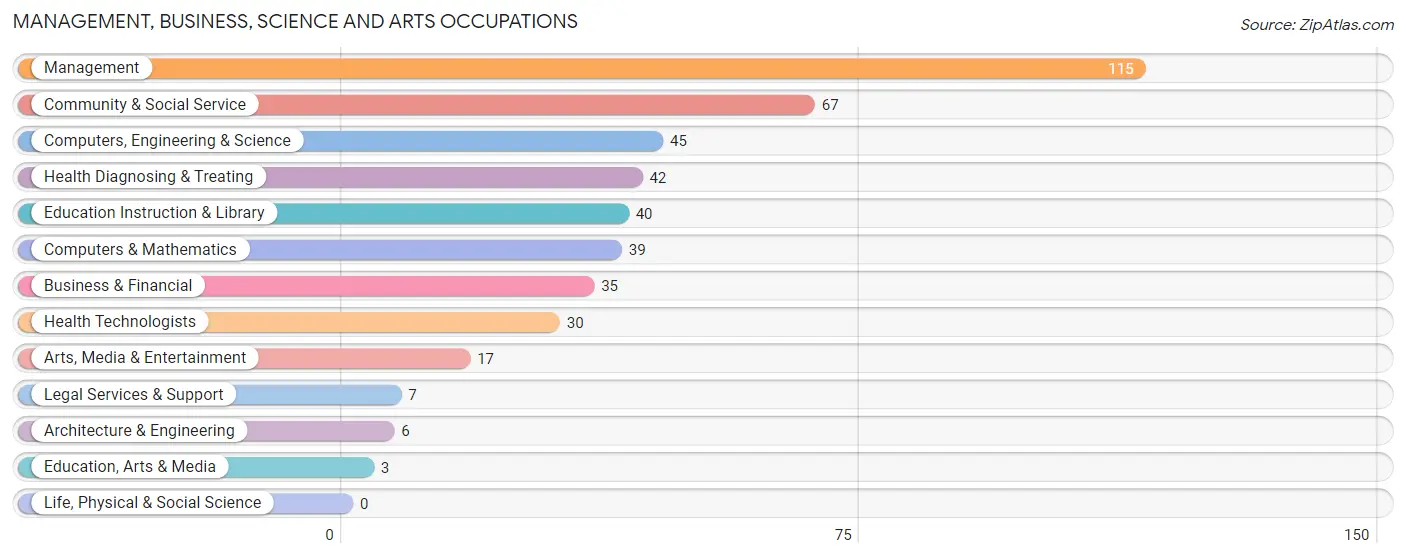
Management, Business, Science and Arts Occupations
The most common Management, Business, Science and Arts occupations in Waverly are Management (115 | 11.0%), Community & Social Service (67 | 6.4%), Computers, Engineering & Science (45 | 4.3%), Health Diagnosing & Treating (42 | 4.0%), and Education Instruction & Library (40 | 3.8%).
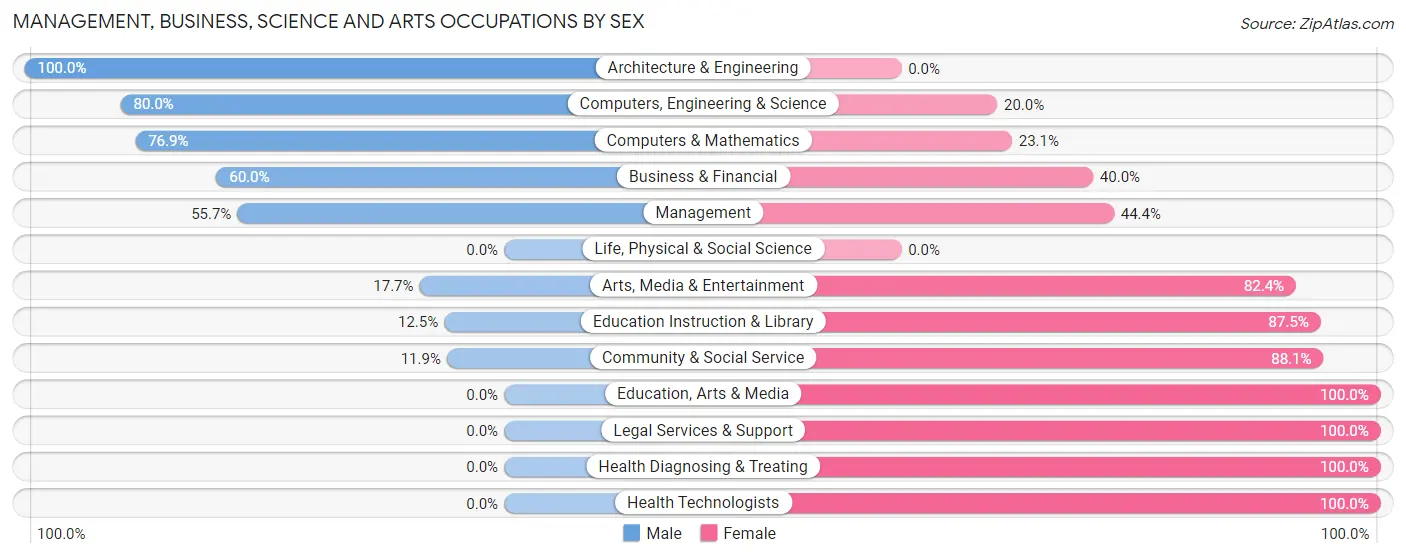
Management, Business, Science and Arts Occupations by Sex
Within the Management, Business, Science and Arts occupations in Waverly, the most male-oriented occupations are Architecture & Engineering (100.0%), Computers, Engineering & Science (80.0%), and Computers & Mathematics (76.9%), while the most female-oriented occupations are Education, Arts & Media (100.0%), Legal Services & Support (100.0%), and Health Diagnosing & Treating (100.0%).
| Occupation | Male | Female |
| Management | 64 (55.6%) | 51 (44.4%) |
| Business & Financial | 21 (60.0%) | 14 (40.0%) |
| Computers, Engineering & Science | 36 (80.0%) | 9 (20.0%) |
| Computers & Mathematics | 30 (76.9%) | 9 (23.1%) |
| Architecture & Engineering | 6 (100.0%) | 0 (0.0%) |
| Life, Physical & Social Science | 0 (0.0%) | 0 (0.0%) |
| Community & Social Service | 8 (11.9%) | 59 (88.1%) |
| Education, Arts & Media | 0 (0.0%) | 3 (100.0%) |
| Legal Services & Support | 0 (0.0%) | 7 (100.0%) |
| Education Instruction & Library | 5 (12.5%) | 35 (87.5%) |
| Arts, Media & Entertainment | 3 (17.6%) | 14 (82.4%) |
| Health Diagnosing & Treating | 0 (0.0%) | 42 (100.0%) |
| Health Technologists | 0 (0.0%) | 30 (100.0%) |
| Total (Category) | 129 (42.4%) | 175 (57.6%) |
| Total (Overall) | 572 (54.6%) | 475 (45.4%) |
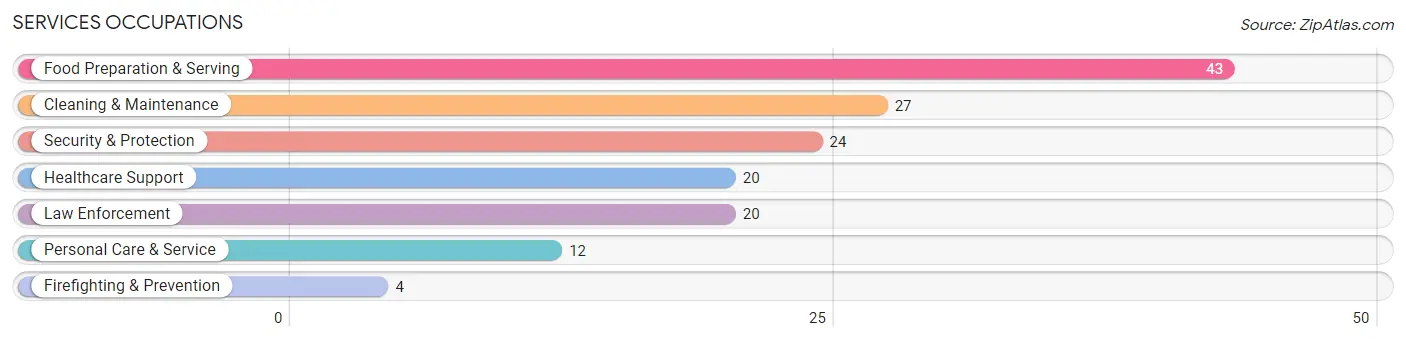
Services Occupations
The most common Services occupations in Waverly are Food Preparation & Serving (43 | 4.1%), Cleaning & Maintenance (27 | 2.6%), Security & Protection (24 | 2.3%), Healthcare Support (20 | 1.9%), and Law Enforcement (20 | 1.9%).
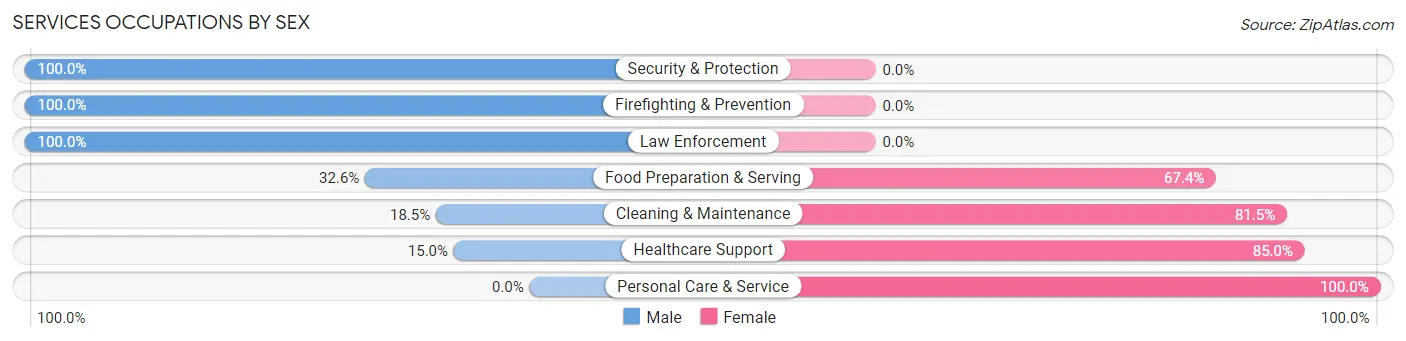
Services Occupations by Sex
Within the Services occupations in Waverly, the most male-oriented occupations are Security & Protection (100.0%), Firefighting & Prevention (100.0%), and Law Enforcement (100.0%), while the most female-oriented occupations are Personal Care & Service (100.0%), Healthcare Support (85.0%), and Cleaning & Maintenance (81.5%).
| Occupation | Male | Female |
| Healthcare Support | 3 (15.0%) | 17 (85.0%) |
| Security & Protection | 24 (100.0%) | 0 (0.0%) |
| Firefighting & Prevention | 4 (100.0%) | 0 (0.0%) |
| Law Enforcement | 20 (100.0%) | 0 (0.0%) |
| Food Preparation & Serving | 14 (32.6%) | 29 (67.4%) |
| Cleaning & Maintenance | 5 (18.5%) | 22 (81.5%) |
| Personal Care & Service | 0 (0.0%) | 12 (100.0%) |
| Total (Category) | 46 (36.5%) | 80 (63.5%) |
| Total (Overall) | 572 (54.6%) | 475 (45.4%) |
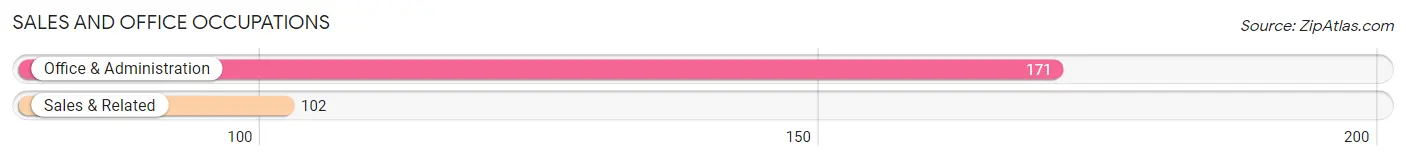
Sales and Office Occupations
The most common Sales and Office occupations in Waverly are Office & Administration (171 | 16.3%), and Sales & Related (102 | 9.7%).
Sales and Office Occupations by Sex
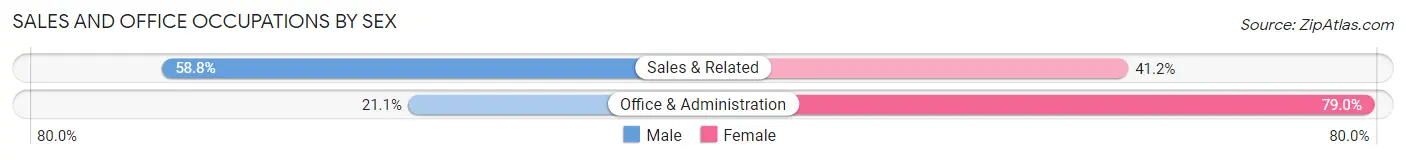
| Occupation | Male | Female |
| Sales & Related | 60 (58.8%) | 42 (41.2%) |
| Office & Administration | 36 (21.0%) | 135 (78.9%) |
| Total (Category) | 96 (35.2%) | 177 (64.8%) |
| Total (Overall) | 572 (54.6%) | 475 (45.4%) |
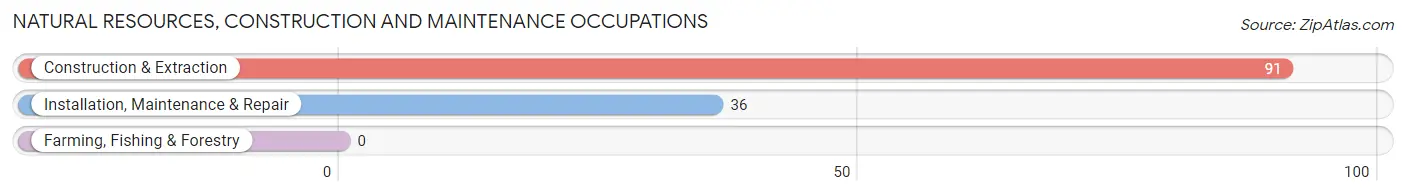
Natural Resources, Construction and Maintenance Occupations
The most common Natural Resources, Construction and Maintenance occupations in Waverly are Construction & Extraction (91 | 8.7%), and Installation, Maintenance & Repair (36 | 3.4%).
Natural Resources, Construction and Maintenance Occupations by Sex
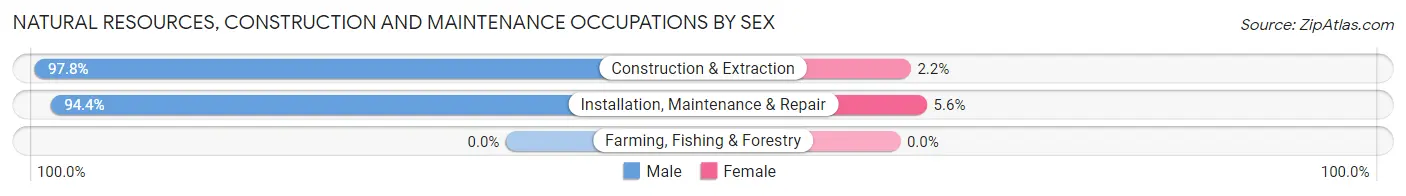
| Occupation | Male | Female |
| Farming, Fishing & Forestry | 0 (0.0%) | 0 (0.0%) |
| Construction & Extraction | 89 (97.8%) | 2 (2.2%) |
| Installation, Maintenance & Repair | 34 (94.4%) | 2 (5.6%) |
| Total (Category) | 123 (96.9%) | 4 (3.2%) |
| Total (Overall) | 572 (54.6%) | 475 (45.4%) |
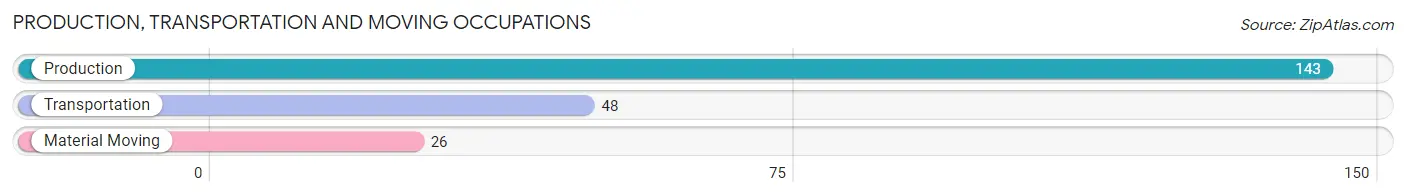
Production, Transportation and Moving Occupations
The most common Production, Transportation and Moving occupations in Waverly are Production (143 | 13.7%), Transportation (48 | 4.6%), and Material Moving (26 | 2.5%).
Production, Transportation and Moving Occupations by Sex
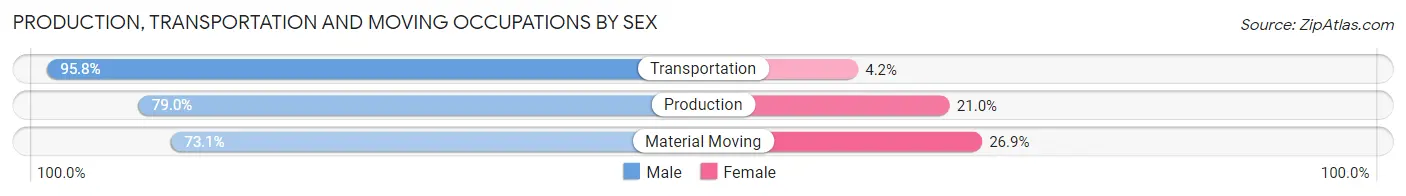
| Occupation | Male | Female |
| Production | 113 (79.0%) | 30 (21.0%) |
| Transportation | 46 (95.8%) | 2 (4.2%) |
| Material Moving | 19 (73.1%) | 7 (26.9%) |
| Total (Category) | 178 (82.0%) | 39 (18.0%) |
| Total (Overall) | 572 (54.6%) | 475 (45.4%) |
Employment Industries by Sex in Waverly
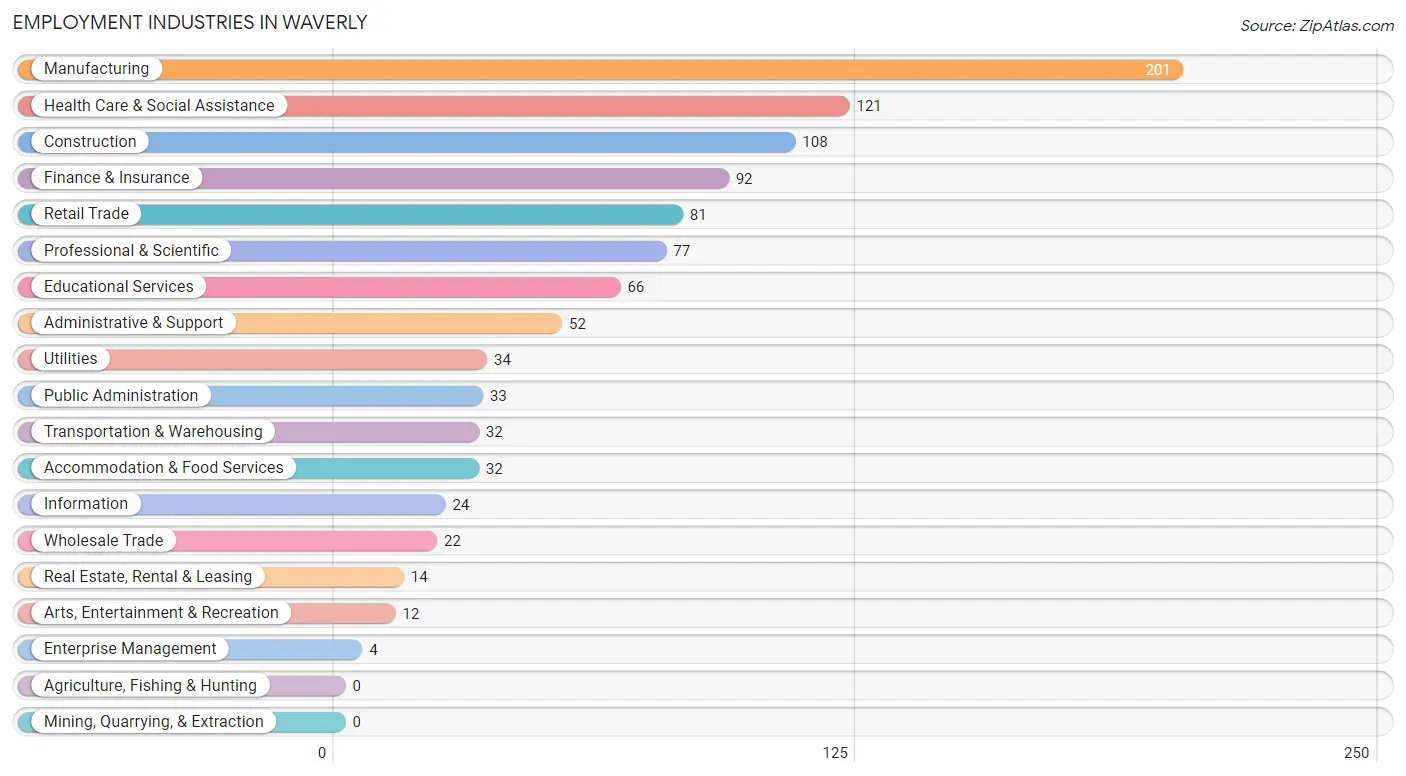
Employment Industries in Waverly
The major employment industries in Waverly include Manufacturing (201 | 19.2%), Health Care & Social Assistance (121 | 11.6%), Construction (108 | 10.3%), Finance & Insurance (92 | 8.8%), and Retail Trade (81 | 7.7%).
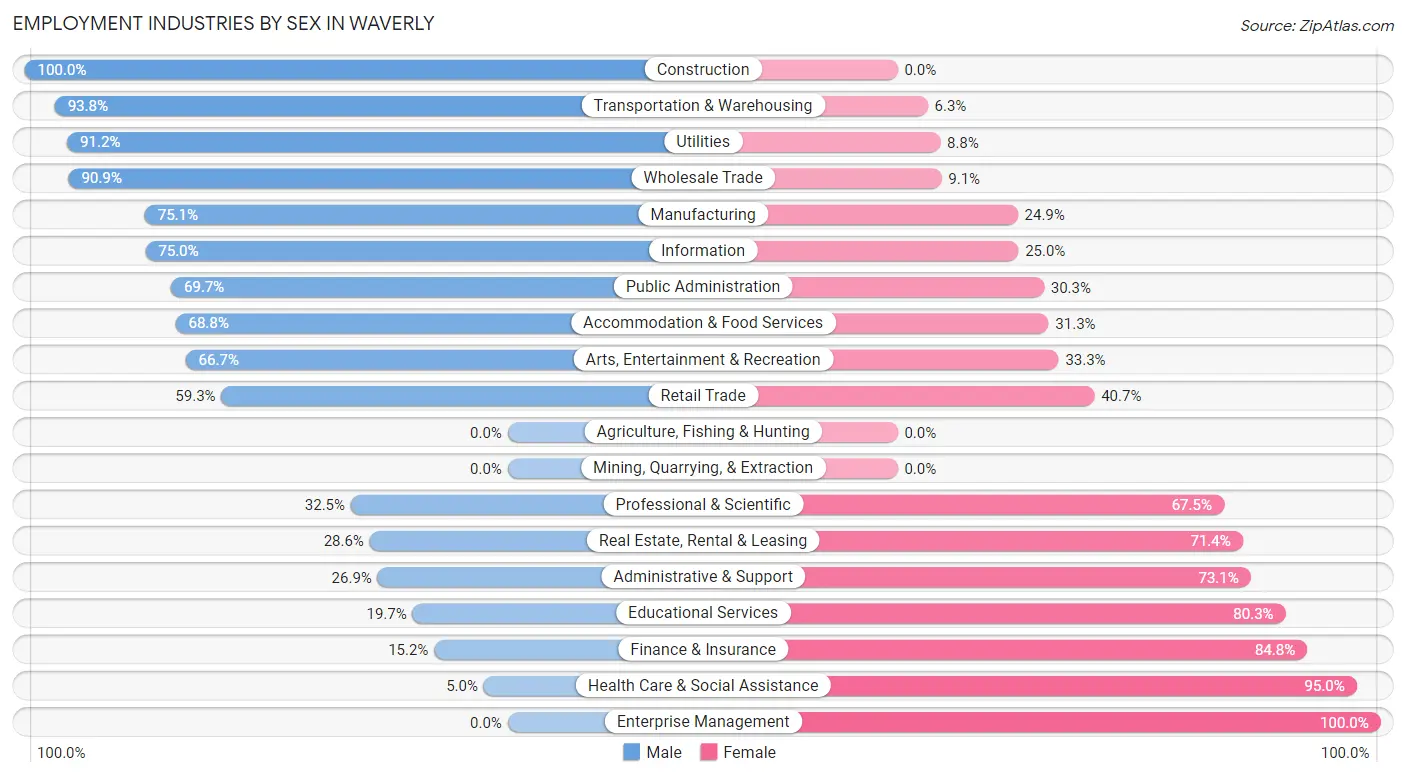
Employment Industries by Sex in Waverly
The Waverly industries that see more men than women are Construction (100.0%), Transportation & Warehousing (93.8%), and Utilities (91.2%), whereas the industries that tend to have a higher number of women are Enterprise Management (100.0%), Health Care & Social Assistance (95.0%), and Finance & Insurance (84.8%).
| Industry | Male | Female |
| Agriculture, Fishing & Hunting | 0 (0.0%) | 0 (0.0%) |
| Mining, Quarrying, & Extraction | 0 (0.0%) | 0 (0.0%) |
| Construction | 108 (100.0%) | 0 (0.0%) |
| Manufacturing | 151 (75.1%) | 50 (24.9%) |
| Wholesale Trade | 20 (90.9%) | 2 (9.1%) |
| Retail Trade | 48 (59.3%) | 33 (40.7%) |
| Transportation & Warehousing | 30 (93.8%) | 2 (6.2%) |
| Utilities | 31 (91.2%) | 3 (8.8%) |
| Information | 18 (75.0%) | 6 (25.0%) |
| Finance & Insurance | 14 (15.2%) | 78 (84.8%) |
| Real Estate, Rental & Leasing | 4 (28.6%) | 10 (71.4%) |
| Professional & Scientific | 25 (32.5%) | 52 (67.5%) |
| Enterprise Management | 0 (0.0%) | 4 (100.0%) |
| Administrative & Support | 14 (26.9%) | 38 (73.1%) |
| Educational Services | 13 (19.7%) | 53 (80.3%) |
| Health Care & Social Assistance | 6 (5.0%) | 115 (95.0%) |
| Arts, Entertainment & Recreation | 8 (66.7%) | 4 (33.3%) |
| Accommodation & Food Services | 22 (68.8%) | 10 (31.2%) |
| Public Administration | 23 (69.7%) | 10 (30.3%) |
| Total | 572 (54.6%) | 475 (45.4%) |
Education in Waverly
School Enrollment in Waverly
The most common levels of schooling among the 328 students in Waverly are elementary school (114 | 34.8%), middle school (79 | 24.1%), and nursery / preschool (42 | 12.8%).
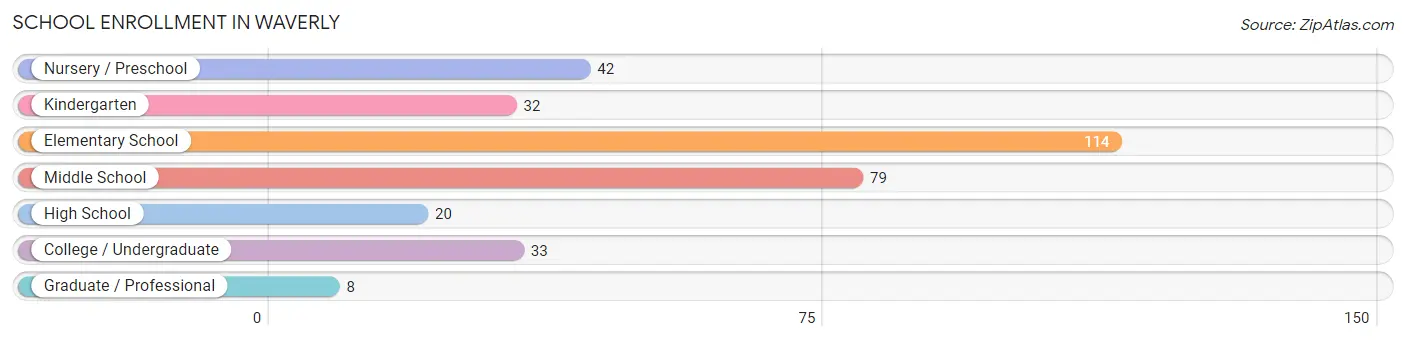
| School Level | # Students | % Students |
| Nursery / Preschool | 42 | 12.8% |
| Kindergarten | 32 | 9.8% |
| Elementary School | 114 | 34.8% |
| Middle School | 79 | 24.1% |
| High School | 20 | 6.1% |
| College / Undergraduate | 33 | 10.1% |
| Graduate / Professional | 8 | 2.4% |
| Total | 328 | 100.0% |
School Enrollment by Age by Funding Source in Waverly
Out of a total of 328 students who are enrolled in schools in Waverly, 41 (12.5%) attend a private institution, while the remaining 287 (87.5%) are enrolled in public schools. The age group of 25 to 34 year olds has the highest likelihood of being enrolled in private schools, with 3 (42.9% in the age bracket) enrolled. Conversely, the age group of 18 to 19 year olds has the lowest likelihood of being enrolled in a private school, with 5 (100.0% in the age bracket) attending a public institution.
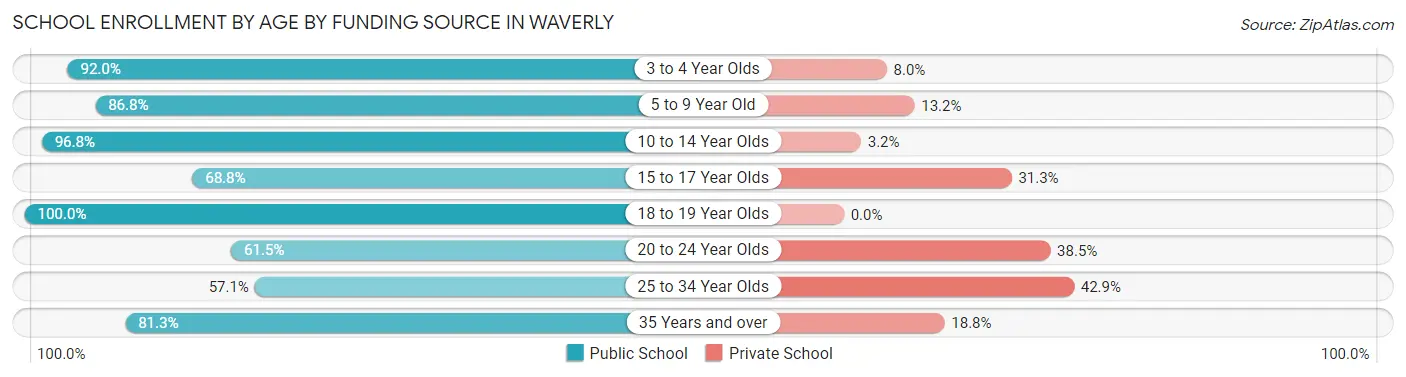
| Age Bracket | Public School | Private School |
| 3 to 4 Year Olds | 23 (92.0%) | 2 (8.0%) |
| 5 to 9 Year Old | 132 (86.8%) | 20 (13.2%) |
| 10 to 14 Year Olds | 91 (96.8%) | 3 (3.2%) |
| 15 to 17 Year Olds | 11 (68.8%) | 5 (31.2%) |
| 18 to 19 Year Olds | 5 (100.0%) | 0 (0.0%) |
| 20 to 24 Year Olds | 8 (61.5%) | 5 (38.5%) |
| 25 to 34 Year Olds | 4 (57.1%) | 3 (42.9%) |
| 35 Years and over | 13 (81.2%) | 3 (18.8%) |
| Total | 287 (87.5%) | 41 (12.5%) |
Educational Attainment by Field of Study in Waverly
Business (71 | 25.5%), science & technology (41 | 14.7%), arts & humanities (34 | 12.2%), education (24 | 8.6%), and literature & languages (21 | 7.5%) are the most common fields of study among 278 individuals in Waverly who have obtained a bachelor's degree or higher.
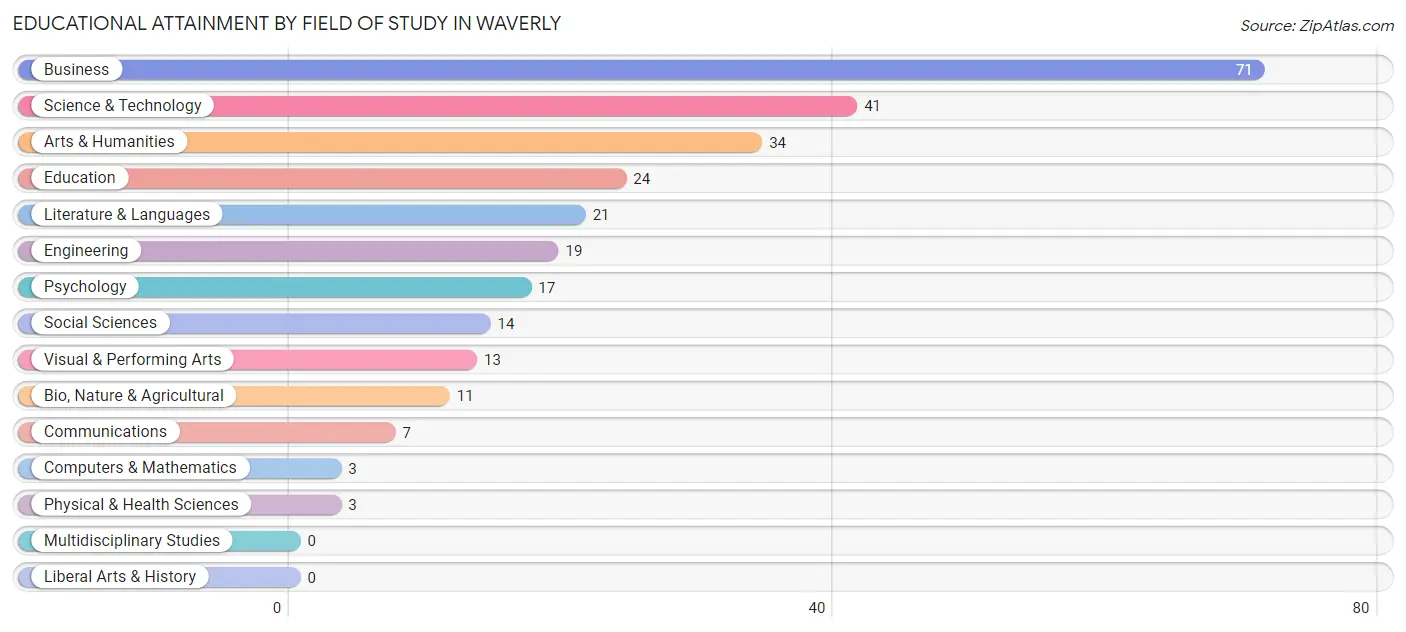
| Field of Study | # Graduates | % Graduates |
| Computers & Mathematics | 3 | 1.1% |
| Bio, Nature & Agricultural | 11 | 4.0% |
| Physical & Health Sciences | 3 | 1.1% |
| Psychology | 17 | 6.1% |
| Social Sciences | 14 | 5.0% |
| Engineering | 19 | 6.8% |
| Multidisciplinary Studies | 0 | 0.0% |
| Science & Technology | 41 | 14.7% |
| Business | 71 | 25.5% |
| Education | 24 | 8.6% |
| Literature & Languages | 21 | 7.5% |
| Liberal Arts & History | 0 | 0.0% |
| Visual & Performing Arts | 13 | 4.7% |
| Communications | 7 | 2.5% |
| Arts & Humanities | 34 | 12.2% |
| Total | 278 | 100.0% |
Transportation & Commute in Waverly
Vehicle Availability by Sex in Waverly
The most prevalent vehicle ownership categories in Waverly are males with 2 vehicles (239, accounting for 42.0%) and females with 2 vehicles (212, making up 50.6%).
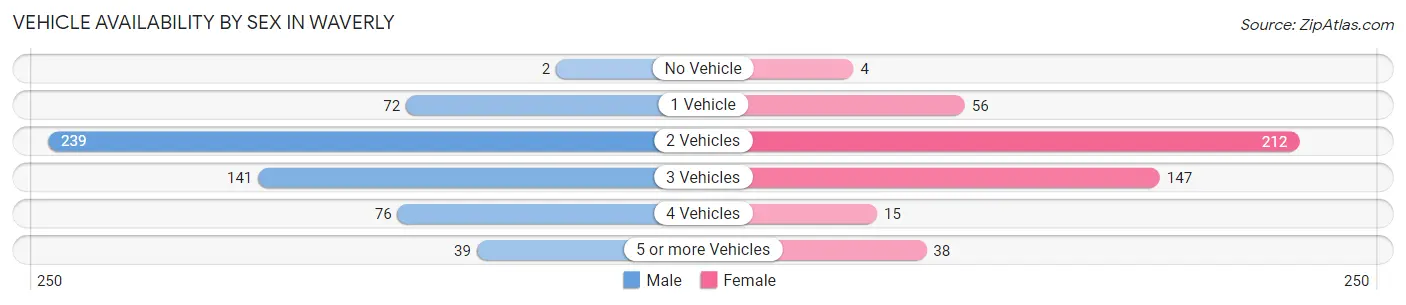
| Vehicles Available | Male | Female |
| No Vehicle | 2 (0.4%) | 4 (0.9%) |
| 1 Vehicle | 72 (12.7%) | 56 (11.9%) |
| 2 Vehicles | 239 (42.0%) | 212 (44.9%) |
| 3 Vehicles | 141 (24.8%) | 147 (31.1%) |
| 4 Vehicles | 76 (13.4%) | 15 (3.2%) |
| 5 or more Vehicles | 39 (6.9%) | 38 (8.1%) |
| Total | 569 (100.0%) | 472 (100.0%) |
Commute Time in Waverly
The most frequently occuring commute durations in Waverly are 45 to 59 minutes (176 commuters, 19.8%), 20 to 24 minutes (139 commuters, 15.6%), and 60 to 89 minutes (130 commuters, 14.6%).
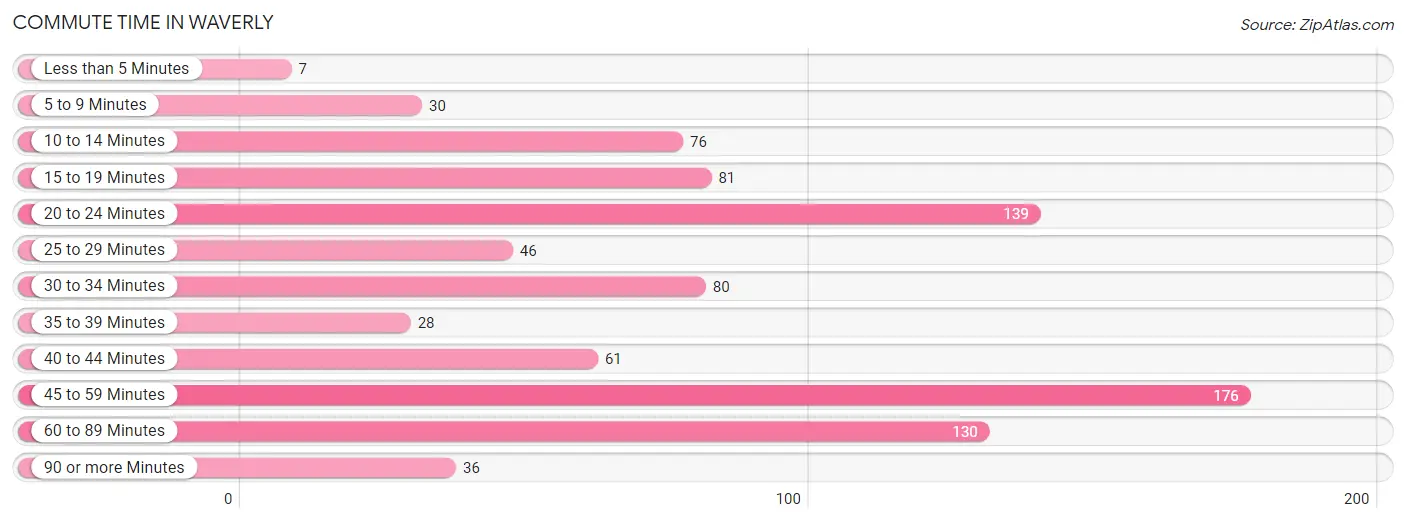
| Commute Time | # Commuters | % Commuters |
| Less than 5 Minutes | 7 | 0.8% |
| 5 to 9 Minutes | 30 | 3.4% |
| 10 to 14 Minutes | 76 | 8.5% |
| 15 to 19 Minutes | 81 | 9.1% |
| 20 to 24 Minutes | 139 | 15.6% |
| 25 to 29 Minutes | 46 | 5.2% |
| 30 to 34 Minutes | 80 | 9.0% |
| 35 to 39 Minutes | 28 | 3.2% |
| 40 to 44 Minutes | 61 | 6.9% |
| 45 to 59 Minutes | 176 | 19.8% |
| 60 to 89 Minutes | 130 | 14.6% |
| 90 or more Minutes | 36 | 4.0% |
Commute Time by Sex in Waverly
The most common commute times in Waverly are 45 to 59 minutes (94 commuters, 17.7%) for males and 45 to 59 minutes (82 commuters, 22.8%) for females.
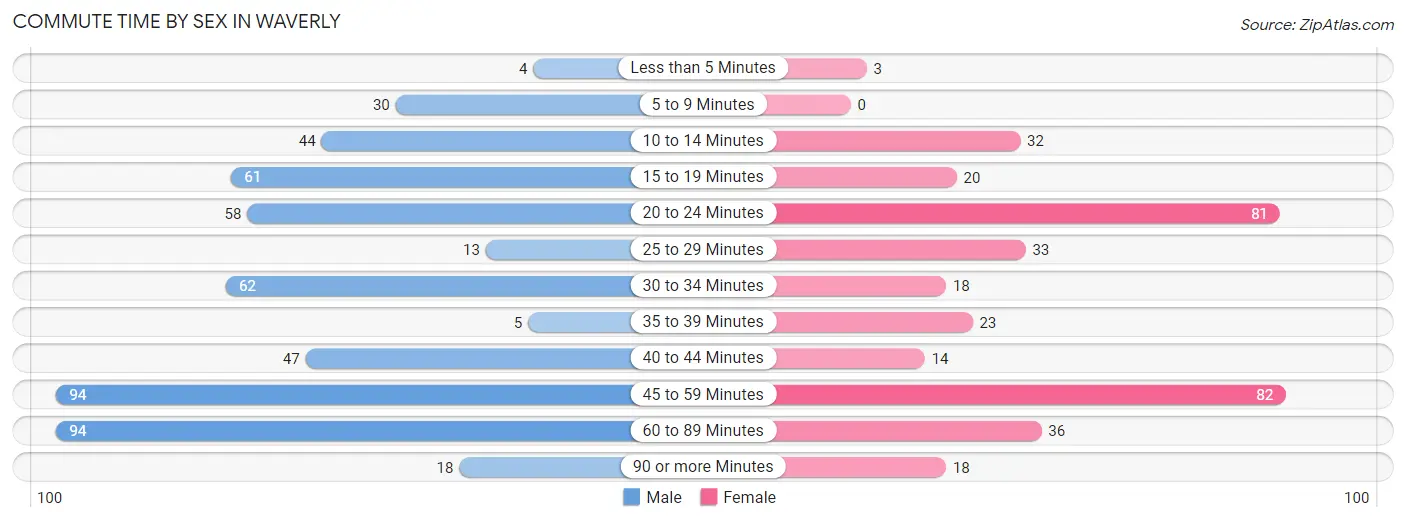
| Commute Time | Male | Female |
| Less than 5 Minutes | 4 (0.7%) | 3 (0.8%) |
| 5 to 9 Minutes | 30 (5.7%) | 0 (0.0%) |
| 10 to 14 Minutes | 44 (8.3%) | 32 (8.9%) |
| 15 to 19 Minutes | 61 (11.5%) | 20 (5.6%) |
| 20 to 24 Minutes | 58 (10.9%) | 81 (22.5%) |
| 25 to 29 Minutes | 13 (2.5%) | 33 (9.2%) |
| 30 to 34 Minutes | 62 (11.7%) | 18 (5.0%) |
| 35 to 39 Minutes | 5 (0.9%) | 23 (6.4%) |
| 40 to 44 Minutes | 47 (8.9%) | 14 (3.9%) |
| 45 to 59 Minutes | 94 (17.7%) | 82 (22.8%) |
| 60 to 89 Minutes | 94 (17.7%) | 36 (10.0%) |
| 90 or more Minutes | 18 (3.4%) | 18 (5.0%) |
Time of Departure to Work by Sex in Waverly
The most frequent times of departure to work in Waverly are 5:30 AM to 5:59 AM (97, 18.3%) for males and 6:00 AM to 6:29 AM (95, 26.4%) for females.
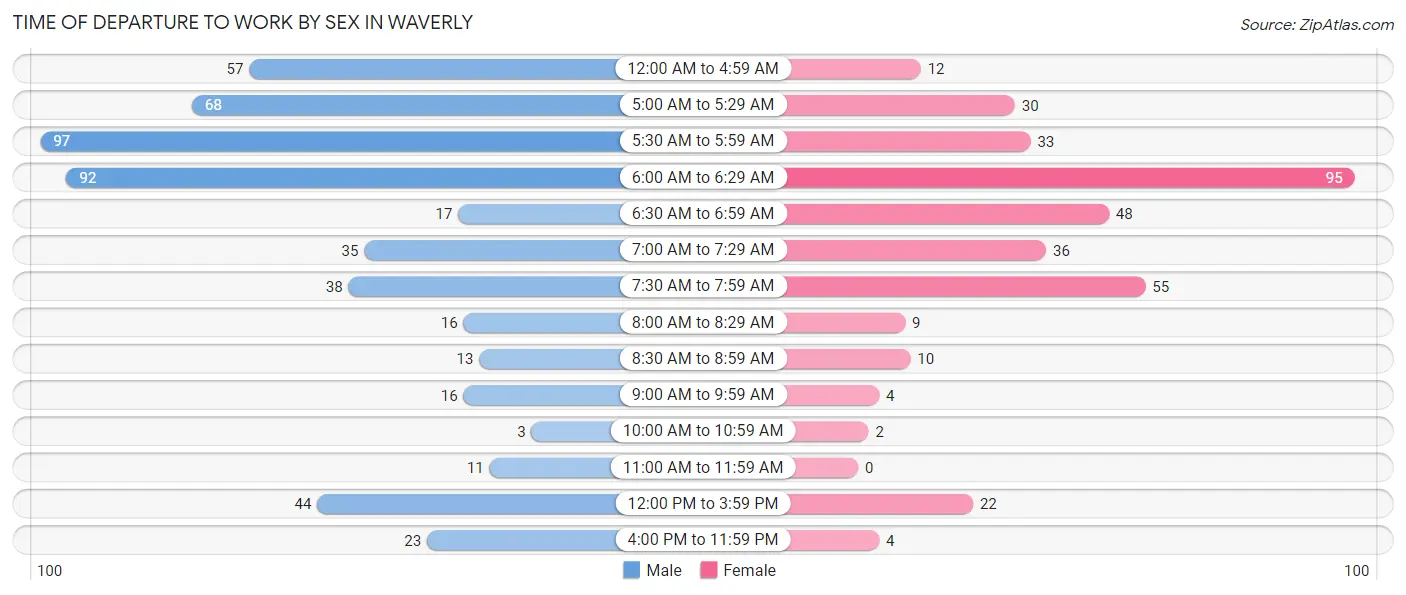
| Time of Departure | Male | Female |
| 12:00 AM to 4:59 AM | 57 (10.7%) | 12 (3.3%) |
| 5:00 AM to 5:29 AM | 68 (12.8%) | 30 (8.3%) |
| 5:30 AM to 5:59 AM | 97 (18.3%) | 33 (9.2%) |
| 6:00 AM to 6:29 AM | 92 (17.4%) | 95 (26.4%) |
| 6:30 AM to 6:59 AM | 17 (3.2%) | 48 (13.3%) |
| 7:00 AM to 7:29 AM | 35 (6.6%) | 36 (10.0%) |
| 7:30 AM to 7:59 AM | 38 (7.2%) | 55 (15.3%) |
| 8:00 AM to 8:29 AM | 16 (3.0%) | 9 (2.5%) |
| 8:30 AM to 8:59 AM | 13 (2.5%) | 10 (2.8%) |
| 9:00 AM to 9:59 AM | 16 (3.0%) | 4 (1.1%) |
| 10:00 AM to 10:59 AM | 3 (0.6%) | 2 (0.6%) |
| 11:00 AM to 11:59 AM | 11 (2.1%) | 0 (0.0%) |
| 12:00 PM to 3:59 PM | 44 (8.3%) | 22 (6.1%) |
| 4:00 PM to 11:59 PM | 23 (4.3%) | 4 (1.1%) |
| Total | 530 (100.0%) | 360 (100.0%) |
Housing Occupancy in Waverly
Occupancy by Ownership in Waverly
Of the total 650 dwellings in Waverly, owner-occupied units account for 586 (90.1%), while renter-occupied units make up 64 (9.9%).
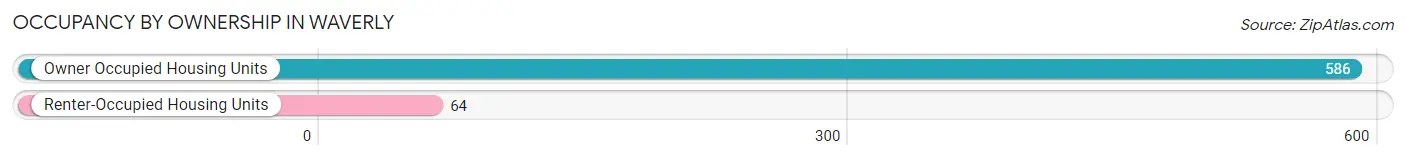
| Occupancy | # Housing Units | % Housing Units |
| Owner Occupied Housing Units | 586 | 90.1% |
| Renter-Occupied Housing Units | 64 | 9.9% |
| Total Occupied Housing Units | 650 | 100.0% |
Occupancy by Household Size in Waverly
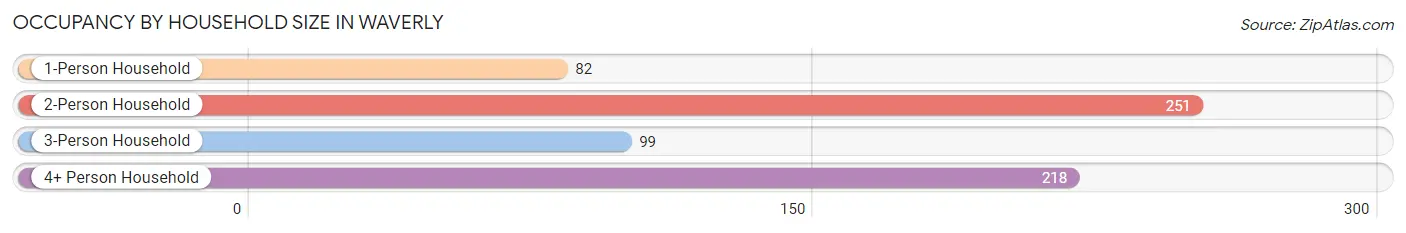
| Household Size | # Housing Units | % Housing Units |
| 1-Person Household | 82 | 12.6% |
| 2-Person Household | 251 | 38.6% |
| 3-Person Household | 99 | 15.2% |
| 4+ Person Household | 218 | 33.5% |
| Total Housing Units | 650 | 100.0% |
Occupancy by Ownership by Household Size in Waverly
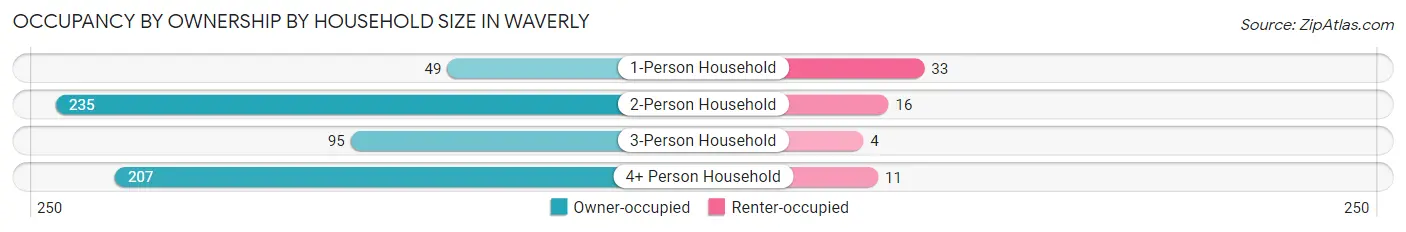
| Household Size | Owner-occupied | Renter-occupied |
| 1-Person Household | 49 (59.8%) | 33 (40.2%) |
| 2-Person Household | 235 (93.6%) | 16 (6.4%) |
| 3-Person Household | 95 (96.0%) | 4 (4.0%) |
| 4+ Person Household | 207 (95.0%) | 11 (5.1%) |
| Total Housing Units | 586 (90.1%) | 64 (9.9%) |
Occupancy by Educational Attainment in Waverly
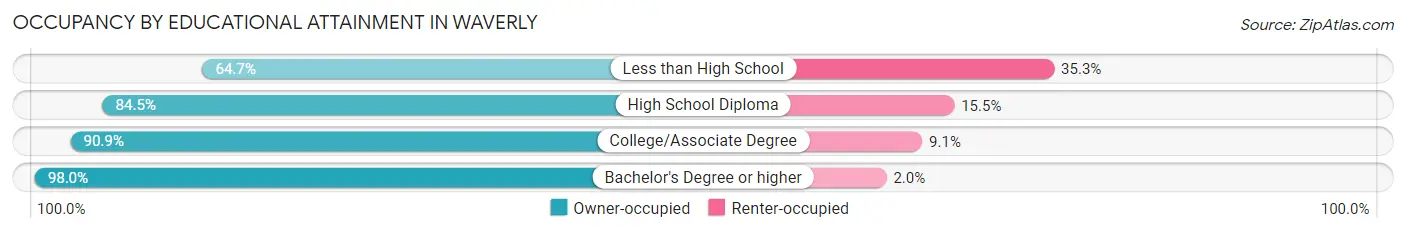
| Household Size | Owner-occupied | Renter-occupied |
| Less than High School | 11 (64.7%) | 6 (35.3%) |
| High School Diploma | 142 (84.5%) | 26 (15.5%) |
| College/Associate Degree | 289 (90.9%) | 29 (9.1%) |
| Bachelor's Degree or higher | 144 (98.0%) | 3 (2.0%) |
Occupancy by Age of Householder in Waverly
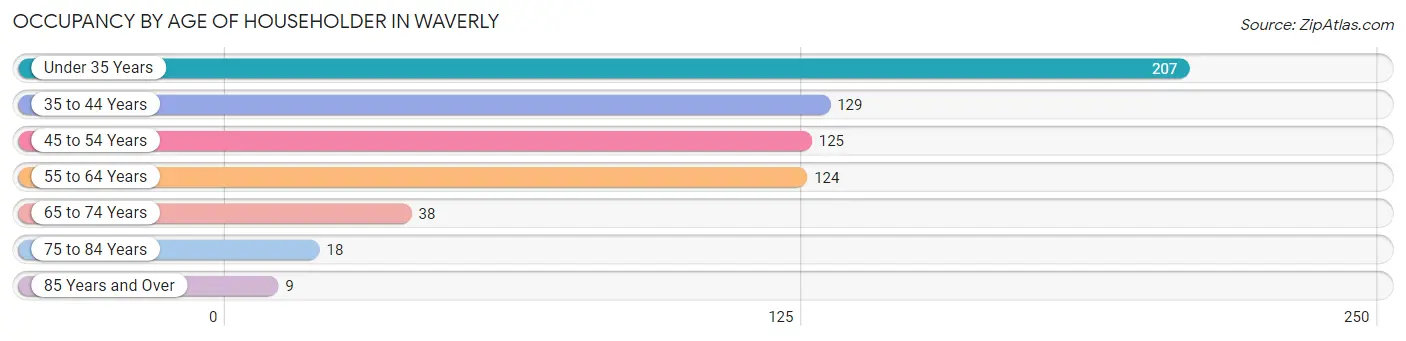
| Age Bracket | # Households | % Households |
| Under 35 Years | 207 | 31.9% |
| 35 to 44 Years | 129 | 19.9% |
| 45 to 54 Years | 125 | 19.2% |
| 55 to 64 Years | 124 | 19.1% |
| 65 to 74 Years | 38 | 5.9% |
| 75 to 84 Years | 18 | 2.8% |
| 85 Years and Over | 9 | 1.4% |
| Total | 650 | 100.0% |
Housing Finances in Waverly
Median Income by Occupancy in Waverly
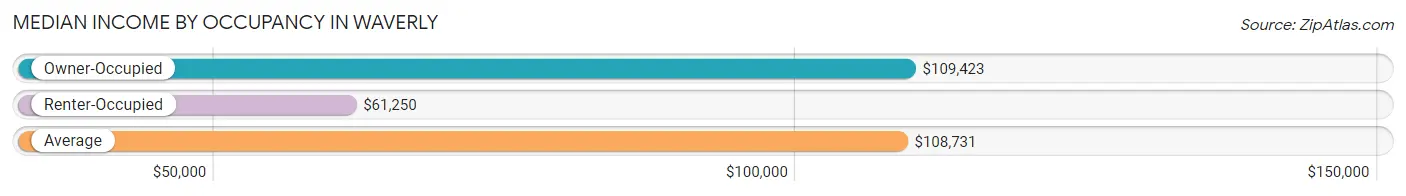
| Occupancy Type | # Households | Median Income |
| Owner-Occupied | 586 (90.1%) | $109,423 |
| Renter-Occupied | 64 (9.9%) | $61,250 |
| Average | 650 (100.0%) | $108,731 |
Occupancy by Householder Income Bracket in Waverly
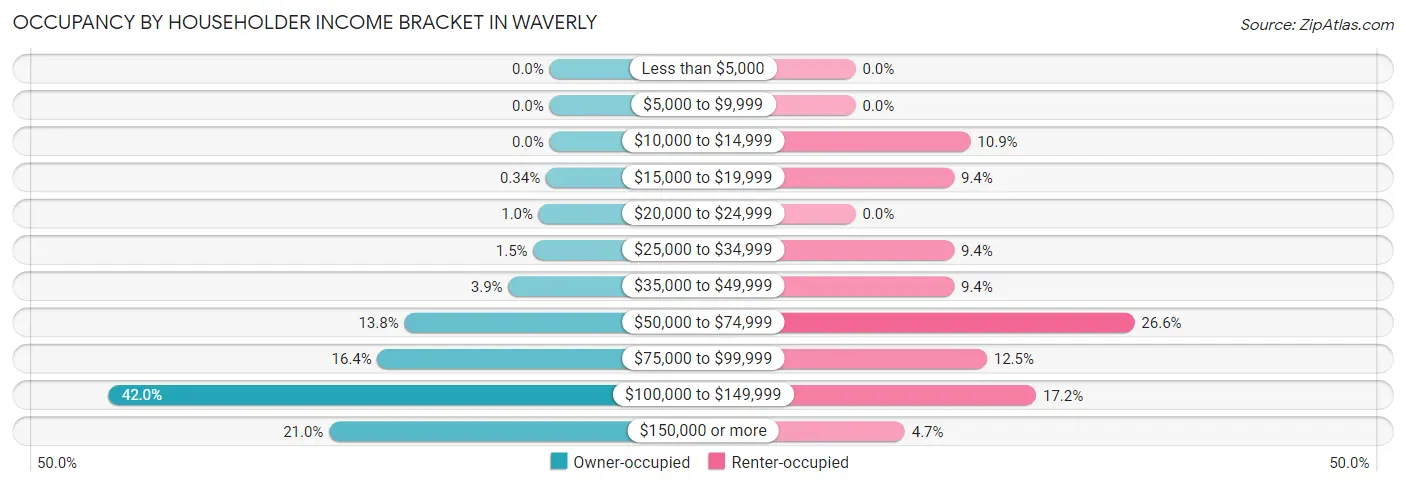
| Income Bracket | Owner-occupied | Renter-occupied |
| Less than $5,000 | 0 (0.0%) | 0 (0.0%) |
| $5,000 to $9,999 | 0 (0.0%) | 0 (0.0%) |
| $10,000 to $14,999 | 0 (0.0%) | 7 (10.9%) |
| $15,000 to $19,999 | 2 (0.3%) | 6 (9.4%) |
| $20,000 to $24,999 | 6 (1.0%) | 0 (0.0%) |
| $25,000 to $34,999 | 9 (1.5%) | 6 (9.4%) |
| $35,000 to $49,999 | 23 (3.9%) | 6 (9.4%) |
| $50,000 to $74,999 | 81 (13.8%) | 17 (26.6%) |
| $75,000 to $99,999 | 96 (16.4%) | 8 (12.5%) |
| $100,000 to $149,999 | 246 (42.0%) | 11 (17.2%) |
| $150,000 or more | 123 (21.0%) | 3 (4.7%) |
| Total | 586 (100.0%) | 64 (100.0%) |
Monthly Housing Cost Tiers in Waverly
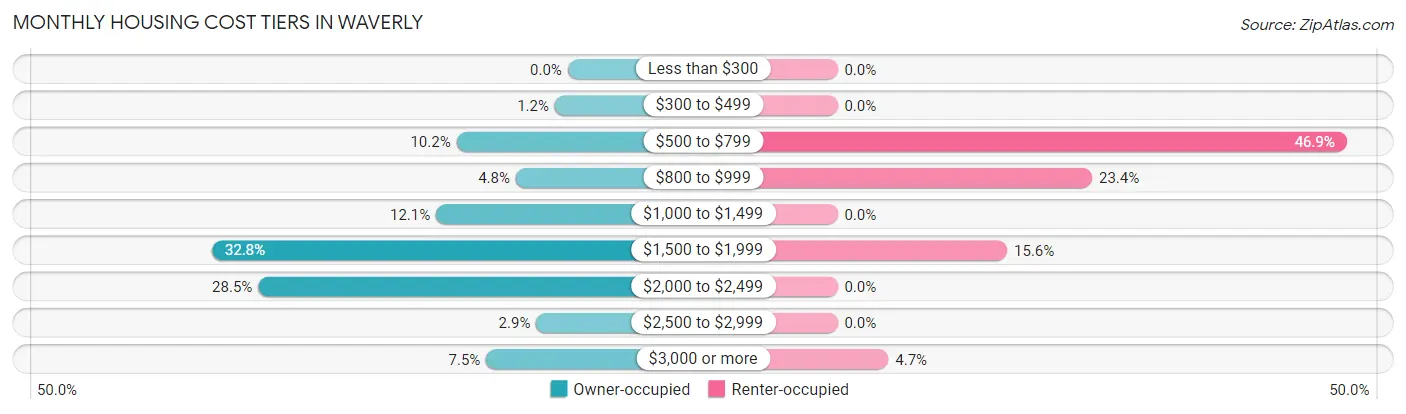
| Monthly Cost | Owner-occupied | Renter-occupied |
| Less than $300 | 0 (0.0%) | 0 (0.0%) |
| $300 to $499 | 7 (1.2%) | 0 (0.0%) |
| $500 to $799 | 60 (10.2%) | 30 (46.9%) |
| $800 to $999 | 28 (4.8%) | 15 (23.4%) |
| $1,000 to $1,499 | 71 (12.1%) | 0 (0.0%) |
| $1,500 to $1,999 | 192 (32.8%) | 10 (15.6%) |
| $2,000 to $2,499 | 167 (28.5%) | 0 (0.0%) |
| $2,500 to $2,999 | 17 (2.9%) | 0 (0.0%) |
| $3,000 or more | 44 (7.5%) | 3 (4.7%) |
| Total | 586 (100.0%) | 64 (100.0%) |
Physical Housing Characteristics in Waverly
Housing Structures in Waverly
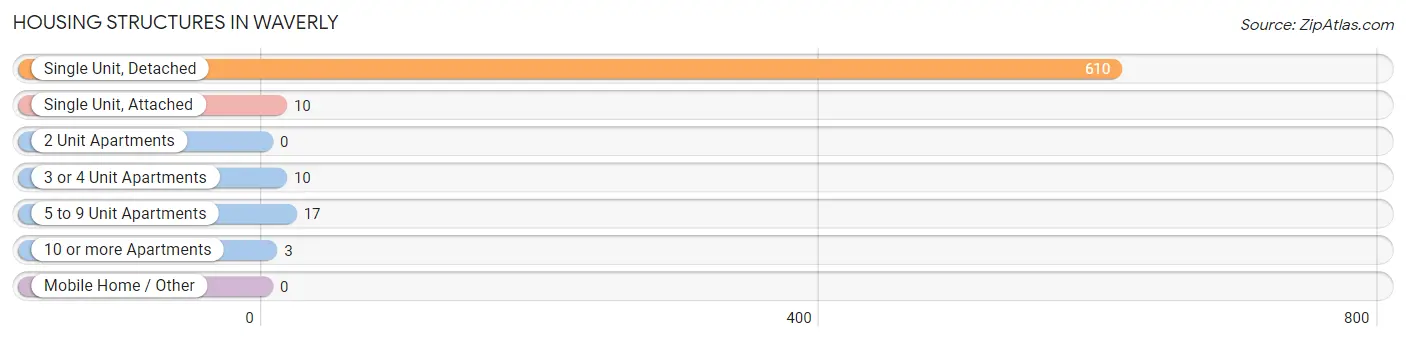
| Structure Type | # Housing Units | % Housing Units |
| Single Unit, Detached | 610 | 93.9% |
| Single Unit, Attached | 10 | 1.5% |
| 2 Unit Apartments | 0 | 0.0% |
| 3 or 4 Unit Apartments | 10 | 1.5% |
| 5 to 9 Unit Apartments | 17 | 2.6% |
| 10 or more Apartments | 3 | 0.5% |
| Mobile Home / Other | 0 | 0.0% |
| Total | 650 | 100.0% |
Housing Structures by Occupancy in Waverly
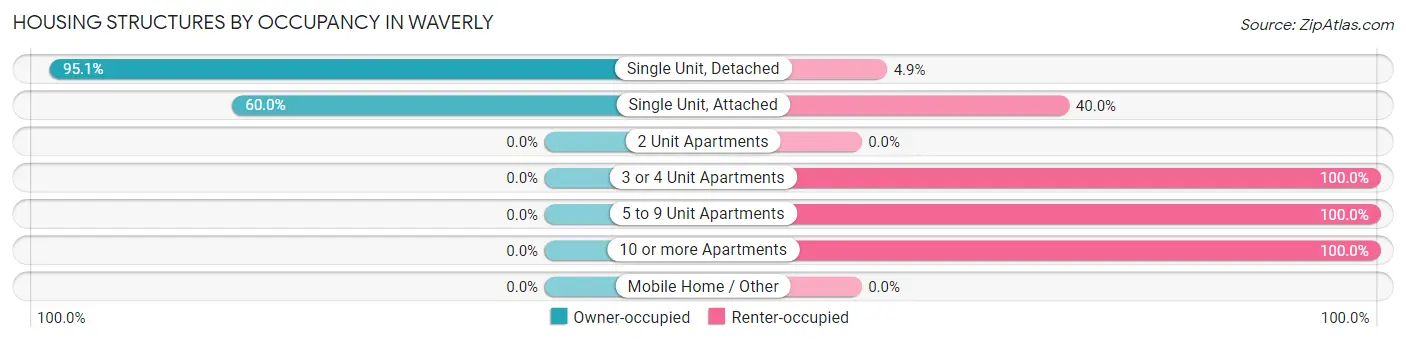
| Structure Type | Owner-occupied | Renter-occupied |
| Single Unit, Detached | 580 (95.1%) | 30 (4.9%) |
| Single Unit, Attached | 6 (60.0%) | 4 (40.0%) |
| 2 Unit Apartments | 0 (0.0%) | 0 (0.0%) |
| 3 or 4 Unit Apartments | 0 (0.0%) | 10 (100.0%) |
| 5 to 9 Unit Apartments | 0 (0.0%) | 17 (100.0%) |
| 10 or more Apartments | 0 (0.0%) | 3 (100.0%) |
| Mobile Home / Other | 0 (0.0%) | 0 (0.0%) |
| Total | 586 (90.1%) | 64 (9.9%) |
Housing Structures by Number of Rooms in Waverly
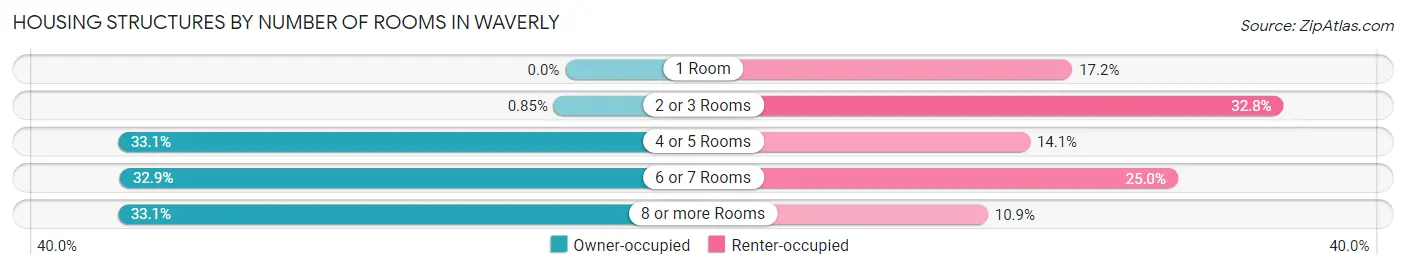
| Number of Rooms | Owner-occupied | Renter-occupied |
| 1 Room | 0 (0.0%) | 11 (17.2%) |
| 2 or 3 Rooms | 5 (0.9%) | 21 (32.8%) |
| 4 or 5 Rooms | 194 (33.1%) | 9 (14.1%) |
| 6 or 7 Rooms | 193 (32.9%) | 16 (25.0%) |
| 8 or more Rooms | 194 (33.1%) | 7 (10.9%) |
| Total | 586 (100.0%) | 64 (100.0%) |
Housing Structure by Heating Type in Waverly
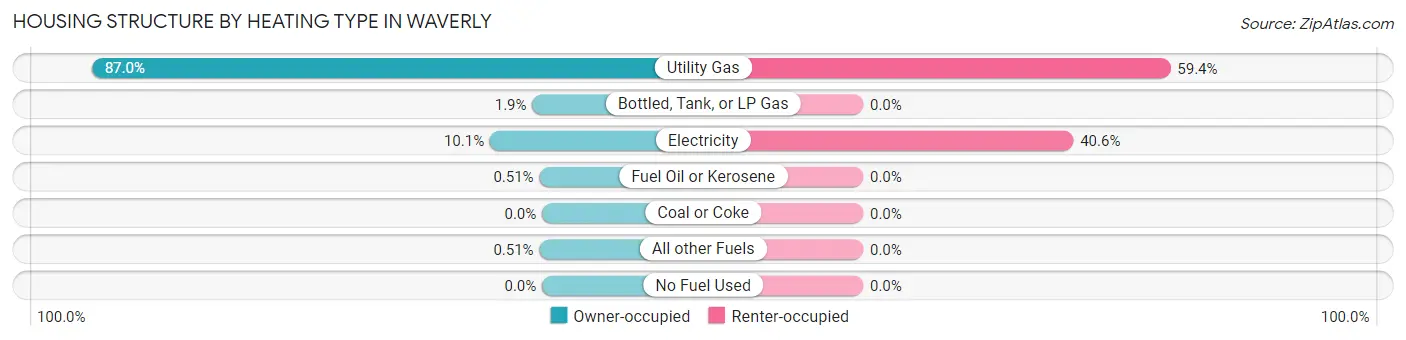
| Heating Type | Owner-occupied | Renter-occupied |
| Utility Gas | 510 (87.0%) | 38 (59.4%) |
| Bottled, Tank, or LP Gas | 11 (1.9%) | 0 (0.0%) |
| Electricity | 59 (10.1%) | 26 (40.6%) |
| Fuel Oil or Kerosene | 3 (0.5%) | 0 (0.0%) |
| Coal or Coke | 0 (0.0%) | 0 (0.0%) |
| All other Fuels | 3 (0.5%) | 0 (0.0%) |
| No Fuel Used | 0 (0.0%) | 0 (0.0%) |
| Total | 586 (100.0%) | 64 (100.0%) |
Household Vehicle Usage in Waverly
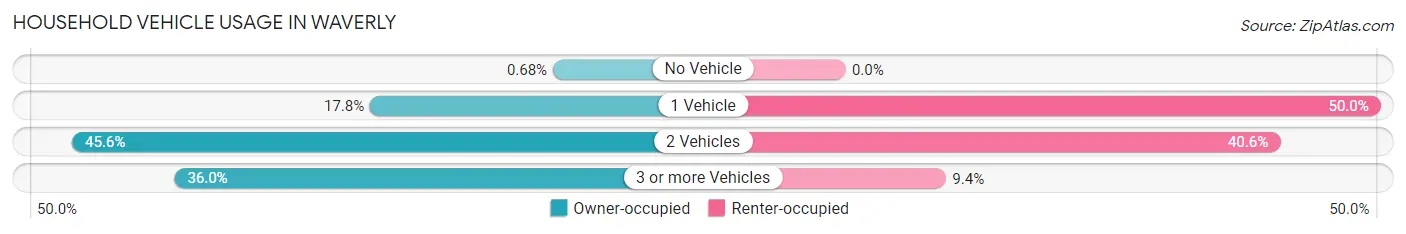
| Vehicles per Household | Owner-occupied | Renter-occupied |
| No Vehicle | 4 (0.7%) | 0 (0.0%) |
| 1 Vehicle | 104 (17.7%) | 32 (50.0%) |
| 2 Vehicles | 267 (45.6%) | 26 (40.6%) |
| 3 or more Vehicles | 211 (36.0%) | 6 (9.4%) |
| Total | 586 (100.0%) | 64 (100.0%) |
Real Estate & Mortgages in Waverly
Real Estate and Mortgage Overview in Waverly
| Characteristic | Without Mortgage | With Mortgage |
| Housing Units | 101 | 485 |
| Median Property Value | $242,000 | $273,700 |
| Median Household Income | $113,162 | $103 |
| Monthly Housing Costs | $689 | $44 |
| Real Estate Taxes | $2,784 | $5 |
Property Value by Mortgage Status in Waverly
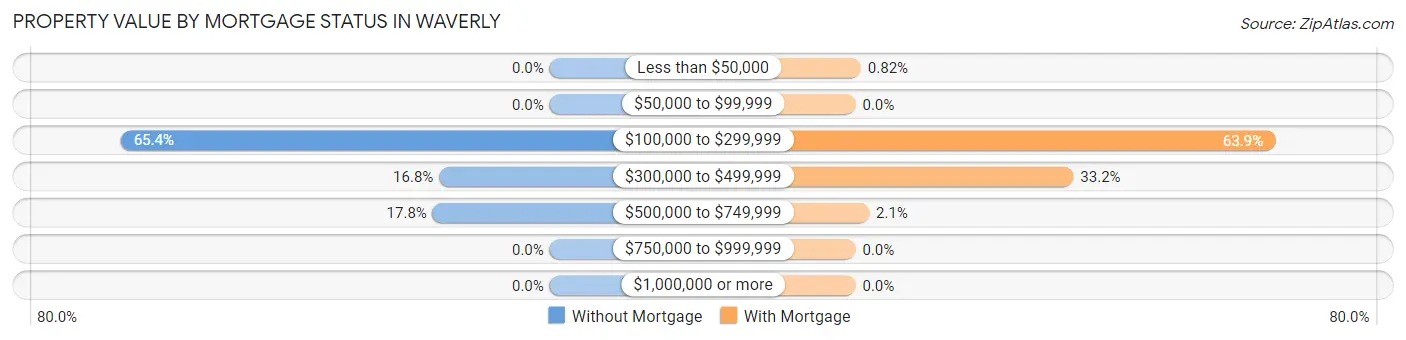
| Property Value | Without Mortgage | With Mortgage |
| Less than $50,000 | 0 (0.0%) | 4 (0.8%) |
| $50,000 to $99,999 | 0 (0.0%) | 0 (0.0%) |
| $100,000 to $299,999 | 66 (65.3%) | 310 (63.9%) |
| $300,000 to $499,999 | 17 (16.8%) | 161 (33.2%) |
| $500,000 to $749,999 | 18 (17.8%) | 10 (2.1%) |
| $750,000 to $999,999 | 0 (0.0%) | 0 (0.0%) |
| $1,000,000 or more | 0 (0.0%) | 0 (0.0%) |
| Total | 101 (100.0%) | 485 (100.0%) |
Household Income by Mortgage Status in Waverly
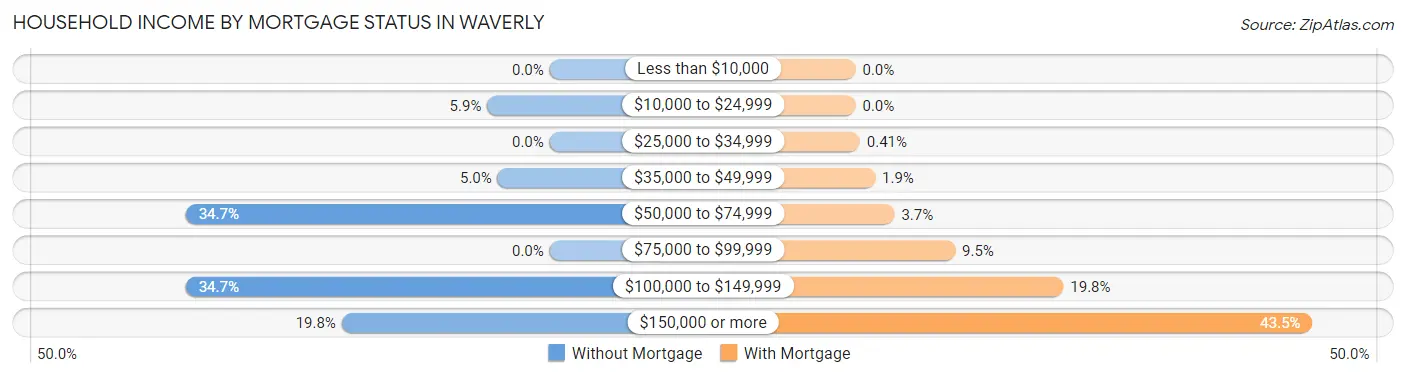
| Household Income | Without Mortgage | With Mortgage |
| Less than $10,000 | 0 (0.0%) | 0 (0.0%) |
| $10,000 to $24,999 | 6 (5.9%) | 0 (0.0%) |
| $25,000 to $34,999 | 0 (0.0%) | 2 (0.4%) |
| $35,000 to $49,999 | 5 (5.0%) | 9 (1.9%) |
| $50,000 to $74,999 | 35 (34.6%) | 18 (3.7%) |
| $75,000 to $99,999 | 0 (0.0%) | 46 (9.5%) |
| $100,000 to $149,999 | 35 (34.6%) | 96 (19.8%) |
| $150,000 or more | 20 (19.8%) | 211 (43.5%) |
| Total | 101 (100.0%) | 485 (100.0%) |
Property Value to Household Income Ratio in Waverly
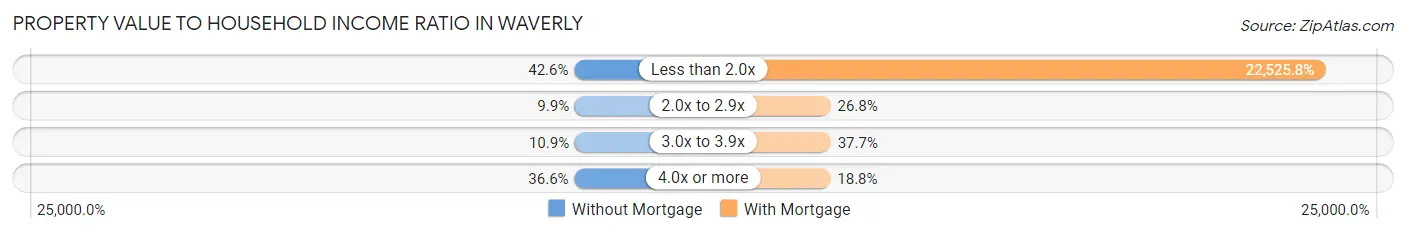
| Value-to-Income Ratio | Without Mortgage | With Mortgage |
| Less than 2.0x | 43 (42.6%) | 109,250 (22,525.8%) |
| 2.0x to 2.9x | 10 (9.9%) | 130 (26.8%) |
| 3.0x to 3.9x | 11 (10.9%) | 183 (37.7%) |
| 4.0x or more | 37 (36.6%) | 91 (18.8%) |
| Total | 101 (100.0%) | 485 (100.0%) |
Real Estate Taxes by Mortgage Status in Waverly
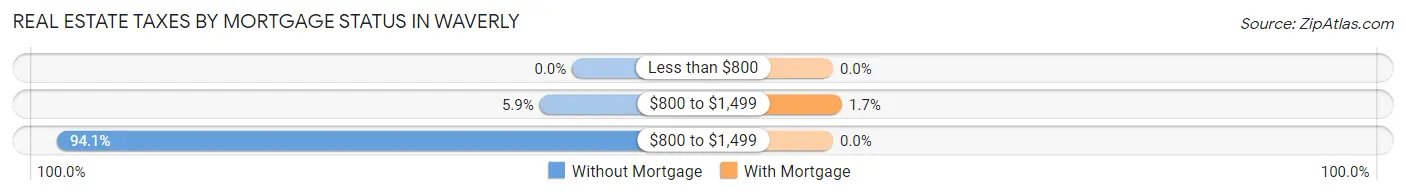
| Property Taxes | Without Mortgage | With Mortgage |
| Less than $800 | 0 (0.0%) | 0 (0.0%) |
| $800 to $1,499 | 6 (5.9%) | 8 (1.7%) |
| $800 to $1,499 | 95 (94.1%) | 0 (0.0%) |
| Total | 101 (100.0%) | 485 (100.0%) |
Health & Disability in Waverly
Health Insurance Coverage by Age in Waverly
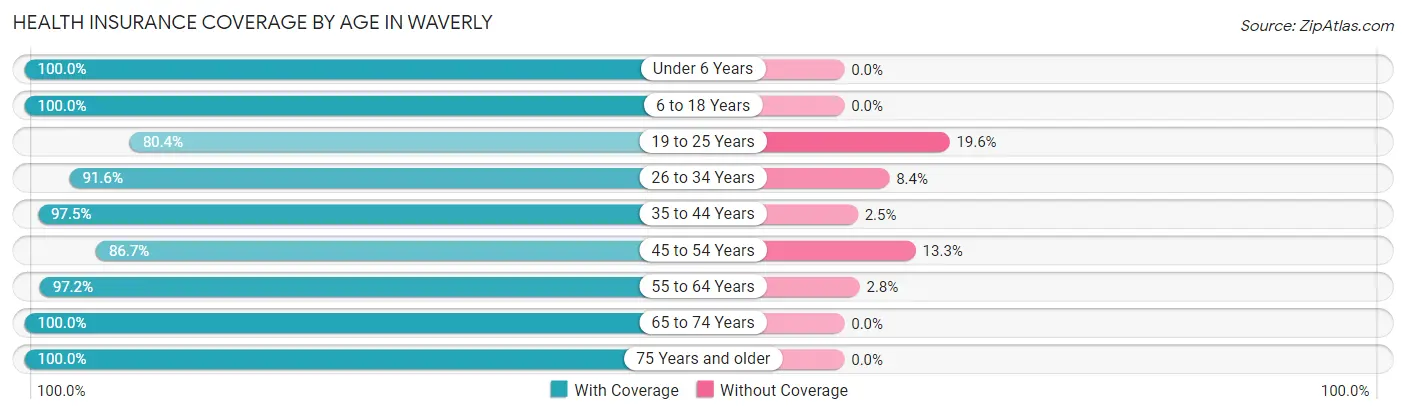
| Age Bracket | With Coverage | Without Coverage |
| Under 6 Years | 162 (100.0%) | 0 (0.0%) |
| 6 to 18 Years | 270 (100.0%) | 0 (0.0%) |
| 19 to 25 Years | 82 (80.4%) | 20 (19.6%) |
| 26 to 34 Years | 350 (91.6%) | 32 (8.4%) |
| 35 to 44 Years | 273 (97.5%) | 7 (2.5%) |
| 45 to 54 Years | 254 (86.7%) | 39 (13.3%) |
| 55 to 64 Years | 205 (97.2%) | 6 (2.8%) |
| 65 to 74 Years | 63 (100.0%) | 0 (0.0%) |
| 75 Years and older | 40 (100.0%) | 0 (0.0%) |
| Total | 1,699 (94.2%) | 104 (5.8%) |
Health Insurance Coverage by Citizenship Status in Waverly
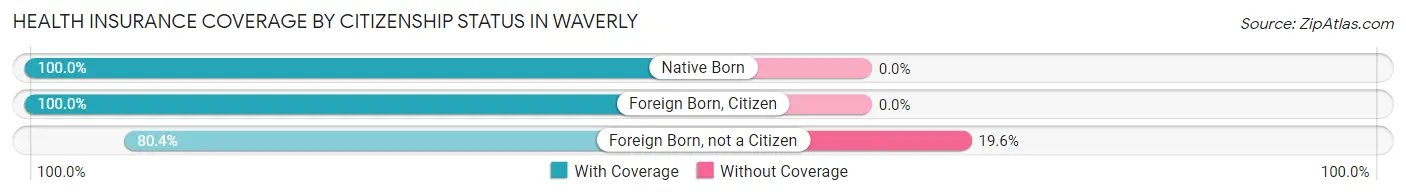
| Citizenship Status | With Coverage | Without Coverage |
| Native Born | 162 (100.0%) | 0 (0.0%) |
| Foreign Born, Citizen | 270 (100.0%) | 0 (0.0%) |
| Foreign Born, not a Citizen | 82 (80.4%) | 20 (19.6%) |
Health Insurance Coverage by Household Income in Waverly
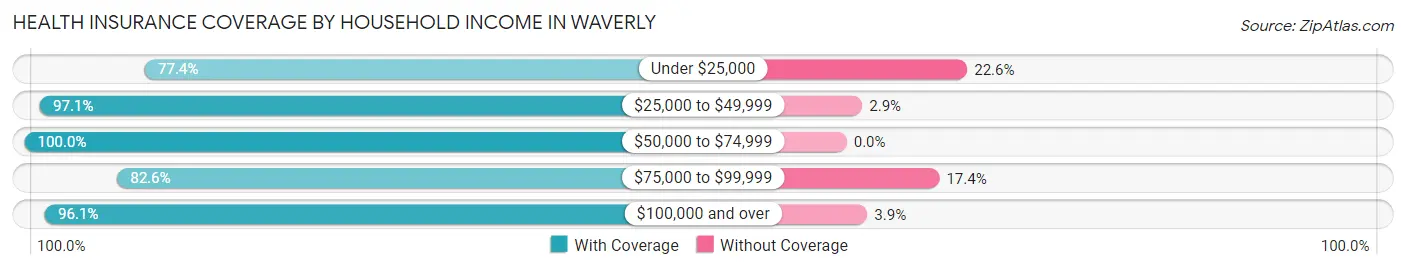
| Household Income | With Coverage | Without Coverage |
| Under $25,000 | 24 (77.4%) | 7 (22.6%) |
| $25,000 to $49,999 | 100 (97.1%) | 3 (2.9%) |
| $50,000 to $74,999 | 202 (100.0%) | 0 (0.0%) |
| $75,000 to $99,999 | 214 (82.6%) | 45 (17.4%) |
| $100,000 and over | 1,097 (96.1%) | 44 (3.9%) |
Public vs Private Health Insurance Coverage by Age in Waverly
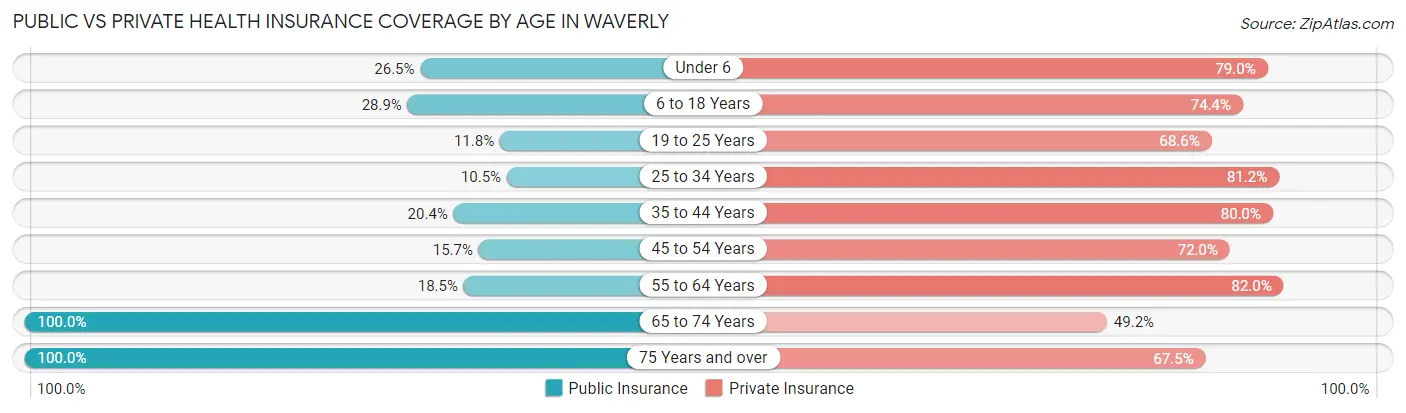
| Age Bracket | Public Insurance | Private Insurance |
| Under 6 | 43 (26.5%) | 128 (79.0%) |
| 6 to 18 Years | 78 (28.9%) | 201 (74.4%) |
| 19 to 25 Years | 12 (11.8%) | 70 (68.6%) |
| 25 to 34 Years | 40 (10.5%) | 310 (81.1%) |
| 35 to 44 Years | 57 (20.4%) | 224 (80.0%) |
| 45 to 54 Years | 46 (15.7%) | 211 (72.0%) |
| 55 to 64 Years | 39 (18.5%) | 173 (82.0%) |
| 65 to 74 Years | 63 (100.0%) | 31 (49.2%) |
| 75 Years and over | 40 (100.0%) | 27 (67.5%) |
| Total | 418 (23.2%) | 1,375 (76.3%) |
Disability Status by Sex by Age in Waverly
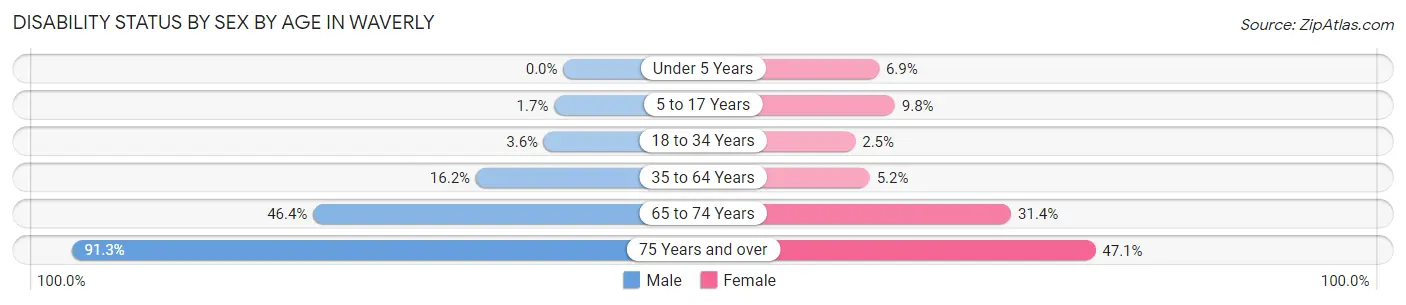
| Age Bracket | Male | Female |
| Under 5 Years | 0 (0.0%) | 4 (6.9%) |
| 5 to 17 Years | 3 (1.7%) | 12 (9.8%) |
| 18 to 34 Years | 9 (3.6%) | 6 (2.5%) |
| 35 to 64 Years | 74 (16.2%) | 17 (5.2%) |
| 65 to 74 Years | 13 (46.4%) | 11 (31.4%) |
| 75 Years and over | 21 (91.3%) | 8 (47.1%) |
Disability Class by Sex by Age in Waverly
Disability Class: Hearing Difficulty
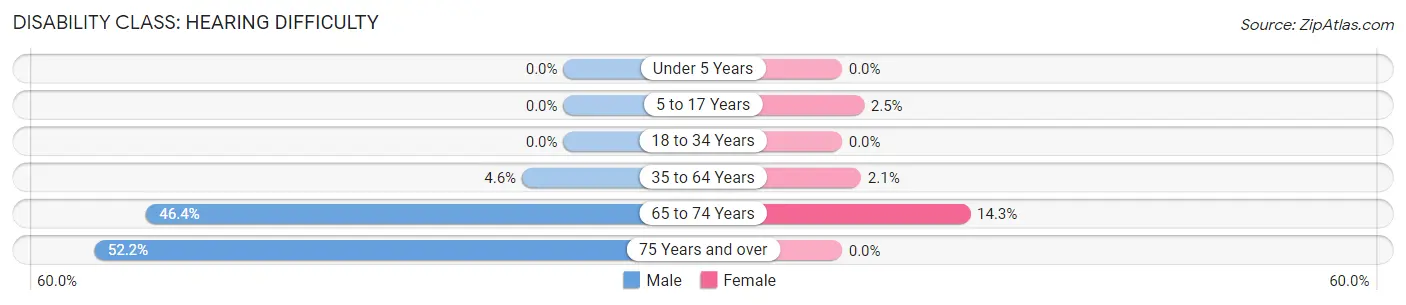
| Age Bracket | Male | Female |
| Under 5 Years | 0 (0.0%) | 0 (0.0%) |
| 5 to 17 Years | 0 (0.0%) | 3 (2.5%) |
| 18 to 34 Years | 0 (0.0%) | 0 (0.0%) |
| 35 to 64 Years | 21 (4.6%) | 7 (2.1%) |
| 65 to 74 Years | 13 (46.4%) | 5 (14.3%) |
| 75 Years and over | 12 (52.2%) | 0 (0.0%) |
Disability Class: Vision Difficulty
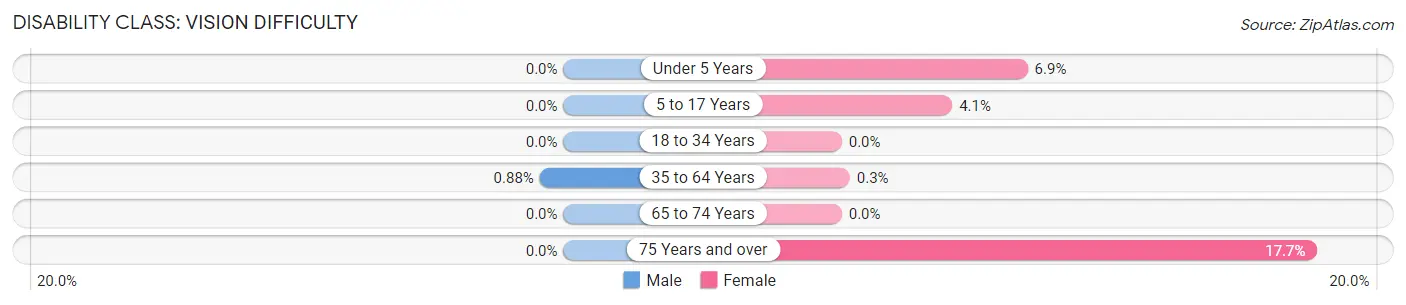
| Age Bracket | Male | Female |
| Under 5 Years | 0 (0.0%) | 4 (6.9%) |
| 5 to 17 Years | 0 (0.0%) | 5 (4.1%) |
| 18 to 34 Years | 0 (0.0%) | 0 (0.0%) |
| 35 to 64 Years | 4 (0.9%) | 1 (0.3%) |
| 65 to 74 Years | 0 (0.0%) | 0 (0.0%) |
| 75 Years and over | 0 (0.0%) | 3 (17.6%) |
Disability Class: Cognitive Difficulty
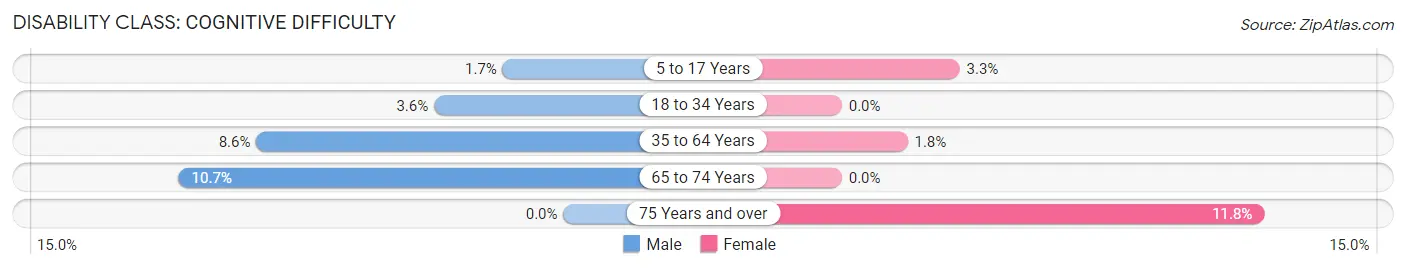
| Age Bracket | Male | Female |
| 5 to 17 Years | 3 (1.7%) | 4 (3.3%) |
| 18 to 34 Years | 9 (3.6%) | 0 (0.0%) |
| 35 to 64 Years | 39 (8.6%) | 6 (1.8%) |
| 65 to 74 Years | 3 (10.7%) | 0 (0.0%) |
| 75 Years and over | 0 (0.0%) | 2 (11.8%) |
Disability Class: Ambulatory Difficulty
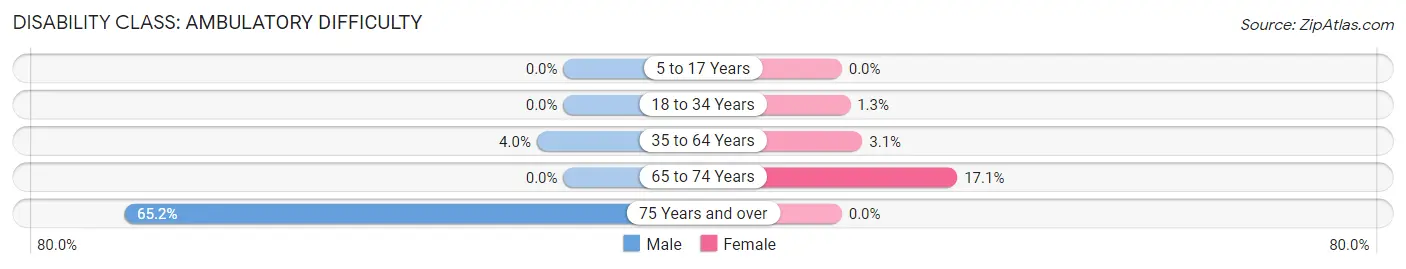
| Age Bracket | Male | Female |
| 5 to 17 Years | 0 (0.0%) | 0 (0.0%) |
| 18 to 34 Years | 0 (0.0%) | 3 (1.3%) |
| 35 to 64 Years | 18 (4.0%) | 10 (3.0%) |
| 65 to 74 Years | 0 (0.0%) | 6 (17.1%) |
| 75 Years and over | 15 (65.2%) | 0 (0.0%) |
Disability Class: Self-Care Difficulty
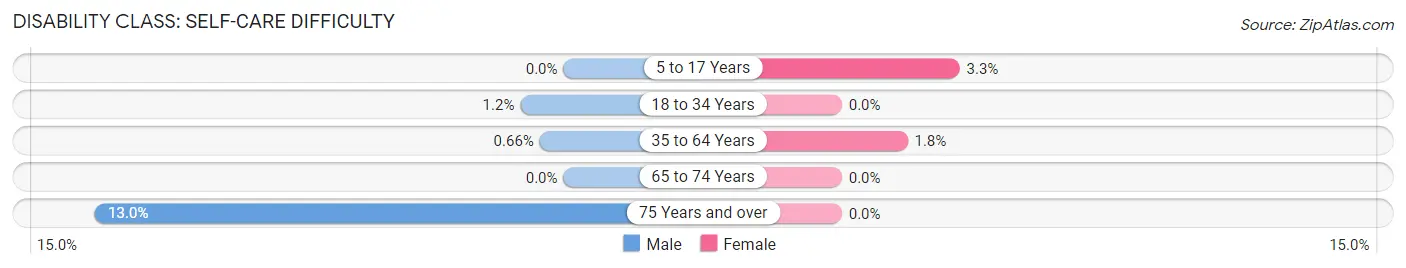
| Age Bracket | Male | Female |
| 5 to 17 Years | 0 (0.0%) | 4 (3.3%) |
| 18 to 34 Years | 3 (1.2%) | 0 (0.0%) |
| 35 to 64 Years | 3 (0.7%) | 6 (1.8%) |
| 65 to 74 Years | 0 (0.0%) | 0 (0.0%) |
| 75 Years and over | 3 (13.0%) | 0 (0.0%) |
Technology Access in Waverly
Computing Device Access in Waverly
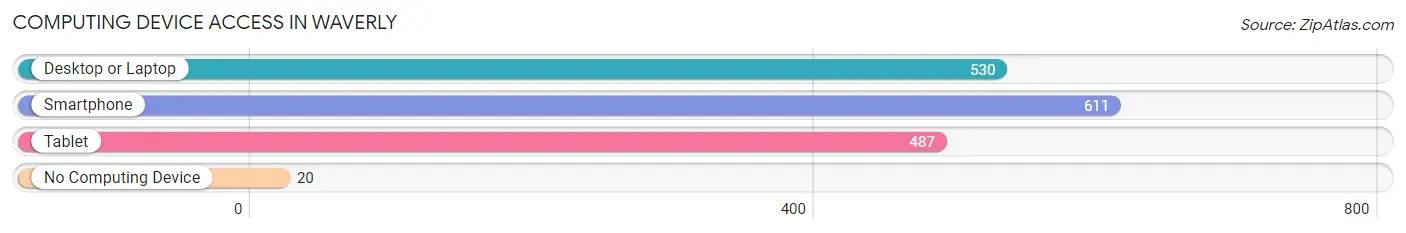
| Device Type | # Households | % Households |
| Desktop or Laptop | 530 | 81.5% |
| Smartphone | 611 | 94.0% |
| Tablet | 487 | 74.9% |
| No Computing Device | 20 | 3.1% |
| Total | 650 | 100.0% |
Internet Access in Waverly
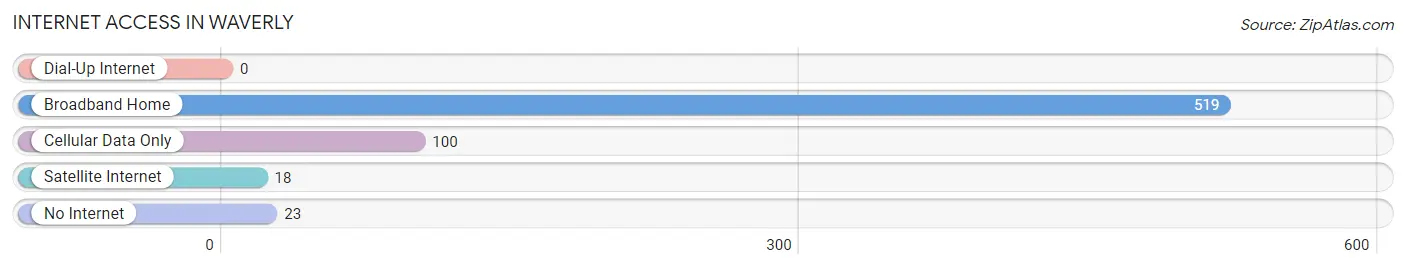
| Internet Type | # Households | % Households |
| Dial-Up Internet | 0 | 0.0% |
| Broadband Home | 519 | 79.8% |
| Cellular Data Only | 100 | 15.4% |
| Satellite Internet | 18 | 2.8% |
| No Internet | 23 | 3.5% |
| Total | 650 | 100.0% |
Waverly Summary
Waverly, Minnesota is a small city located in Wright County, in the central part of the state. It is situated on the banks of the Crow River, about 25 miles northwest of Minneapolis. The city has a population of approximately 2,500 people, and is part of the Minneapolis-St. Paul metropolitan area.
History
The area that is now Waverly was first settled in 1855 by a group of German immigrants. The town was originally called “New Germany”, but was later changed to Waverly in 1858. The name was chosen in honor of Sir Walter Scott’s novel, Waverley.
The town grew slowly, but steadily, and by the late 19th century, it had become a thriving agricultural community. The town was incorporated in 1887, and the first mayor was elected in 1888.
In the early 20th century, Waverly experienced a period of rapid growth. The population increased from 1,000 in 1900 to over 2,000 by 1920. This growth was largely due to the arrival of the railroad, which connected the town to the larger cities of Minneapolis and St. Paul.
Geography
Waverly is located in Wright County, in the central part of Minnesota. It is situated on the banks of the Crow River, about 25 miles northwest of Minneapolis. The city has a total area of 2.2 square miles, all of which is land.
The city is located in a region of rolling hills and wooded areas. The climate is typical of the Midwest, with cold winters and hot, humid summers.
Economy
The economy of Waverly is largely based on agriculture. The city is home to several large farms, which produce a variety of crops, including corn, soybeans, and wheat.
In addition to agriculture, Waverly is also home to several small businesses, including restaurants, retail stores, and service providers. The city is also home to a number of manufacturing companies, which produce a variety of products, including furniture, clothing, and electronics.
Demographics
As of the 2010 census, the population of Waverly was 2,500. The racial makeup of the city was 95.2% White, 0.8% African American, 0.4% Native American, 0.8% Asian, 0.1% Pacific Islander, and 2.7% from other races. Hispanic or Latino of any race were 2.2% of the population.
The median household income in Waverly was $50,000, and the median family income was $56,000. The per capita income was $22,000. About 8.5% of families and 10.2% of the population were below the poverty line.
Conclusion
Waverly, Minnesota is a small city located in Wright County, in the central part of the state. It is situated on the banks of the Crow River, about 25 miles northwest of Minneapolis. The city has a population of approximately 2,500 people, and is part of the Minneapolis-St. Paul metropolitan area. The economy of Waverly is largely based on agriculture, and the city is also home to several small businesses and manufacturing companies. The racial makeup of the city is predominantly White, with a small percentage of African American, Native American, Asian, and Pacific Islander residents. The median household income in Waverly is $50,000, and the per capita income is $22,000.
Common Questions
What is Per Capita Income in Waverly?
Per Capita income in Waverly is $42,055.
What is the Median Family Income in Waverly?
Median Family Income in Waverly is $108,615.
What is the Median Household income in Waverly?
Median Household Income in Waverly is $108,731.
What is Income or Wage Gap in Waverly?
Income or Wage Gap in Waverly is 16.3%.
Women in Waverly earn 83.7 cents for every dollar earned by a man.
What is Family Income Deficit in Waverly?
Family Income Deficit in Waverly is $18,745.
Families that are below poverty line in Waverly earn $18,745 less on average than the poverty threshold level.
What is Inequality or Gini Index in Waverly?
Inequality or Gini Index in Waverly is 0.29.
What is the Total Population of Waverly?
Total Population of Waverly is 1,803.
What is the Total Male Population of Waverly?
Total Male Population of Waverly is 1,003.
What is the Total Female Population of Waverly?
Total Female Population of Waverly is 800.
What is the Ratio of Males per 100 Females in Waverly?
There are 125.38 Males per 100 Females in Waverly.
What is the Ratio of Females per 100 Males in Waverly?
There are 79.76 Females per 100 Males in Waverly.
What is the Median Population Age in Waverly?
Median Population Age in Waverly is 34.4 Years.
What is the Average Family Size in Waverly
Average Family Size in Waverly is 2.9 People.
What is the Average Household Size in Waverly
Average Household Size in Waverly is 2.7 People.
How Large is the Labor Force in Waverly?
There are 1,050 People in the Labor Forcein in Waverly.
What is the Percentage of People in the Labor Force in Waverly?
75.3% of People are in the Labor Force in Waverly.
What is the Unemployment Rate in Waverly?
Unemployment Rate in Waverly is 0.4%.