Excelsior, MN Map & Demographics
Excelsior Map
Excelsior Overview
$73,823
PER CAPITA INCOME
$117,314
AVG FAMILY INCOME
$92,148
AVG HOUSEHOLD INCOME
19.9%
WAGE / INCOME GAP [ % ]
80.1¢/ $1
WAGE / INCOME GAP [ $ ]
0.53
INEQUALITY / GINI INDEX
2,257
TOTAL POPULATION
1,192
MALE POPULATION
1,065
FEMALE POPULATION
111.92
MALES / 100 FEMALES
89.35
FEMALES / 100 MALES
41.2
MEDIAN AGE
2.6
AVG FAMILY SIZE
2.1
AVG HOUSEHOLD SIZE
1,503
LABOR FORCE [ PEOPLE ]
80.1%
PERCENT IN LABOR FORCE
1.0%
UNEMPLOYMENT RATE
Excelsior Zip Codes
Income in Excelsior
Income Overview in Excelsior
Per Capita Income in Excelsior is $73,823, while median incomes of families and households are $117,314 and $92,148 respectively.
| Characteristic | Number | Measure |
| Per Capita Income | 2,257 | $73,823 |
| Median Family Income | 565 | $117,314 |
| Mean Family Income | 565 | $195,409 |
| Median Household Income | 1,059 | $92,148 |
| Mean Household Income | 1,059 | $153,254 |
| Income Deficit | 565 | $0 |
| Wage / Income Gap (%) | 2,257 | 19.95% |
| Wage / Income Gap ($) | 2,257 | 80.05¢ per $1 |
| Gini / Inequality Index | 2,257 | 0.53 |
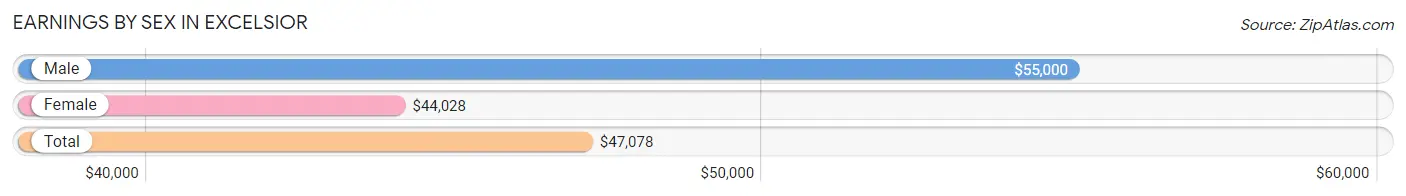
Earnings by Sex in Excelsior
Average Earnings in Excelsior are $47,078, $55,000 for men and $44,028 for women, a difference of 20.0%.
| Sex | Number | Average Earnings |
| Male | 904 (59.4%) | $55,000 |
| Female | 619 (40.6%) | $44,028 |
| Total | 1,523 (100.0%) | $47,078 |
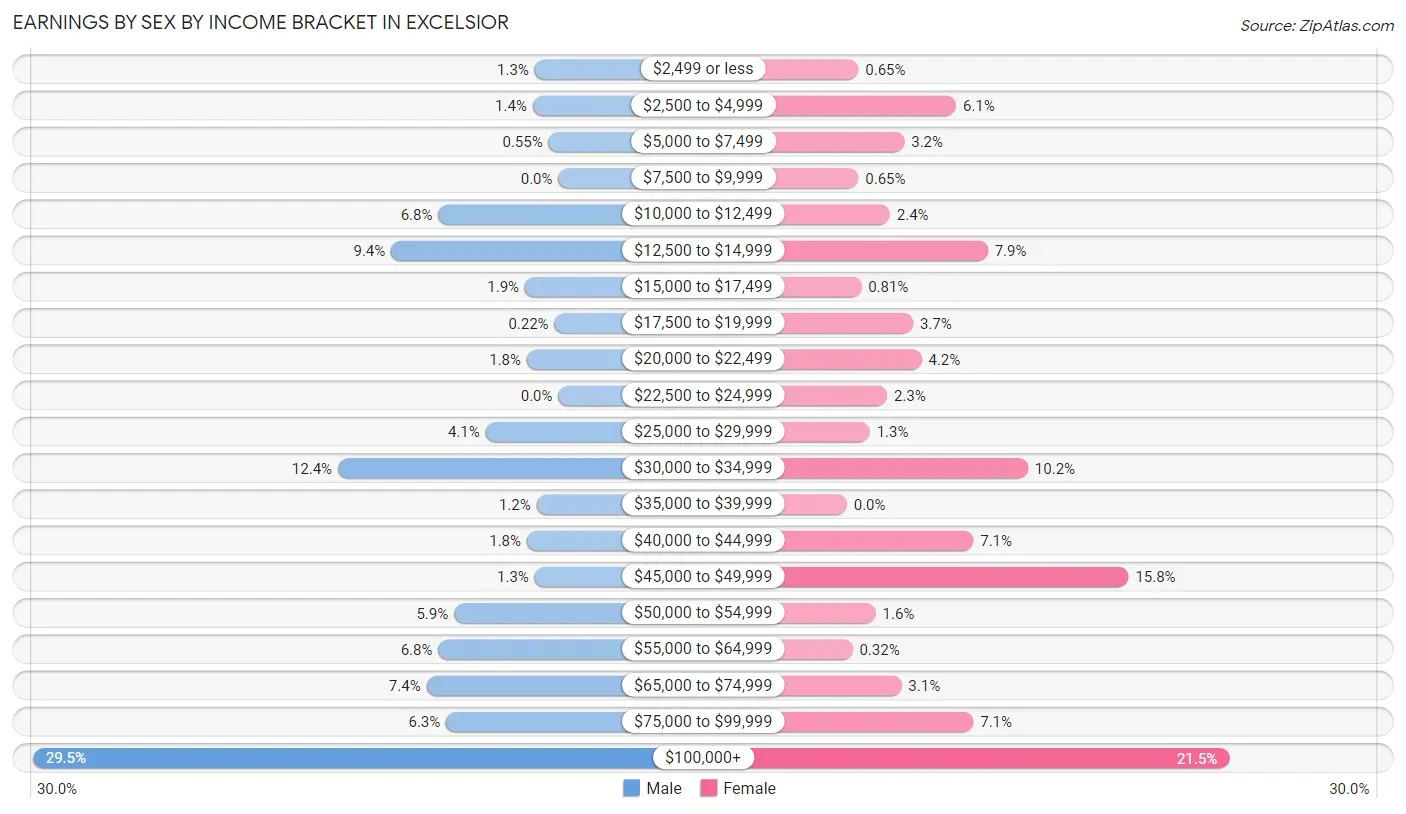
Earnings by Sex by Income Bracket in Excelsior
The most common earnings brackets in Excelsior are $100,000+ for men (267 | 29.5%) and $100,000+ for women (133 | 21.5%).
| Income | Male | Female |
| $2,499 or less | 12 (1.3%) | 4 (0.6%) |
| $2,500 to $4,999 | 13 (1.4%) | 38 (6.1%) |
| $5,000 to $7,499 | 5 (0.5%) | 20 (3.2%) |
| $7,500 to $9,999 | 0 (0.0%) | 4 (0.6%) |
| $10,000 to $12,499 | 61 (6.8%) | 15 (2.4%) |
| $12,500 to $14,999 | 85 (9.4%) | 49 (7.9%) |
| $15,000 to $17,499 | 17 (1.9%) | 5 (0.8%) |
| $17,500 to $19,999 | 2 (0.2%) | 23 (3.7%) |
| $20,000 to $22,499 | 16 (1.8%) | 26 (4.2%) |
| $22,500 to $24,999 | 0 (0.0%) | 14 (2.3%) |
| $25,000 to $29,999 | 37 (4.1%) | 8 (1.3%) |
| $30,000 to $34,999 | 112 (12.4%) | 63 (10.2%) |
| $35,000 to $39,999 | 11 (1.2%) | 0 (0.0%) |
| $40,000 to $44,999 | 16 (1.8%) | 44 (7.1%) |
| $45,000 to $49,999 | 12 (1.3%) | 98 (15.8%) |
| $50,000 to $54,999 | 53 (5.9%) | 10 (1.6%) |
| $55,000 to $64,999 | 61 (6.8%) | 2 (0.3%) |
| $65,000 to $74,999 | 67 (7.4%) | 19 (3.1%) |
| $75,000 to $99,999 | 57 (6.3%) | 44 (7.1%) |
| $100,000+ | 267 (29.5%) | 133 (21.5%) |
| Total | 904 (100.0%) | 619 (100.0%) |
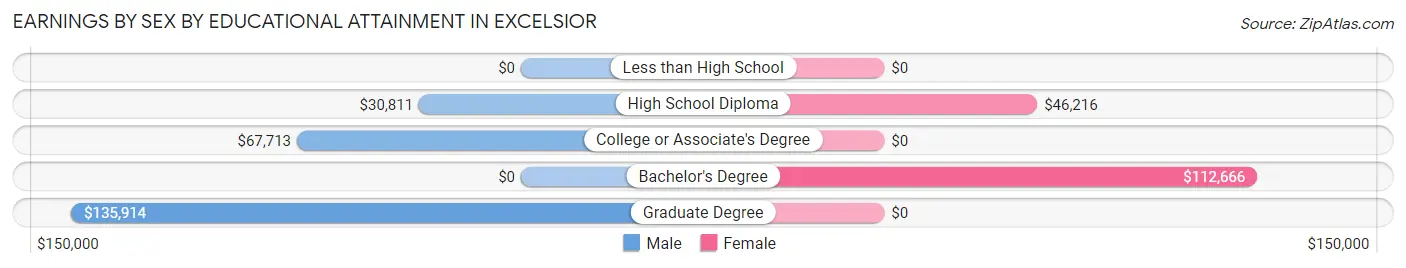
Earnings by Sex by Educational Attainment in Excelsior
Average earnings in Excelsior are $67,580 for men and $45,541 for women, a difference of 32.6%. Men with an educational attainment of graduate degree enjoy the highest average annual earnings of $135,914, while those with high school diploma education earn the least with $30,811. Women with an educational attainment of bachelor's degree earn the most with the average annual earnings of $112,666, while those with high school diploma education have the smallest earnings of $46,216.
| Educational Attainment | Male Income | Female Income |
| Less than High School | - | - |
| High School Diploma | $30,811 | $46,216 |
| College or Associate's Degree | $67,713 | $0 |
| Bachelor's Degree | - | - |
| Graduate Degree | $135,914 | $0 |
| Total | $67,580 | $45,541 |
Family Income in Excelsior
Family Income Brackets in Excelsior
According to the Excelsior family income data, there are 167 families falling into the $200,000+ income range, which is the most common income bracket and makes up 29.6% of all families.
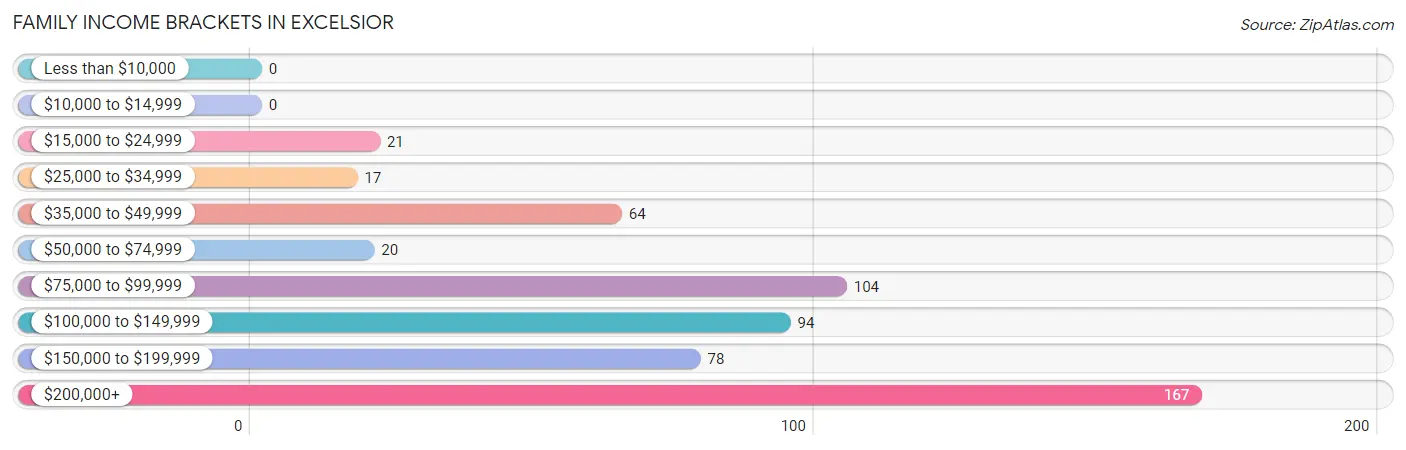
| Income Bracket | # Families | % Families |
| Less than $10,000 | 0 | 0.0% |
| $10,000 to $14,999 | 0 | 0.0% |
| $15,000 to $24,999 | 21 | 3.7% |
| $25,000 to $34,999 | 17 | 3.0% |
| $35,000 to $49,999 | 64 | 11.3% |
| $50,000 to $74,999 | 20 | 3.5% |
| $75,000 to $99,999 | 104 | 18.4% |
| $100,000 to $149,999 | 94 | 16.6% |
| $150,000 to $199,999 | 78 | 13.8% |
| $200,000+ | 167 | 29.6% |
Family Income by Famaliy Size in Excelsior
3-person families (129 | 22.8%) account for the highest median family income in Excelsior with $179,750 per family, while 3-person families (129 | 22.8%) have the highest median income of $59,917 per family member.
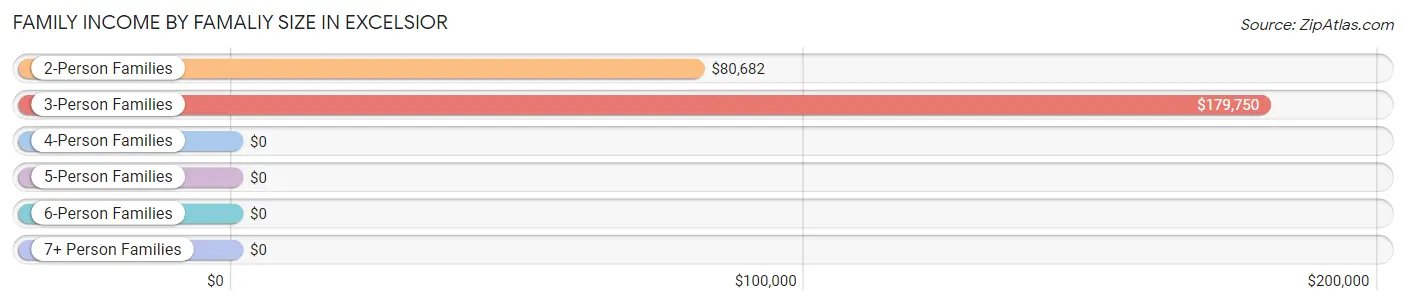
| Income Bracket | # Families | Median Income |
| 2-Person Families | 328 (58.1%) | $80,682 |
| 3-Person Families | 129 (22.8%) | $179,750 |
| 4-Person Families | 76 (13.5%) | $0 |
| 5-Person Families | 28 (5.0%) | $0 |
| 6-Person Families | 4 (0.7%) | $0 |
| 7+ Person Families | 0 (0.0%) | $0 |
| Total | 565 (100.0%) | $117,314 |
Family Income by Number of Earners in Excelsior
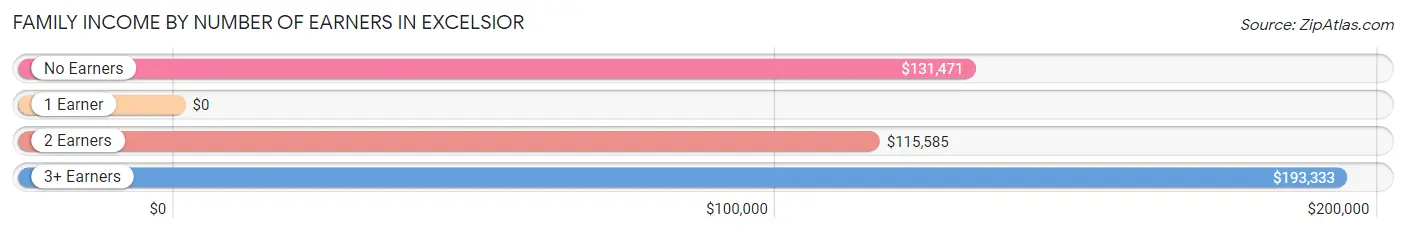
| Number of Earners | # Families | Median Income |
| No Earners | 28 (5.0%) | $131,471 |
| 1 Earner | 163 (28.8%) | $0 |
| 2 Earners | 336 (59.5%) | $115,585 |
| 3+ Earners | 38 (6.7%) | $193,333 |
| Total | 565 (100.0%) | $117,314 |
Household Income in Excelsior
Household Income Brackets in Excelsior
With 257 households falling in the category, the $200,000+ income range is the most frequent in Excelsior, accounting for 24.3% of all households. In contrast, only 31 households (2.9%) fall into the less than $10,000 income bracket, making it the least populous group.
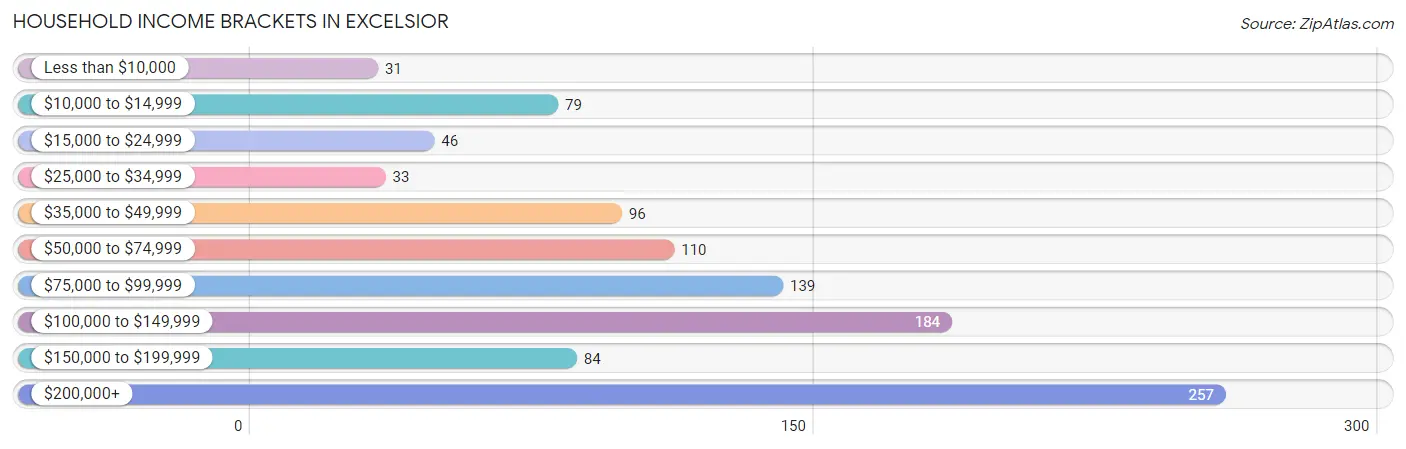
| Income Bracket | # Households | % Households |
| Less than $10,000 | 31 | 2.9% |
| $10,000 to $14,999 | 79 | 7.5% |
| $15,000 to $24,999 | 46 | 4.3% |
| $25,000 to $34,999 | 33 | 3.1% |
| $35,000 to $49,999 | 96 | 9.1% |
| $50,000 to $74,999 | 110 | 10.4% |
| $75,000 to $99,999 | 139 | 13.1% |
| $100,000 to $149,999 | 184 | 17.4% |
| $150,000 to $199,999 | 84 | 7.9% |
| $200,000+ | 257 | 24.3% |
Household Income by Householder Age in Excelsior
The median household income in Excelsior is $92,148, with the highest median household income of $130,368 found in the 65+ years age bracket for the primary householder. A total of 231 households (21.8%) fall into this category. Meanwhile, the 15 to 24 years age bracket for the primary householder has the lowest median household income of $13,785, with 47 households (4.4%) in this group.
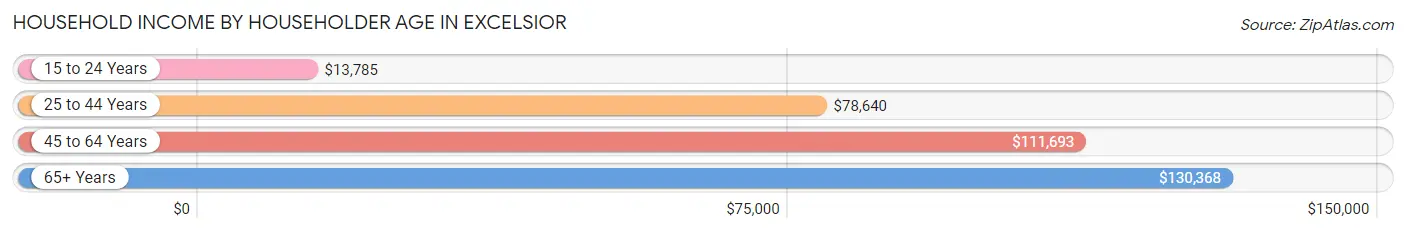
| Income Bracket | # Households | Median Income |
| 15 to 24 Years | 47 (4.4%) | $13,785 |
| 25 to 44 Years | 410 (38.7%) | $78,640 |
| 45 to 64 Years | 371 (35.0%) | $111,693 |
| 65+ Years | 231 (21.8%) | $130,368 |
| Total | 1,059 (100.0%) | $92,148 |
Poverty in Excelsior
Income Below Poverty by Sex and Age in Excelsior
With 5.2% poverty level for males and 11.8% for females among the residents of Excelsior, 75 year old and over males and 18 to 24 year old females are the most vulnerable to poverty, with 14 males (27.5%) and 20 females (51.3%) in their respective age groups living below the poverty level.
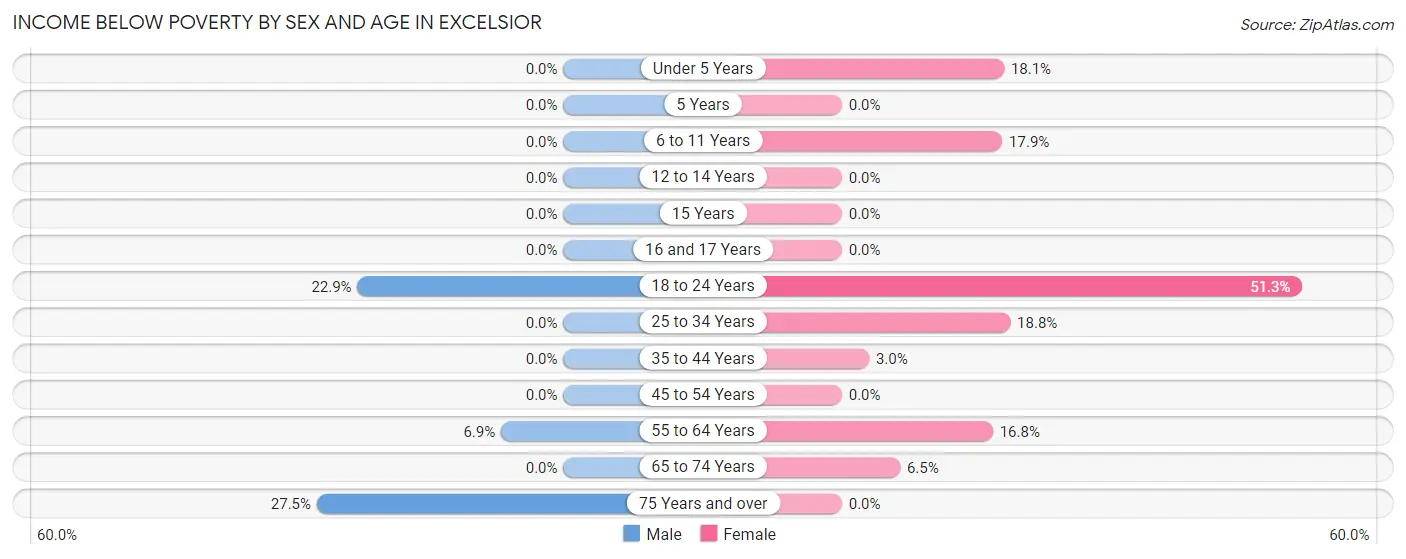
| Age Bracket | Male | Female |
| Under 5 Years | 0 (0.0%) | 13 (18.1%) |
| 5 Years | 0 (0.0%) | 0 (0.0%) |
| 6 to 11 Years | 0 (0.0%) | 5 (17.9%) |
| 12 to 14 Years | 0 (0.0%) | 0 (0.0%) |
| 15 Years | 0 (0.0%) | 0 (0.0%) |
| 16 and 17 Years | 0 (0.0%) | 0 (0.0%) |
| 18 to 24 Years | 36 (22.9%) | 20 (51.3%) |
| 25 to 34 Years | 0 (0.0%) | 33 (18.8%) |
| 35 to 44 Years | 0 (0.0%) | 5 (3.0%) |
| 45 to 54 Years | 0 (0.0%) | 0 (0.0%) |
| 55 to 64 Years | 10 (6.9%) | 38 (16.8%) |
| 65 to 74 Years | 0 (0.0%) | 7 (6.5%) |
| 75 Years and over | 14 (27.5%) | 0 (0.0%) |
| Total | 60 (5.2%) | 121 (11.8%) |
Income Above Poverty by Sex and Age in Excelsior
According to the poverty statistics in Excelsior, males aged under 5 years and females aged 5 years are the age groups that are most secure financially, with 100.0% of males and 100.0% of females in these age groups living above the poverty line.
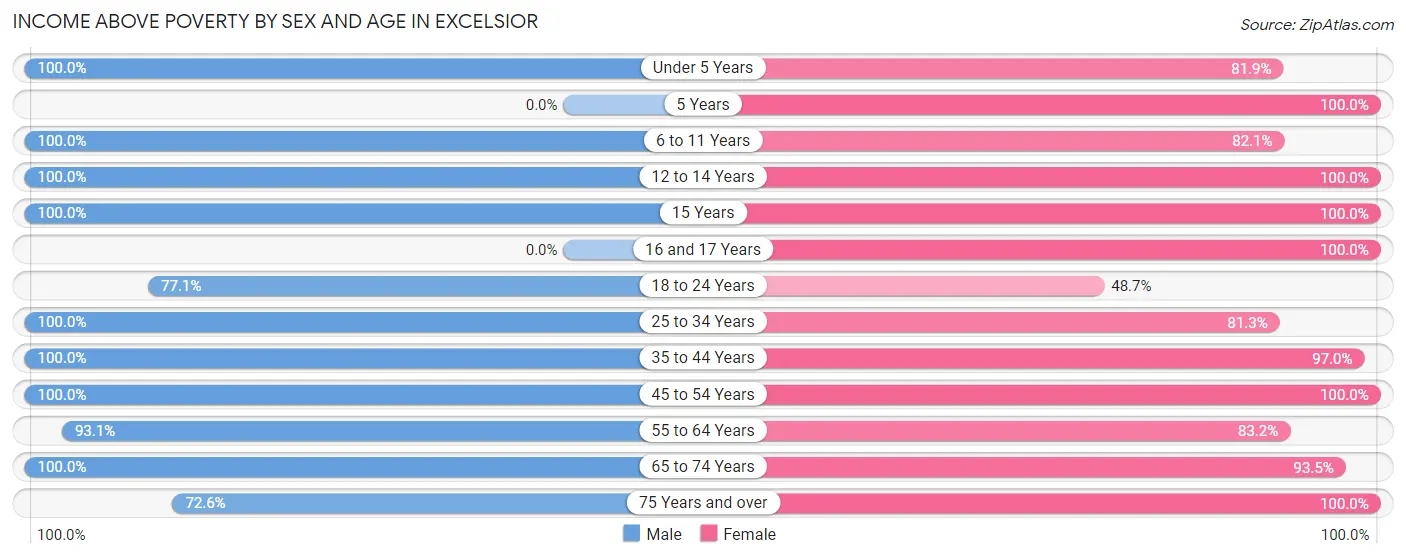
| Age Bracket | Male | Female |
| Under 5 Years | 31 (100.0%) | 59 (81.9%) |
| 5 Years | 0 (0.0%) | 4 (100.0%) |
| 6 to 11 Years | 105 (100.0%) | 23 (82.1%) |
| 12 to 14 Years | 23 (100.0%) | 81 (100.0%) |
| 15 Years | 21 (100.0%) | 15 (100.0%) |
| 16 and 17 Years | 0 (0.0%) | 4 (100.0%) |
| 18 to 24 Years | 121 (77.1%) | 19 (48.7%) |
| 25 to 34 Years | 158 (100.0%) | 143 (81.2%) |
| 35 to 44 Years | 185 (100.0%) | 160 (97.0%) |
| 45 to 54 Years | 124 (100.0%) | 54 (100.0%) |
| 55 to 64 Years | 134 (93.1%) | 188 (83.2%) |
| 65 to 74 Years | 160 (100.0%) | 101 (93.5%) |
| 75 Years and over | 37 (72.6%) | 55 (100.0%) |
| Total | 1,099 (94.8%) | 906 (88.2%) |
Income Below Poverty Among Married-Couple Families in Excelsior
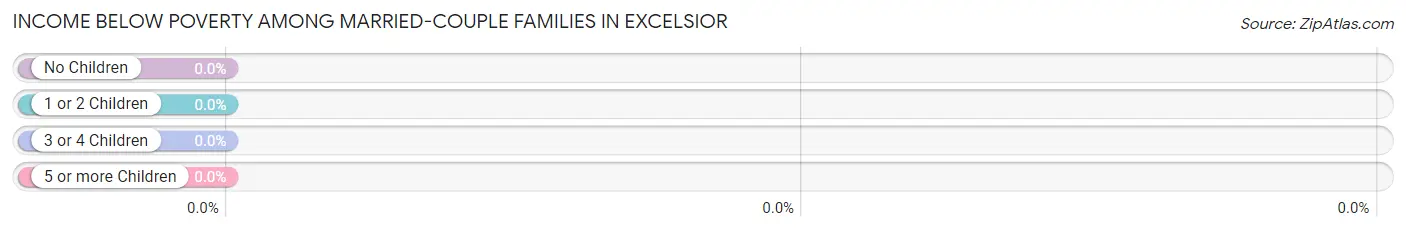
| Children | Above Poverty | Below Poverty |
| No Children | 250 (100.0%) | 0 (0.0%) |
| 1 or 2 Children | 145 (100.0%) | 0 (0.0%) |
| 3 or 4 Children | 32 (100.0%) | 0 (0.0%) |
| 5 or more Children | 0 (0.0%) | 0 (0.0%) |
| Total | 427 (100.0%) | 0 (0.0%) |
Income Below Poverty Among Single-Parent Households in Excelsior
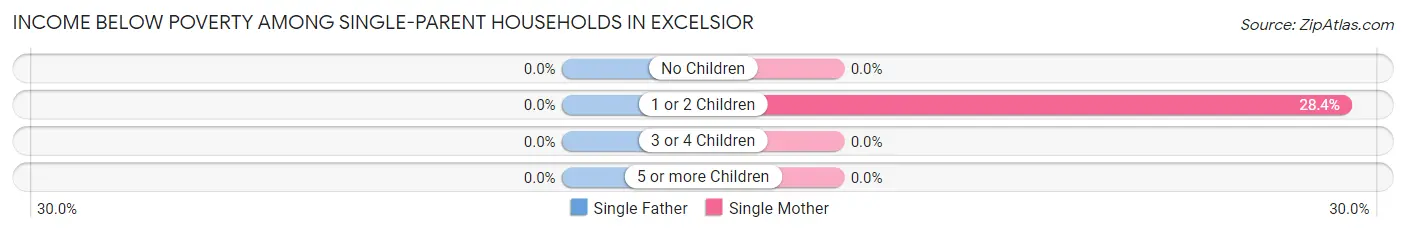
| Children | Single Father | Single Mother |
| No Children | 0 (0.0%) | 0 (0.0%) |
| 1 or 2 Children | 0 (0.0%) | 21 (28.4%) |
| 3 or 4 Children | 0 (0.0%) | 0 (0.0%) |
| 5 or more Children | 0 (0.0%) | 0 (0.0%) |
| Total | 0 (0.0%) | 21 (22.3%) |
Income Below Poverty Among Married-Couple vs Single-Parent Households in Excelsior
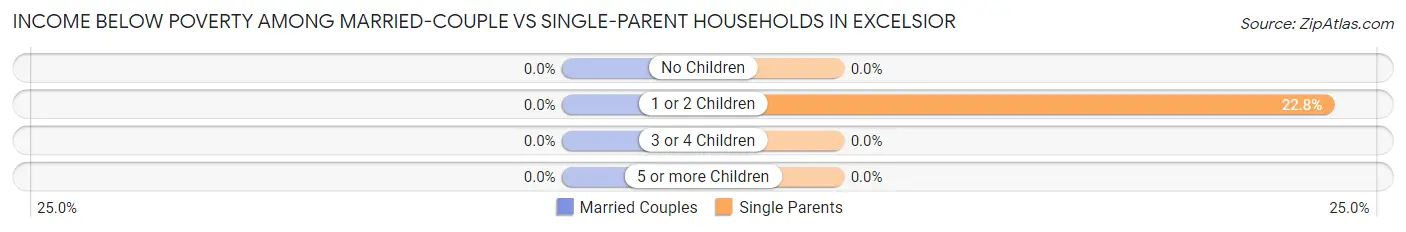
| Children | Married-Couple Families | Single-Parent Households |
| No Children | 0 (0.0%) | 0 (0.0%) |
| 1 or 2 Children | 0 (0.0%) | 21 (22.8%) |
| 3 or 4 Children | 0 (0.0%) | 0 (0.0%) |
| 5 or more Children | 0 (0.0%) | 0 (0.0%) |
| Total | 0 (0.0%) | 21 (15.2%) |
Race in Excelsior
The most populous races in Excelsior are White / Caucasian (2,191 | 97.1%), Hispanic or Latino (103 | 4.6%), and Two or more Races (51 | 2.3%).
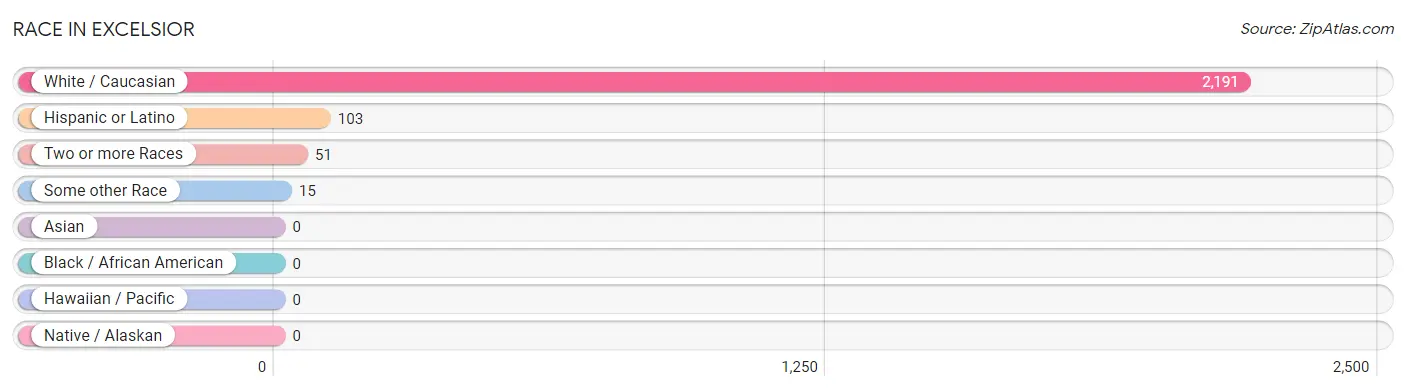
| Race | # Population | % Population |
| Asian | 0 | 0.0% |
| Black / African American | 0 | 0.0% |
| Hawaiian / Pacific | 0 | 0.0% |
| Hispanic or Latino | 103 | 4.6% |
| Native / Alaskan | 0 | 0.0% |
| White / Caucasian | 2,191 | 97.1% |
| Two or more Races | 51 | 2.3% |
| Some other Race | 15 | 0.7% |
| Total | 2,257 | 100.0% |
Ancestry in Excelsior
The most populous ancestries reported in Excelsior are Irish (499 | 22.1%), German (496 | 22.0%), Norwegian (299 | 13.3%), French (211 | 9.3%), and English (194 | 8.6%), together accounting for 75.3% of all Excelsior residents.
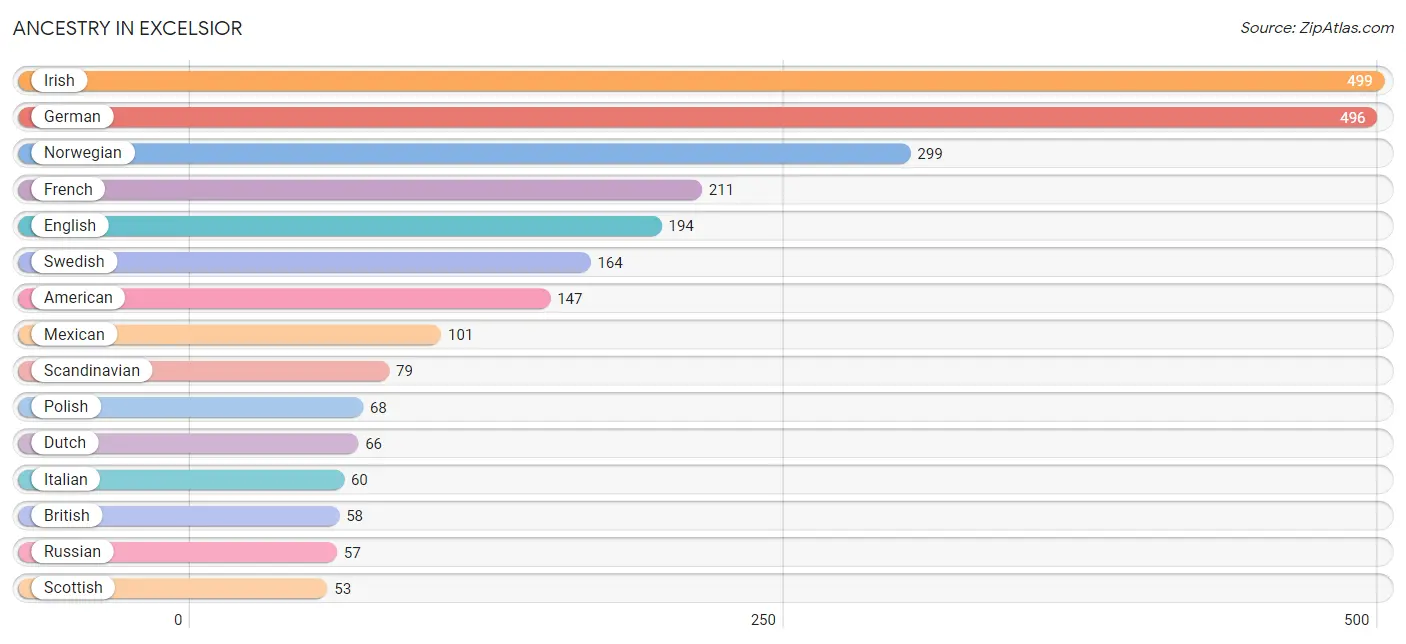
| Ancestry | # Population | % Population |
| American | 147 | 6.5% |
| British | 58 | 2.6% |
| Czech | 17 | 0.7% |
| Czechoslovakian | 18 | 0.8% |
| Danish | 47 | 2.1% |
| Dutch | 66 | 2.9% |
| English | 194 | 8.6% |
| European | 38 | 1.7% |
| Finnish | 16 | 0.7% |
| French | 211 | 9.3% |
| French Canadian | 36 | 1.6% |
| German | 496 | 22.0% |
| Greek | 15 | 0.7% |
| Irish | 499 | 22.1% |
| Italian | 60 | 2.7% |
| Korean | 20 | 0.9% |
| Mexican | 101 | 4.5% |
| Native Hawaiian | 14 | 0.6% |
| Norwegian | 299 | 13.3% |
| Peruvian | 2 | 0.1% |
| Polish | 68 | 3.0% |
| Romanian | 13 | 0.6% |
| Russian | 57 | 2.5% |
| Scandinavian | 79 | 3.5% |
| Scotch-Irish | 10 | 0.4% |
| Scottish | 53 | 2.4% |
| Slovene | 8 | 0.4% |
| South American | 2 | 0.1% |
| Swedish | 164 | 7.3% |
| Welsh | 31 | 1.4% | View All 30 Rows |
Immigrants in Excelsior
The most numerous immigrant groups reported in Excelsior came from Central America (92 | 4.1%), Latin America (92 | 4.1%), Mexico (92 | 4.1%), Eastern Europe (13 | 0.6%), and Europe (13 | 0.6%), together accounting for 13.4% of all Excelsior residents.
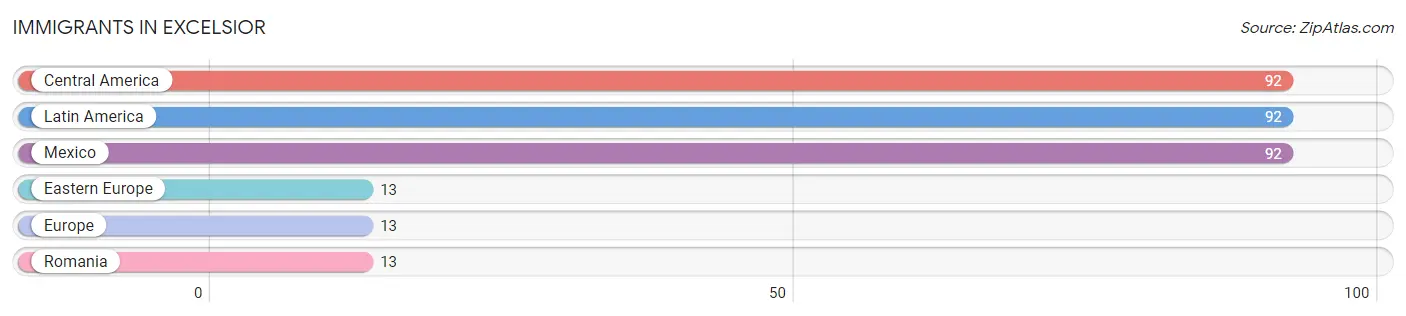
| Immigration Origin | # Population | % Population |
| Central America | 92 | 4.1% |
| Eastern Europe | 13 | 0.6% |
| Europe | 13 | 0.6% |
| Latin America | 92 | 4.1% |
| Mexico | 92 | 4.1% |
| Romania | 13 | 0.6% | View All 6 Rows |
Sex and Age in Excelsior
Sex and Age in Excelsior
The most populous age groups in Excelsior are 60 to 64 Years (116 | 9.7%) for men and 55 to 59 Years (127 | 11.9%) for women.
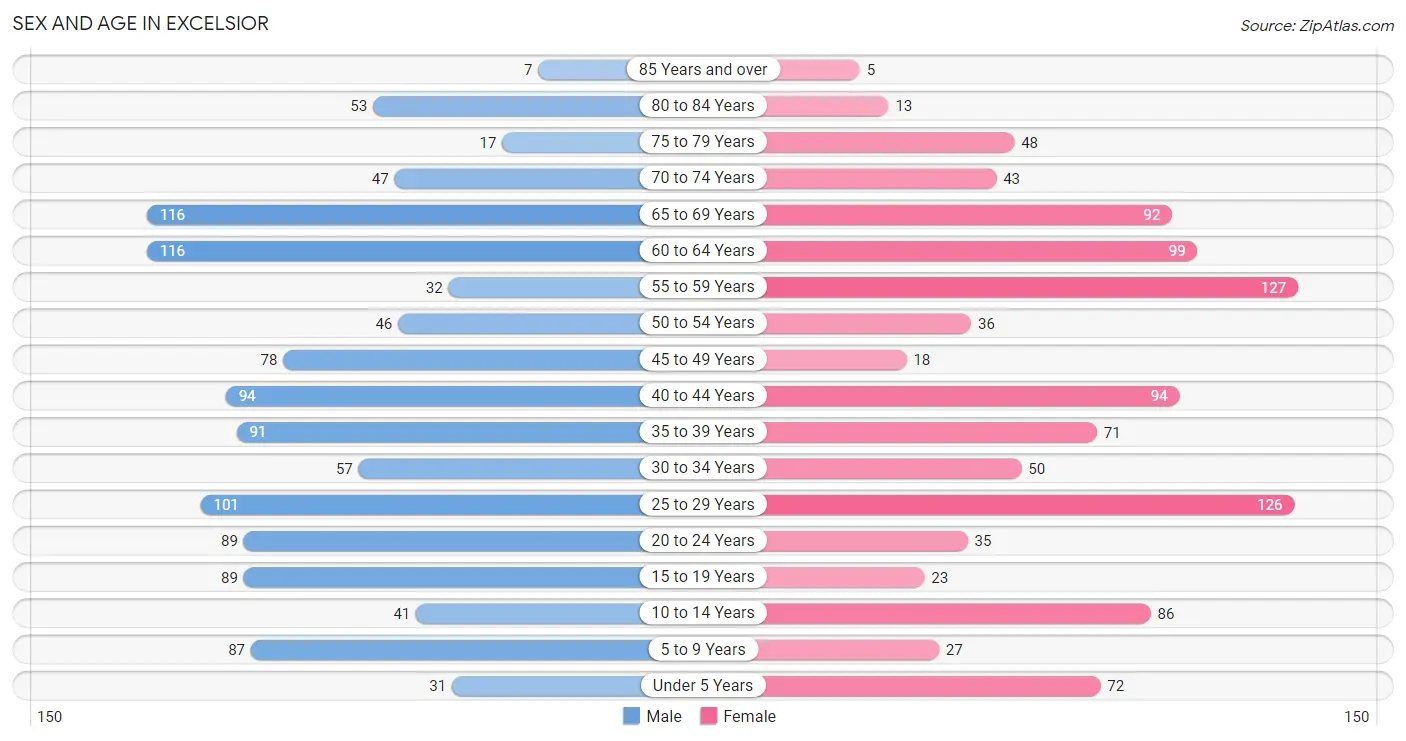
| Age Bracket | Male | Female |
| Under 5 Years | 31 (2.6%) | 72 (6.8%) |
| 5 to 9 Years | 87 (7.3%) | 27 (2.5%) |
| 10 to 14 Years | 41 (3.4%) | 86 (8.1%) |
| 15 to 19 Years | 89 (7.5%) | 23 (2.2%) |
| 20 to 24 Years | 89 (7.5%) | 35 (3.3%) |
| 25 to 29 Years | 101 (8.5%) | 126 (11.8%) |
| 30 to 34 Years | 57 (4.8%) | 50 (4.7%) |
| 35 to 39 Years | 91 (7.6%) | 71 (6.7%) |
| 40 to 44 Years | 94 (7.9%) | 94 (8.8%) |
| 45 to 49 Years | 78 (6.5%) | 18 (1.7%) |
| 50 to 54 Years | 46 (3.9%) | 36 (3.4%) |
| 55 to 59 Years | 32 (2.7%) | 127 (11.9%) |
| 60 to 64 Years | 116 (9.7%) | 99 (9.3%) |
| 65 to 69 Years | 116 (9.7%) | 92 (8.6%) |
| 70 to 74 Years | 47 (3.9%) | 43 (4.0%) |
| 75 to 79 Years | 17 (1.4%) | 48 (4.5%) |
| 80 to 84 Years | 53 (4.4%) | 13 (1.2%) |
| 85 Years and over | 7 (0.6%) | 5 (0.5%) |
| Total | 1,192 (100.0%) | 1,065 (100.0%) |
Families and Households in Excelsior
Median Family Size in Excelsior
The median family size in Excelsior is 2.65 persons per family, with married-couple families (427 | 75.6%) accounting for the largest median family size of 2.74 persons per family. On the other hand, single female/mother families (94 | 16.6%) represent the smallest median family size with 2.28 persons per family.
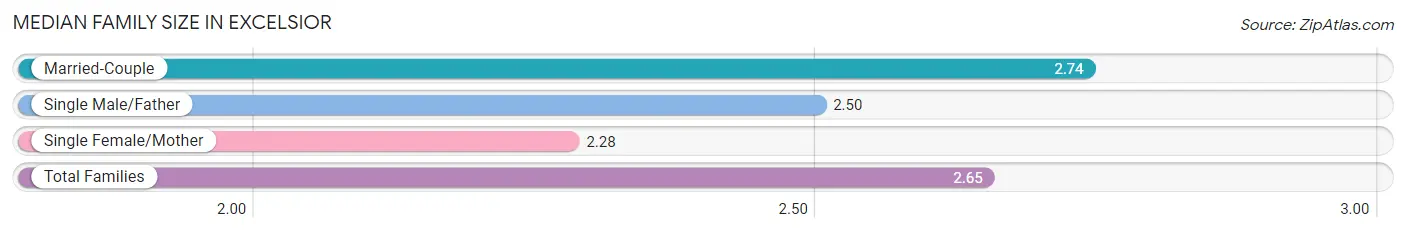
| Family Type | # Families | Family Size |
| Married-Couple | 427 (75.6%) | 2.74 |
| Single Male/Father | 44 (7.8%) | 2.50 |
| Single Female/Mother | 94 (16.6%) | 2.28 |
| Total Families | 565 (100.0%) | 2.65 |
Median Household Size in Excelsior
The median household size in Excelsior is 2.06 persons per household, with single female/mother households (94 | 8.9%) accounting for the largest median household size of 2.9 persons per household. non-family households (494 | 46.7%) represent the smallest median household size with 1.28 persons per household.
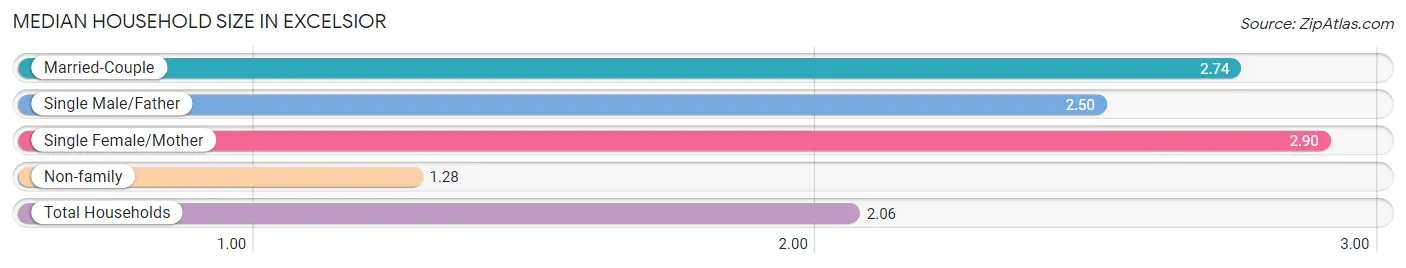
| Household Type | # Households | Household Size |
| Married-Couple | 427 (40.3%) | 2.74 |
| Single Male/Father | 44 (4.2%) | 2.50 |
| Single Female/Mother | 94 (8.9%) | 2.90 |
| Non-family | 494 (46.7%) | 1.28 |
| Total Households | 1,059 (100.0%) | 2.06 |
Household Size by Marriage Status in Excelsior
Out of a total of 1,059 households in Excelsior, 565 (53.3%) are family households, while 494 (46.7%) are nonfamily households. The most numerous type of family households are 2-person households, comprising 275, and the most common type of nonfamily households are 1-person households, comprising 387.
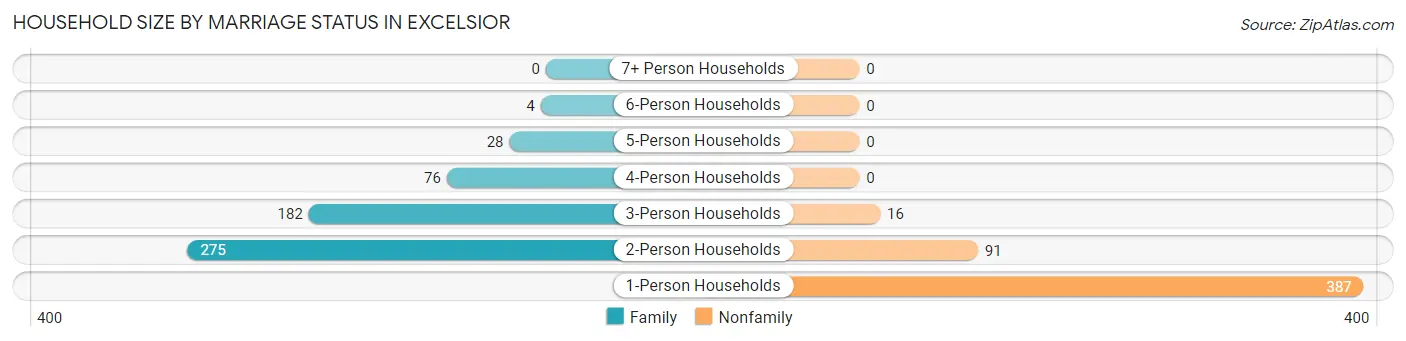
| Household Size | Family Households | Nonfamily Households |
| 1-Person Households | - | 387 (36.5%) |
| 2-Person Households | 275 (26.0%) | 91 (8.6%) |
| 3-Person Households | 182 (17.2%) | 16 (1.5%) |
| 4-Person Households | 76 (7.2%) | 0 (0.0%) |
| 5-Person Households | 28 (2.6%) | 0 (0.0%) |
| 6-Person Households | 4 (0.4%) | 0 (0.0%) |
| 7+ Person Households | 0 (0.0%) | 0 (0.0%) |
| Total | 565 (53.3%) | 494 (46.7%) |
Female Fertility in Excelsior
Fertility by Age in Excelsior
Average fertility rate in Excelsior is 89.0 births per 1,000 women. Women in the age bracket of 20 to 34 years have the highest fertility rate with 114.0 births per 1,000 women. Women in the age bracket of 20 to 34 years acount for 64.9% of all women with births.
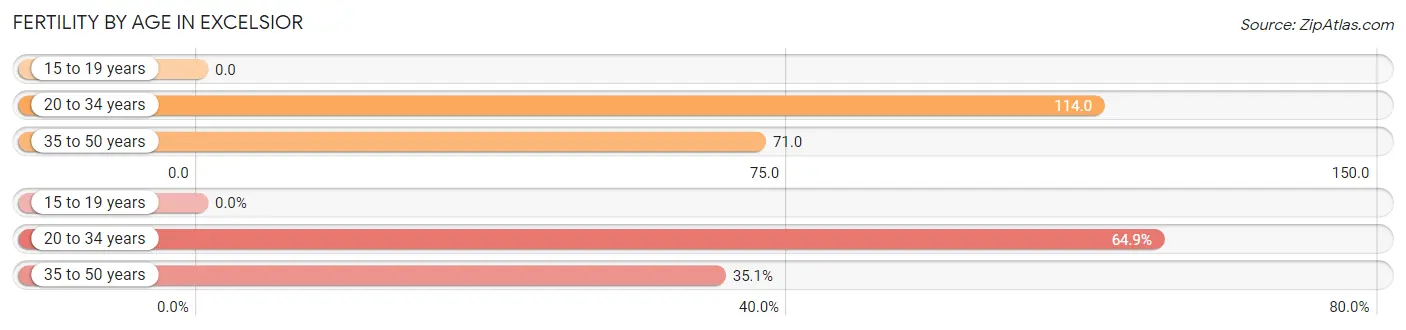
| Age Bracket | Women with Births | Births / 1,000 Women |
| 15 to 19 years | 0 (0.0%) | 0.0 |
| 20 to 34 years | 24 (64.9%) | 114.0 |
| 35 to 50 years | 13 (35.1%) | 71.0 |
| Total | 37 (100.0%) | 89.0 |
Fertility by Age by Marriage Status in Excelsior
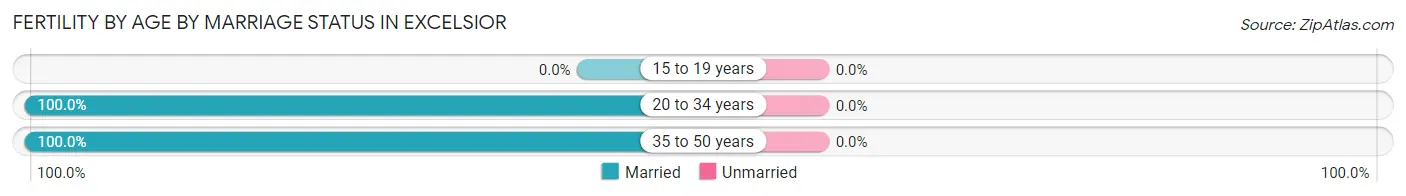
| Age Bracket | Married | Unmarried |
| 15 to 19 years | 0 (0.0%) | 0 (0.0%) |
| 20 to 34 years | 24 (100.0%) | 0 (0.0%) |
| 35 to 50 years | 13 (100.0%) | 0 (0.0%) |
| Total | 37 (100.0%) | 0 (0.0%) |
Fertility by Education in Excelsior
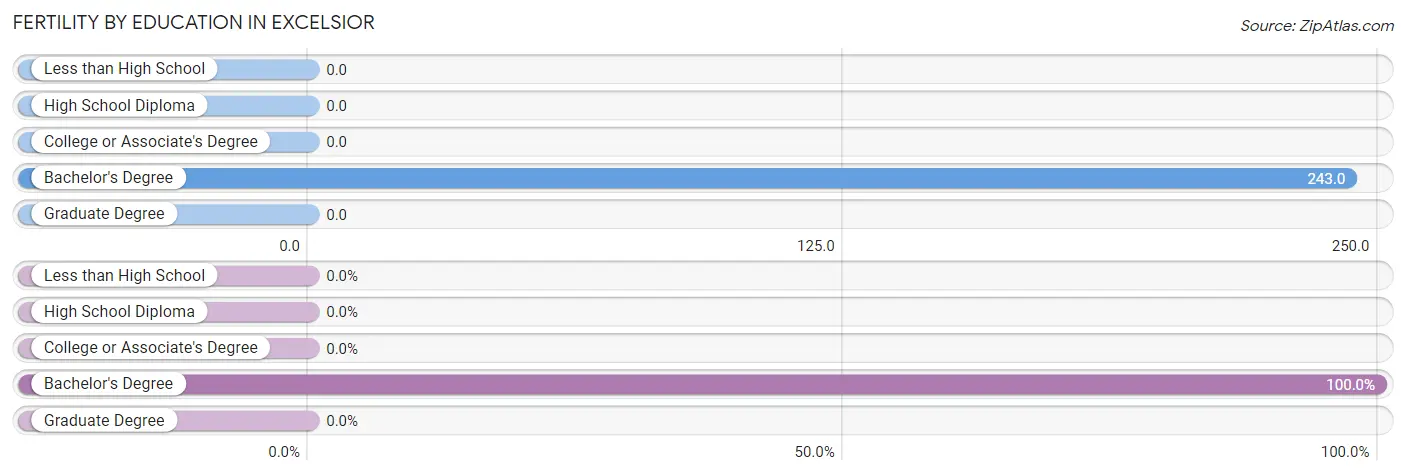
| Educational Attainment | Women with Births | Births / 1,000 Women |
| Less than High School | 0 (0.0%) | 0.0 |
| High School Diploma | 0 (0.0%) | 0.0 |
| College or Associate's Degree | 0 (0.0%) | 0.0 |
| Bachelor's Degree | 37 (100.0%) | 243.0 |
| Graduate Degree | 0 (0.0%) | 0.0 |
| Total | 37 (100.0%) | 89.0 |
Fertility by Education by Marriage Status in Excelsior
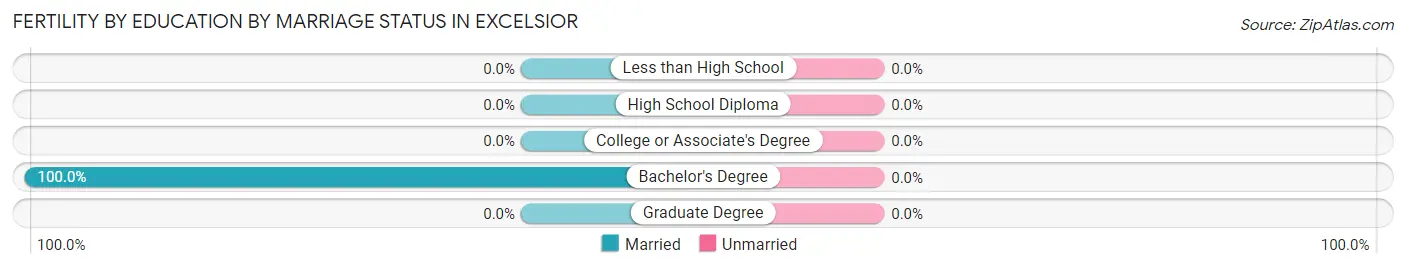
| Educational Attainment | Married | Unmarried |
| Less than High School | 0 (0.0%) | 0 (0.0%) |
| High School Diploma | 0 (0.0%) | 0 (0.0%) |
| College or Associate's Degree | 0 (0.0%) | 0 (0.0%) |
| Bachelor's Degree | 37 (100.0%) | 0 (0.0%) |
| Graduate Degree | 0 (0.0%) | 0 (0.0%) |
| Total | 37 (100.0%) | 0 (0.0%) |
Employment Characteristics in Excelsior
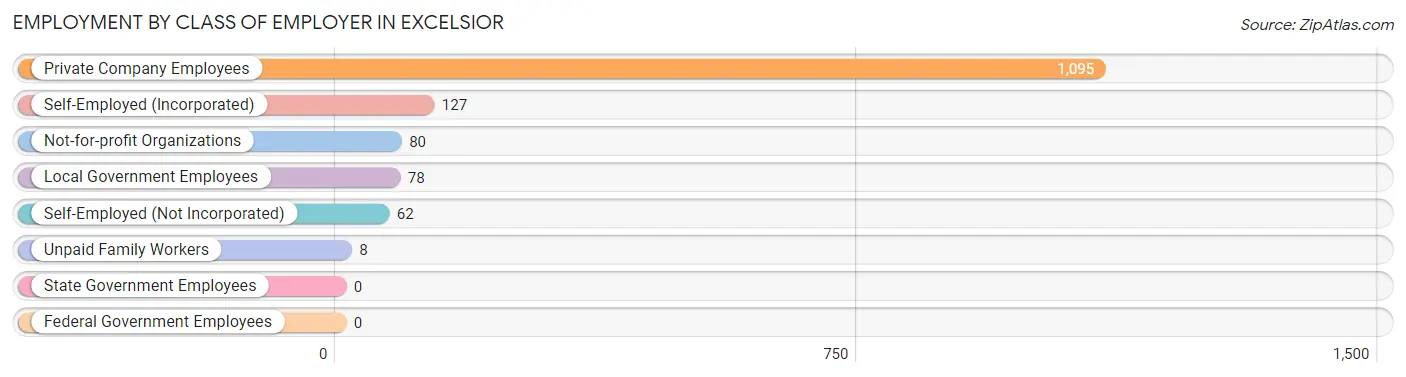
Employment by Class of Employer in Excelsior
Among the 1,450 employed individuals in Excelsior, private company employees (1,095 | 75.5%), self-employed (incorporated) (127 | 8.8%), and not-for-profit organizations (80 | 5.5%) make up the most common classes of employment.
| Employer Class | # Employees | % Employees |
| Private Company Employees | 1,095 | 75.5% |
| Self-Employed (Incorporated) | 127 | 8.8% |
| Self-Employed (Not Incorporated) | 62 | 4.3% |
| Not-for-profit Organizations | 80 | 5.5% |
| Local Government Employees | 78 | 5.4% |
| State Government Employees | 0 | 0.0% |
| Federal Government Employees | 0 | 0.0% |
| Unpaid Family Workers | 8 | 0.5% |
| Total | 1,450 | 100.0% |
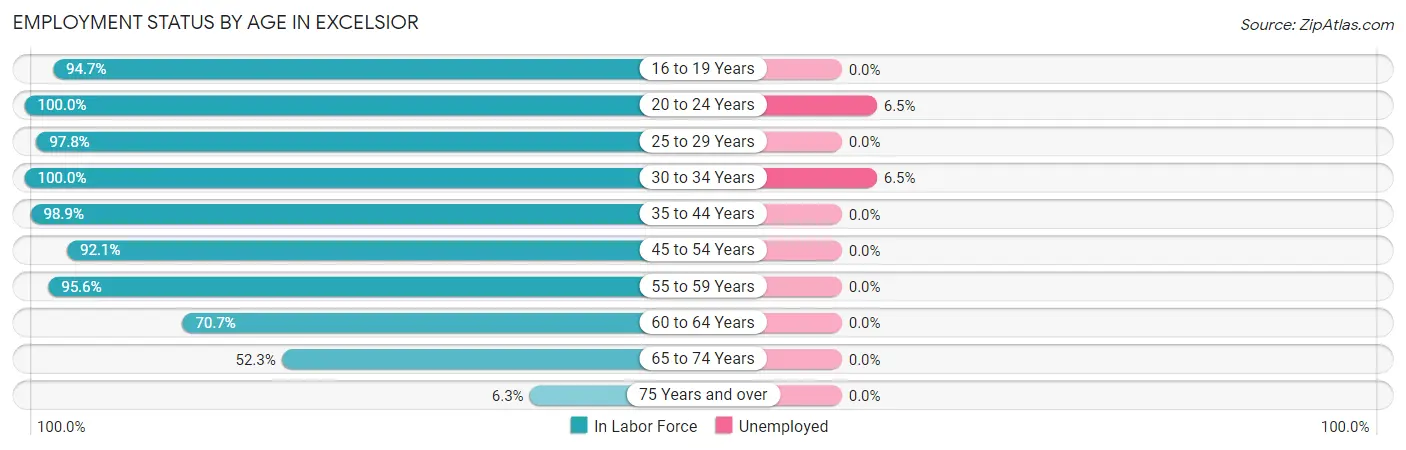
Employment Status by Age in Excelsior
According to the labor force statistics for Excelsior, out of the total population over 16 years of age (1,877), 80.1% or 1,503 individuals are in the labor force, with 1.0% or 15 of them unemployed. The age group with the highest labor force participation rate is 20 to 24 years, with 100.0% or 124 individuals in the labor force. Within the labor force, the 20 to 24 years age range has the highest percentage of unemployed individuals, with 6.5% or 8 of them being unemployed.
| Age Bracket | In Labor Force | Unemployed |
| 16 to 19 Years | 72 (94.7%) | 0 (0.0%) |
| 20 to 24 Years | 124 (100.0%) | 8 (6.5%) |
| 25 to 29 Years | 222 (97.8%) | 0 (0.0%) |
| 30 to 34 Years | 107 (100.0%) | 7 (6.5%) |
| 35 to 44 Years | 346 (98.9%) | 0 (0.0%) |
| 45 to 54 Years | 164 (92.1%) | 0 (0.0%) |
| 55 to 59 Years | 152 (95.6%) | 0 (0.0%) |
| 60 to 64 Years | 152 (70.7%) | 0 (0.0%) |
| 65 to 74 Years | 156 (52.3%) | 0 (0.0%) |
| 75 Years and over | 9 (6.3%) | 0 (0.0%) |
| Total | 1,503 (80.1%) | 15 (1.0%) |
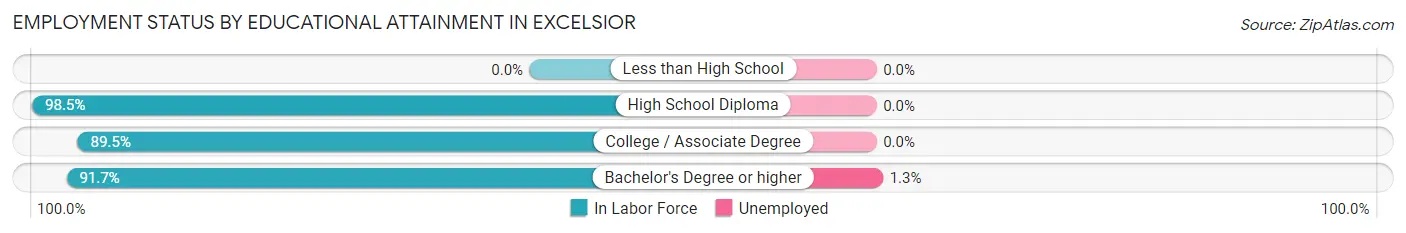
Employment Status by Educational Attainment in Excelsior
According to labor force statistics for Excelsior, 92.5% of individuals (1,143) out of the total population between 25 and 64 years of age (1,236) are in the labor force, with 0.6% or 7 of them being unemployed. The group with the highest labor force participation rate are those with the educational attainment of high school diploma, with 98.5% or 255 individuals in the labor force. Within the labor force, individuals with bachelor's degree or higher education have the highest percentage of unemployment, with 1.3% or 7 of them being unemployed.
| Educational Attainment | In Labor Force | Unemployed |
| Less than High School | 0 (0.0%) | 0 (0.0%) |
| High School Diploma | 255 (98.5%) | 0 (0.0%) |
| College / Associate Degree | 333 (89.5%) | 0 (0.0%) |
| Bachelor's Degree or higher | 555 (91.7%) | 8 (1.3%) |
| Total | 1,143 (92.5%) | 7 (0.6%) |
Employment Occupations by Sex in Excelsior
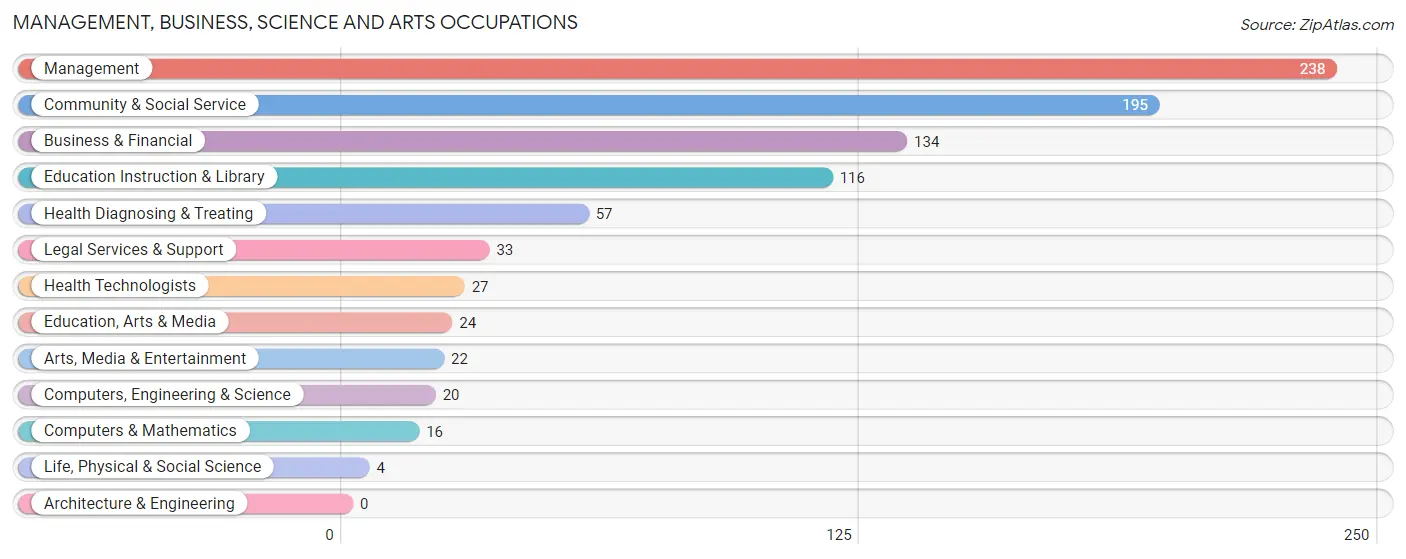
Management, Business, Science and Arts Occupations
The most common Management, Business, Science and Arts occupations in Excelsior are Management (238 | 16.0%), Community & Social Service (195 | 13.1%), Business & Financial (134 | 9.0%), Education Instruction & Library (116 | 7.8%), and Health Diagnosing & Treating (57 | 3.8%).
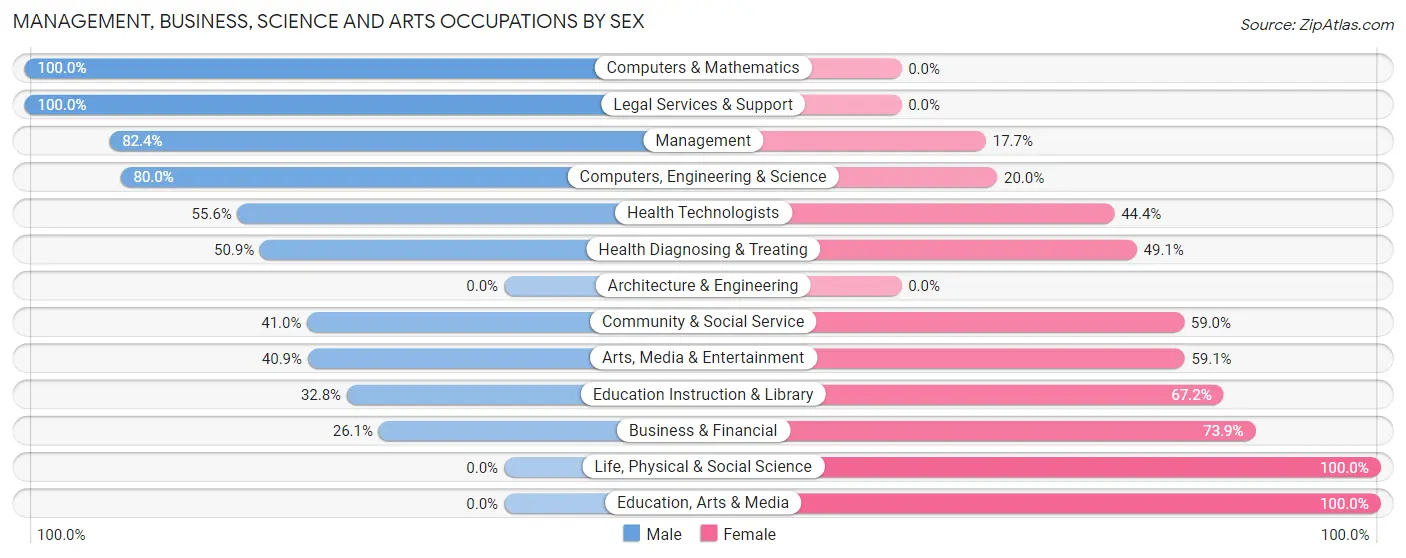
Management, Business, Science and Arts Occupations by Sex
Within the Management, Business, Science and Arts occupations in Excelsior, the most male-oriented occupations are Computers & Mathematics (100.0%), Legal Services & Support (100.0%), and Management (82.4%), while the most female-oriented occupations are Life, Physical & Social Science (100.0%), Education, Arts & Media (100.0%), and Business & Financial (73.9%).
| Occupation | Male | Female |
| Management | 196 (82.4%) | 42 (17.6%) |
| Business & Financial | 35 (26.1%) | 99 (73.9%) |
| Computers, Engineering & Science | 16 (80.0%) | 4 (20.0%) |
| Computers & Mathematics | 16 (100.0%) | 0 (0.0%) |
| Architecture & Engineering | 0 (0.0%) | 0 (0.0%) |
| Life, Physical & Social Science | 0 (0.0%) | 4 (100.0%) |
| Community & Social Service | 80 (41.0%) | 115 (59.0%) |
| Education, Arts & Media | 0 (0.0%) | 24 (100.0%) |
| Legal Services & Support | 33 (100.0%) | 0 (0.0%) |
| Education Instruction & Library | 38 (32.8%) | 78 (67.2%) |
| Arts, Media & Entertainment | 9 (40.9%) | 13 (59.1%) |
| Health Diagnosing & Treating | 29 (50.9%) | 28 (49.1%) |
| Health Technologists | 15 (55.6%) | 12 (44.4%) |
| Total (Category) | 356 (55.3%) | 288 (44.7%) |
| Total (Overall) | 864 (58.0%) | 625 (42.0%) |
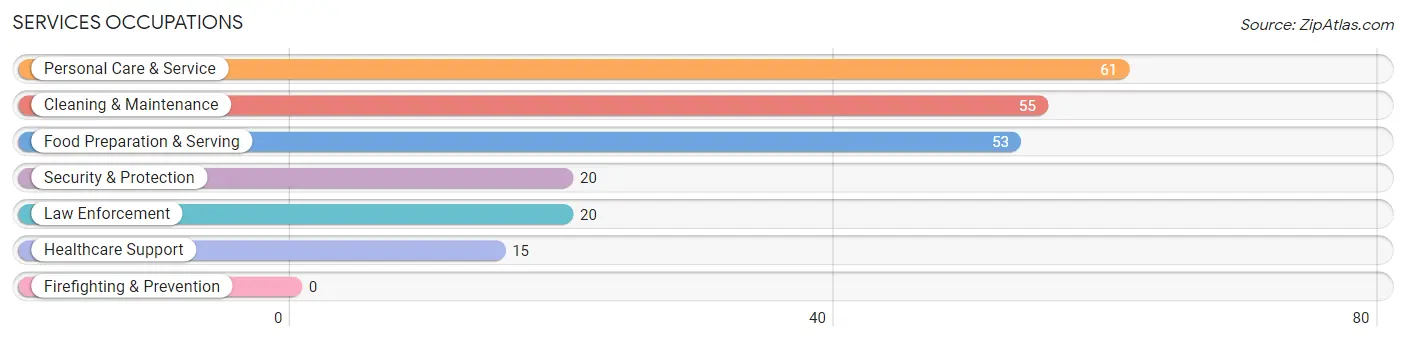
Services Occupations
The most common Services occupations in Excelsior are Personal Care & Service (61 | 4.1%), Cleaning & Maintenance (55 | 3.7%), Food Preparation & Serving (53 | 3.6%), Security & Protection (20 | 1.3%), and Law Enforcement (20 | 1.3%).
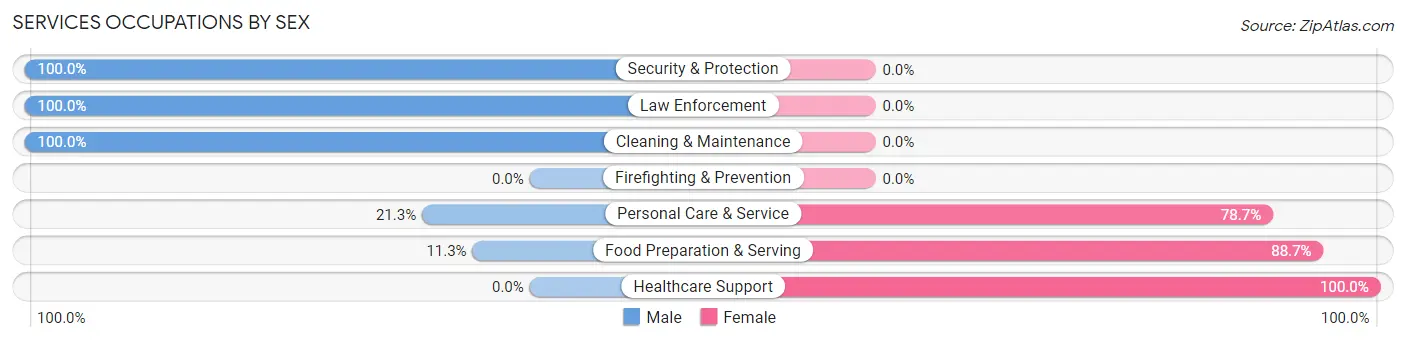
Services Occupations by Sex
Within the Services occupations in Excelsior, the most male-oriented occupations are Security & Protection (100.0%), Law Enforcement (100.0%), and Cleaning & Maintenance (100.0%), while the most female-oriented occupations are Healthcare Support (100.0%), Food Preparation & Serving (88.7%), and Personal Care & Service (78.7%).
| Occupation | Male | Female |
| Healthcare Support | 0 (0.0%) | 15 (100.0%) |
| Security & Protection | 20 (100.0%) | 0 (0.0%) |
| Firefighting & Prevention | 0 (0.0%) | 0 (0.0%) |
| Law Enforcement | 20 (100.0%) | 0 (0.0%) |
| Food Preparation & Serving | 6 (11.3%) | 47 (88.7%) |
| Cleaning & Maintenance | 55 (100.0%) | 0 (0.0%) |
| Personal Care & Service | 13 (21.3%) | 48 (78.7%) |
| Total (Category) | 94 (46.1%) | 110 (53.9%) |
| Total (Overall) | 864 (58.0%) | 625 (42.0%) |
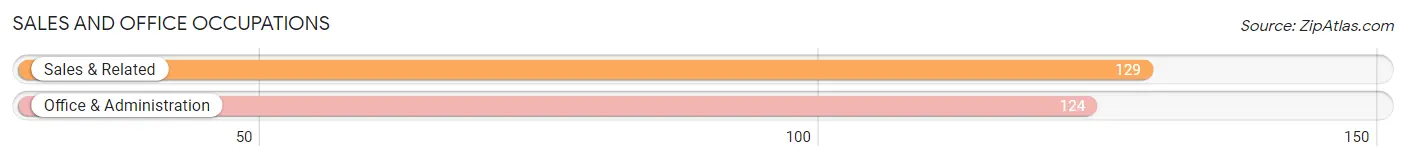
Sales and Office Occupations
The most common Sales and Office occupations in Excelsior are Sales & Related (129 | 8.7%), and Office & Administration (124 | 8.3%).
Sales and Office Occupations by Sex
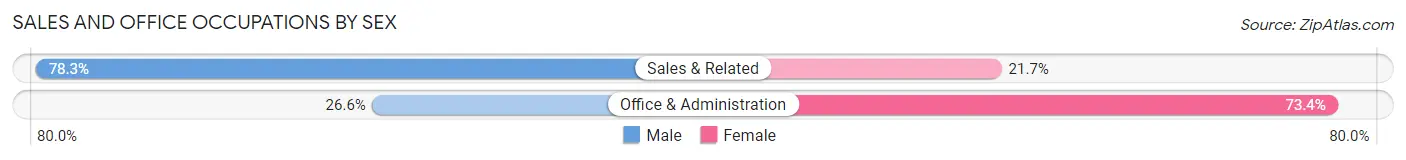
| Occupation | Male | Female |
| Sales & Related | 101 (78.3%) | 28 (21.7%) |
| Office & Administration | 33 (26.6%) | 91 (73.4%) |
| Total (Category) | 134 (53.0%) | 119 (47.0%) |
| Total (Overall) | 864 (58.0%) | 625 (42.0%) |
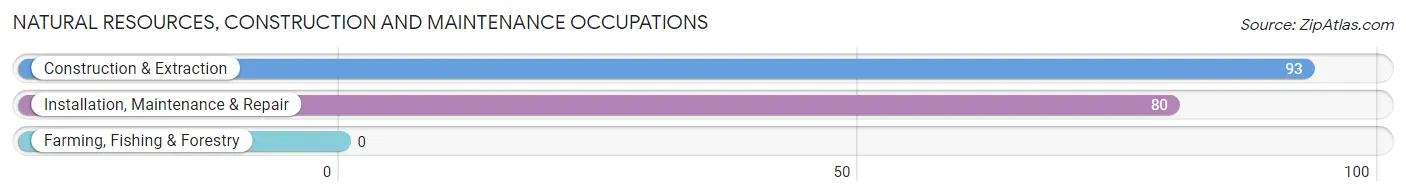
Natural Resources, Construction and Maintenance Occupations
The most common Natural Resources, Construction and Maintenance occupations in Excelsior are Construction & Extraction (93 | 6.2%), and Installation, Maintenance & Repair (80 | 5.4%).
Natural Resources, Construction and Maintenance Occupations by Sex
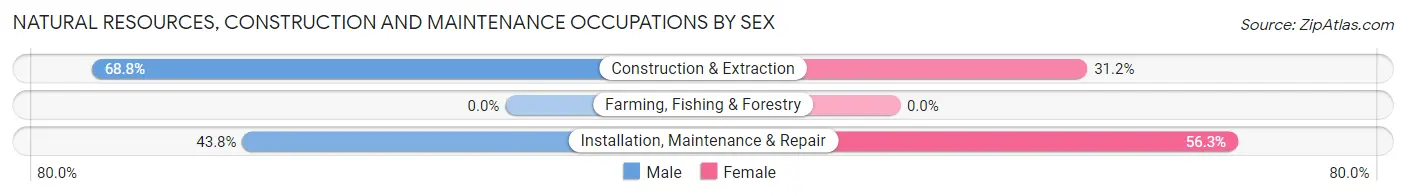
| Occupation | Male | Female |
| Farming, Fishing & Forestry | 0 (0.0%) | 0 (0.0%) |
| Construction & Extraction | 64 (68.8%) | 29 (31.2%) |
| Installation, Maintenance & Repair | 35 (43.8%) | 45 (56.2%) |
| Total (Category) | 99 (57.2%) | 74 (42.8%) |
| Total (Overall) | 864 (58.0%) | 625 (42.0%) |
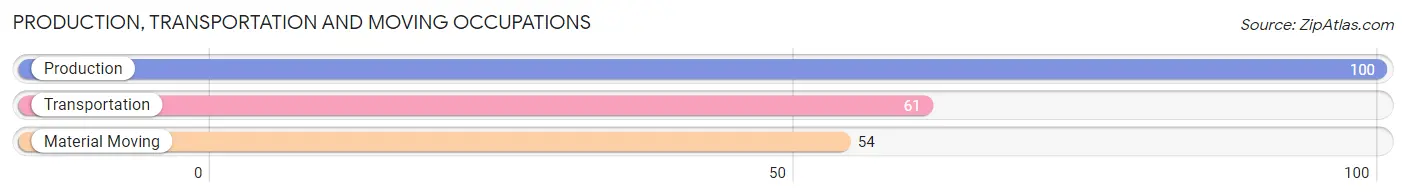
Production, Transportation and Moving Occupations
The most common Production, Transportation and Moving occupations in Excelsior are Production (100 | 6.7%), Transportation (61 | 4.1%), and Material Moving (54 | 3.6%).
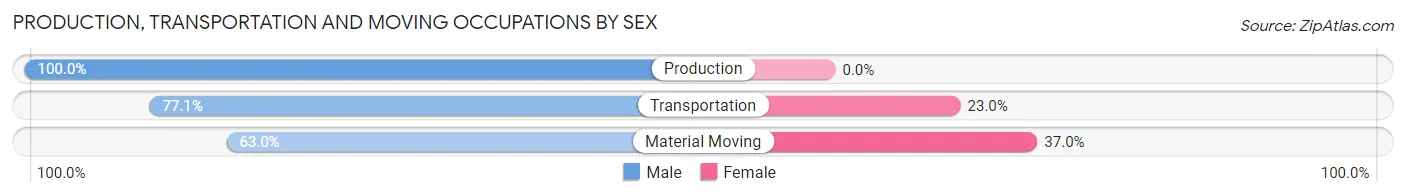
Production, Transportation and Moving Occupations by Sex
| Occupation | Male | Female |
| Production | 100 (100.0%) | 0 (0.0%) |
| Transportation | 47 (77.0%) | 14 (23.0%) |
| Material Moving | 34 (63.0%) | 20 (37.0%) |
| Total (Category) | 181 (84.2%) | 34 (15.8%) |
| Total (Overall) | 864 (58.0%) | 625 (42.0%) |
Employment Industries by Sex in Excelsior
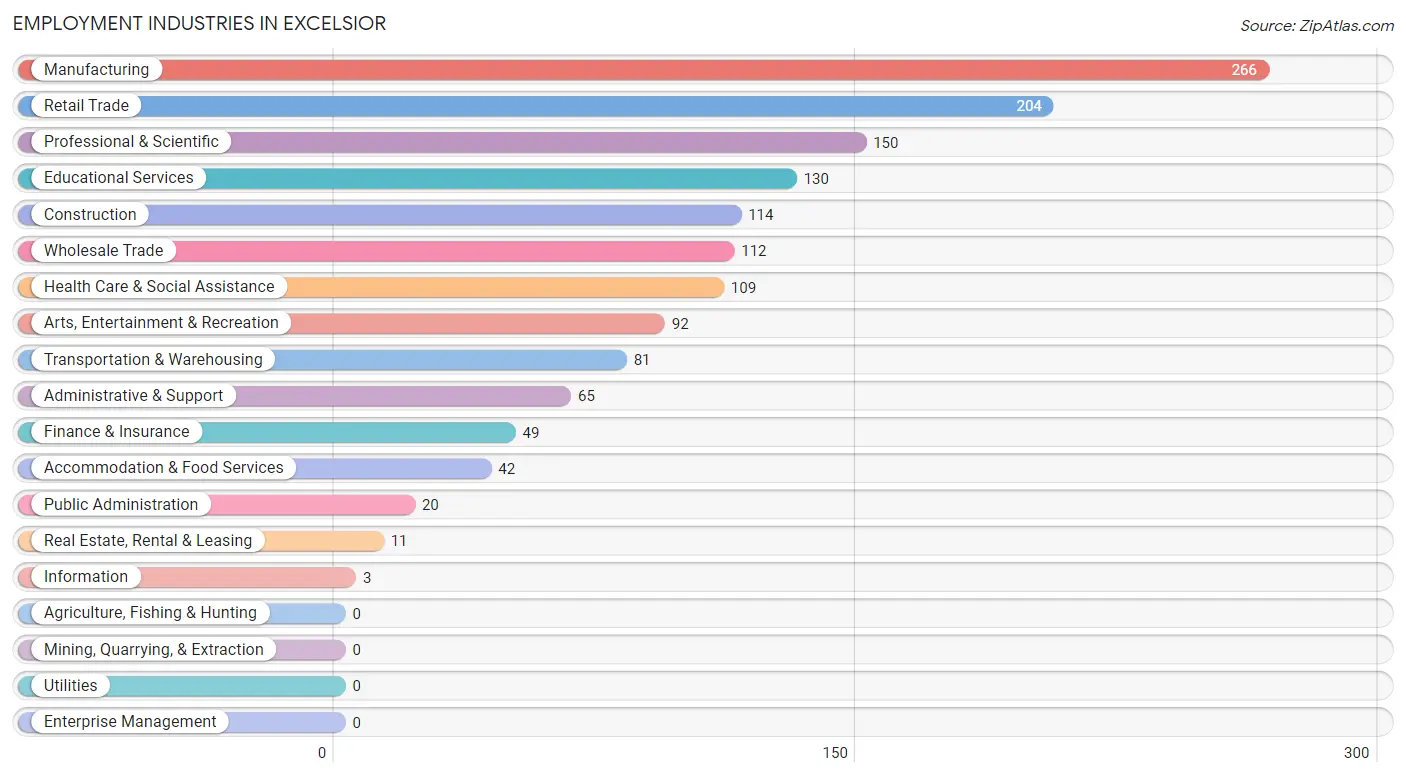
Employment Industries in Excelsior
The major employment industries in Excelsior include Manufacturing (266 | 17.9%), Retail Trade (204 | 13.7%), Professional & Scientific (150 | 10.1%), Educational Services (130 | 8.7%), and Construction (114 | 7.7%).
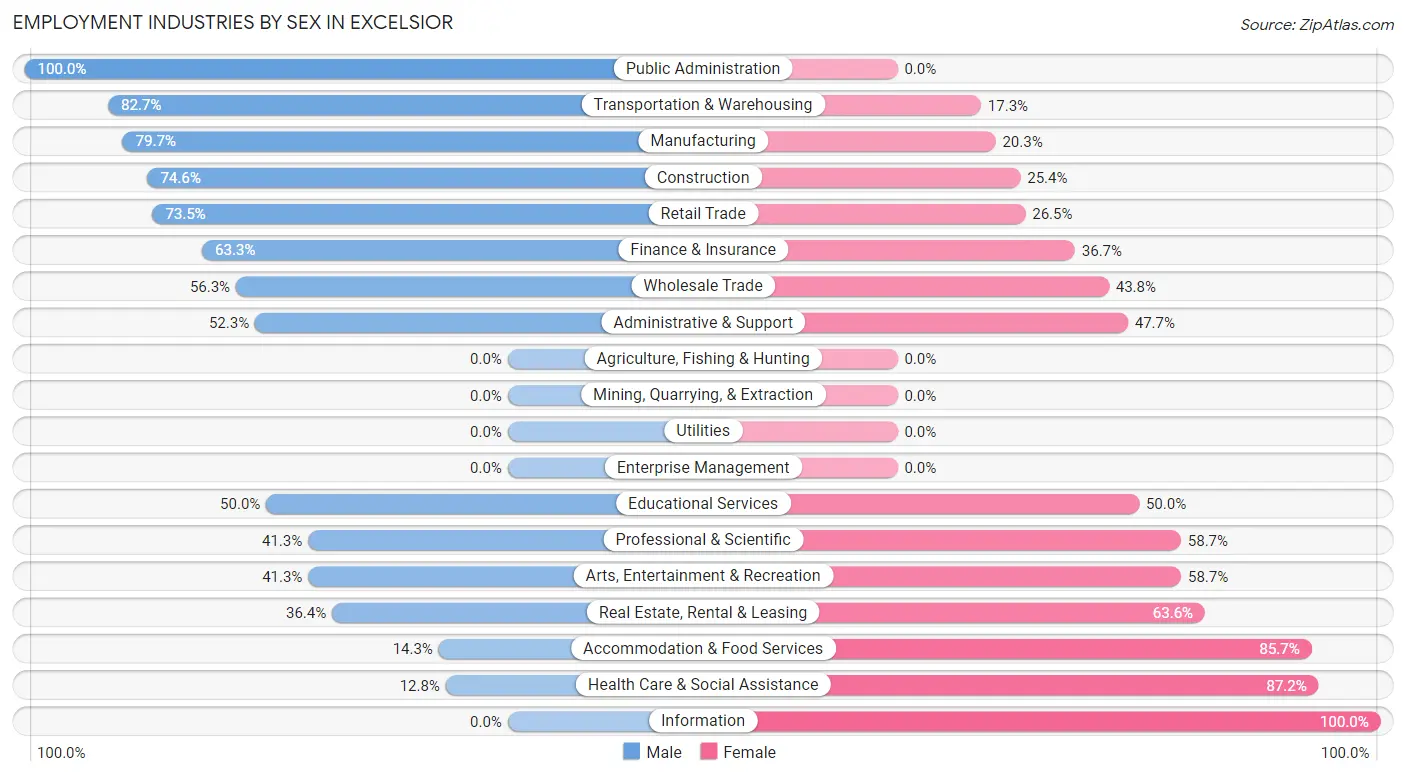
Employment Industries by Sex in Excelsior
The Excelsior industries that see more men than women are Public Administration (100.0%), Transportation & Warehousing (82.7%), and Manufacturing (79.7%), whereas the industries that tend to have a higher number of women are Information (100.0%), Health Care & Social Assistance (87.2%), and Accommodation & Food Services (85.7%).
| Industry | Male | Female |
| Agriculture, Fishing & Hunting | 0 (0.0%) | 0 (0.0%) |
| Mining, Quarrying, & Extraction | 0 (0.0%) | 0 (0.0%) |
| Construction | 85 (74.6%) | 29 (25.4%) |
| Manufacturing | 212 (79.7%) | 54 (20.3%) |
| Wholesale Trade | 63 (56.2%) | 49 (43.8%) |
| Retail Trade | 150 (73.5%) | 54 (26.5%) |
| Transportation & Warehousing | 67 (82.7%) | 14 (17.3%) |
| Utilities | 0 (0.0%) | 0 (0.0%) |
| Information | 0 (0.0%) | 3 (100.0%) |
| Finance & Insurance | 31 (63.3%) | 18 (36.7%) |
| Real Estate, Rental & Leasing | 4 (36.4%) | 7 (63.6%) |
| Professional & Scientific | 62 (41.3%) | 88 (58.7%) |
| Enterprise Management | 0 (0.0%) | 0 (0.0%) |
| Administrative & Support | 34 (52.3%) | 31 (47.7%) |
| Educational Services | 65 (50.0%) | 65 (50.0%) |
| Health Care & Social Assistance | 14 (12.8%) | 95 (87.2%) |
| Arts, Entertainment & Recreation | 38 (41.3%) | 54 (58.7%) |
| Accommodation & Food Services | 6 (14.3%) | 36 (85.7%) |
| Public Administration | 20 (100.0%) | 0 (0.0%) |
| Total | 864 (58.0%) | 625 (42.0%) |
Education in Excelsior
School Enrollment in Excelsior
The most common levels of schooling among the 463 students in Excelsior are elementary school (128 | 27.7%), high school (127 | 27.4%), and middle school (86 | 18.6%).
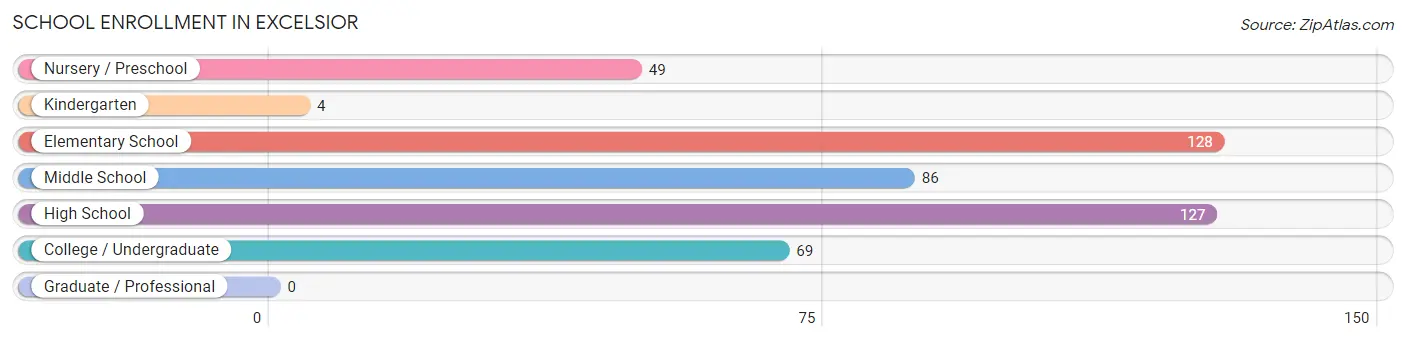
| School Level | # Students | % Students |
| Nursery / Preschool | 49 | 10.6% |
| Kindergarten | 4 | 0.9% |
| Elementary School | 128 | 27.7% |
| Middle School | 86 | 18.6% |
| High School | 127 | 27.4% |
| College / Undergraduate | 69 | 14.9% |
| Graduate / Professional | 0 | 0.0% |
| Total | 463 | 100.0% |
School Enrollment by Age by Funding Source in Excelsior
Out of a total of 463 students who are enrolled in schools in Excelsior, 132 (28.5%) attend a private institution, while the remaining 331 (71.5%) are enrolled in public schools. The age group of 35 years and over has the highest likelihood of being enrolled in private schools, with 5 (100.0% in the age bracket) enrolled. Conversely, the age group of 15 to 17 year olds has the lowest likelihood of being enrolled in a private school, with 40 (100.0% in the age bracket) attending a public institution.
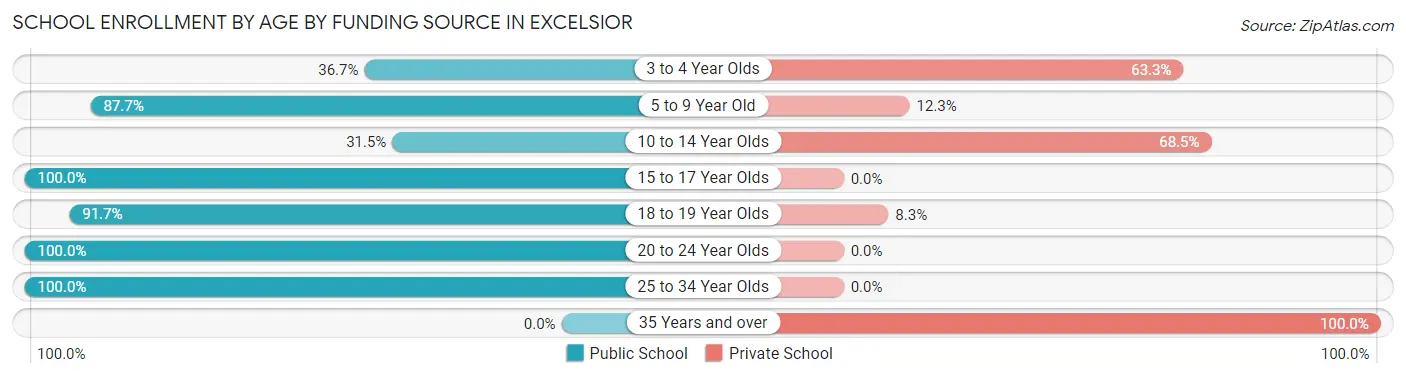
| Age Bracket | Public School | Private School |
| 3 to 4 Year Olds | 18 (36.7%) | 31 (63.3%) |
| 5 to 9 Year Old | 100 (87.7%) | 14 (12.3%) |
| 10 to 14 Year Olds | 35 (31.5%) | 76 (68.5%) |
| 15 to 17 Year Olds | 40 (100.0%) | 0 (0.0%) |
| 18 to 19 Year Olds | 66 (91.7%) | 6 (8.3%) |
| 20 to 24 Year Olds | 40 (100.0%) | 0 (0.0%) |
| 25 to 34 Year Olds | 32 (100.0%) | 0 (0.0%) |
| 35 Years and over | 0 (0.0%) | 5 (100.0%) |
| Total | 331 (71.5%) | 132 (28.5%) |
Educational Attainment by Field of Study in Excelsior
Business (222 | 25.0%), education (168 | 18.9%), social sciences (120 | 13.5%), liberal arts & history (85 | 9.6%), and arts & humanities (66 | 7.4%) are the most common fields of study among 887 individuals in Excelsior who have obtained a bachelor's degree or higher.
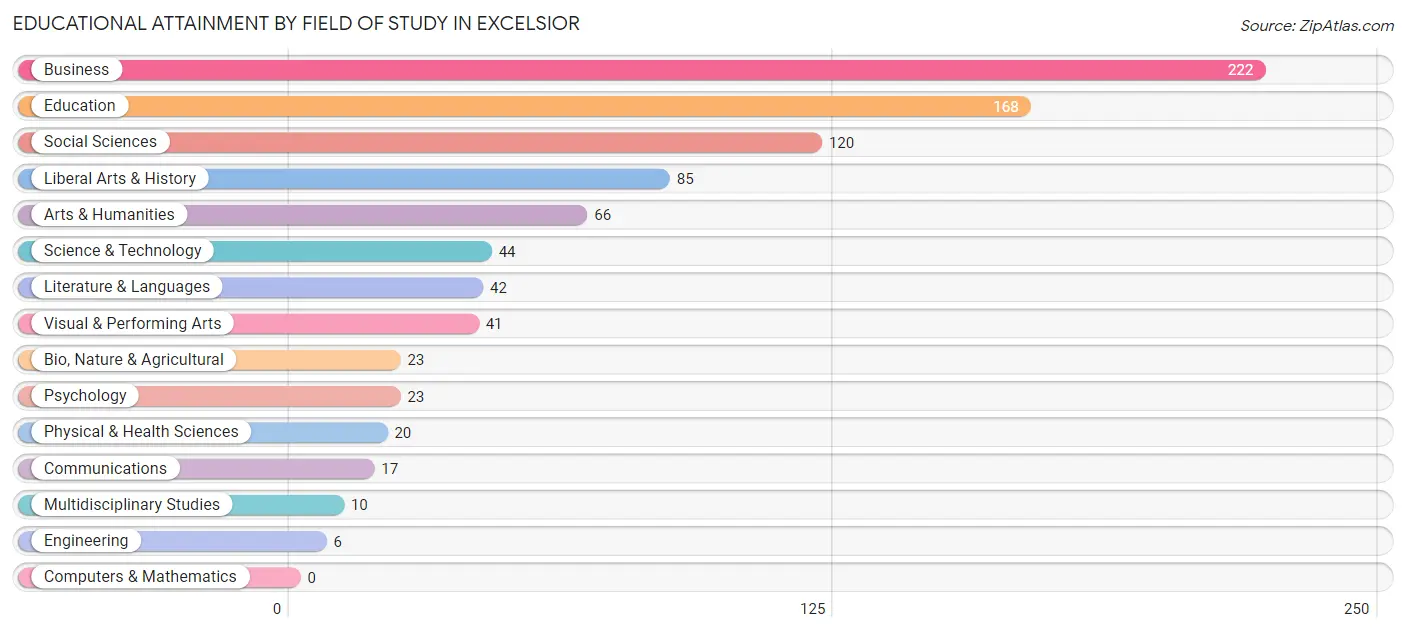
| Field of Study | # Graduates | % Graduates |
| Computers & Mathematics | 0 | 0.0% |
| Bio, Nature & Agricultural | 23 | 2.6% |
| Physical & Health Sciences | 20 | 2.2% |
| Psychology | 23 | 2.6% |
| Social Sciences | 120 | 13.5% |
| Engineering | 6 | 0.7% |
| Multidisciplinary Studies | 10 | 1.1% |
| Science & Technology | 44 | 5.0% |
| Business | 222 | 25.0% |
| Education | 168 | 18.9% |
| Literature & Languages | 42 | 4.7% |
| Liberal Arts & History | 85 | 9.6% |
| Visual & Performing Arts | 41 | 4.6% |
| Communications | 17 | 1.9% |
| Arts & Humanities | 66 | 7.4% |
| Total | 887 | 100.0% |
Transportation & Commute in Excelsior
Vehicle Availability by Sex in Excelsior
The most prevalent vehicle ownership categories in Excelsior are males with 2 vehicles (455, accounting for 53.6%) and females with 2 vehicles (304, making up 75.7%).
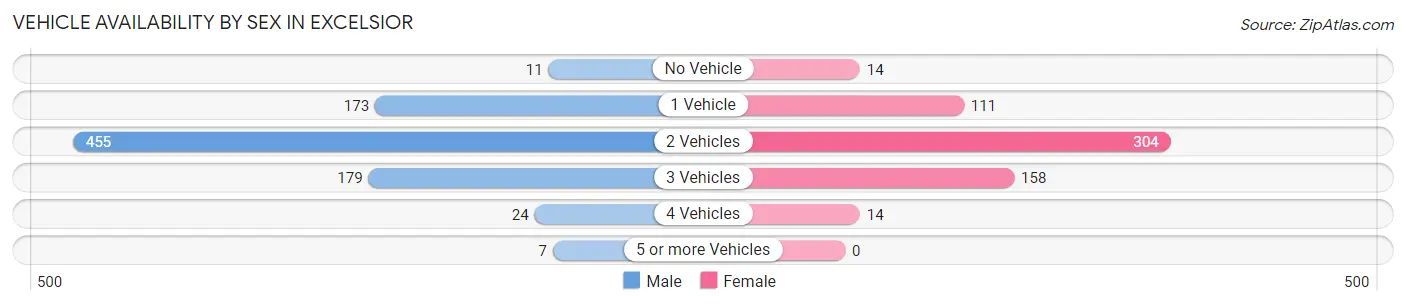
| Vehicles Available | Male | Female |
| No Vehicle | 11 (1.3%) | 14 (2.3%) |
| 1 Vehicle | 173 (20.4%) | 111 (18.5%) |
| 2 Vehicles | 455 (53.6%) | 304 (50.6%) |
| 3 Vehicles | 179 (21.1%) | 158 (26.3%) |
| 4 Vehicles | 24 (2.8%) | 14 (2.3%) |
| 5 or more Vehicles | 7 (0.8%) | 0 (0.0%) |
| Total | 849 (100.0%) | 601 (100.0%) |
Commute Time in Excelsior
The most frequently occuring commute durations in Excelsior are 10 to 14 minutes (239 commuters, 18.5%), 20 to 24 minutes (233 commuters, 18.1%), and 15 to 19 minutes (192 commuters, 14.9%).
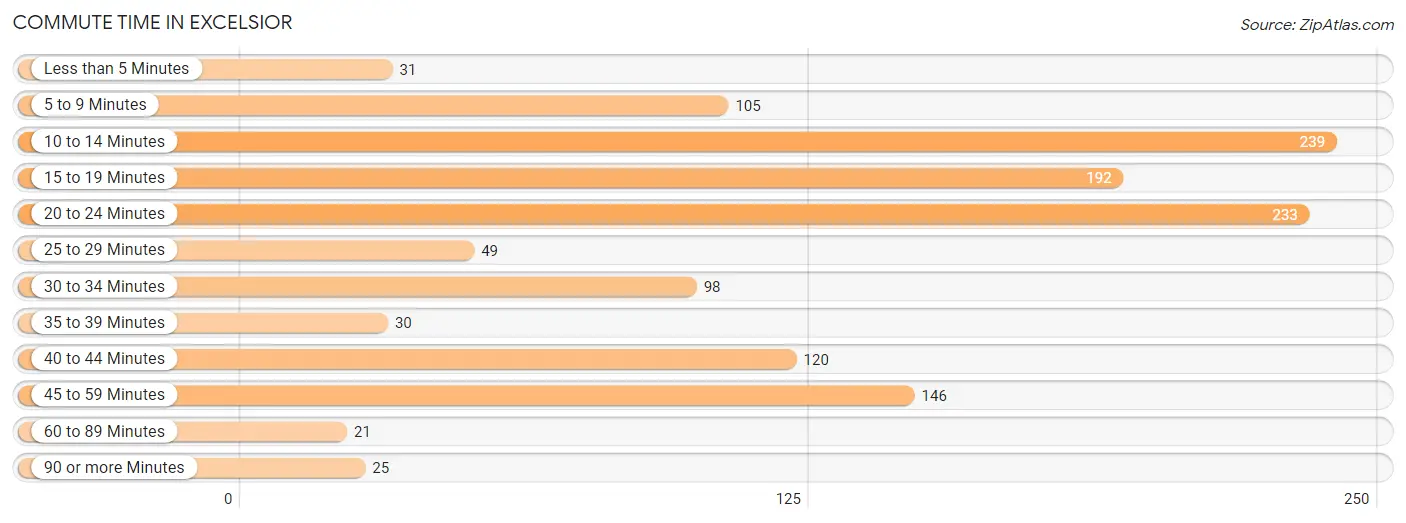
| Commute Time | # Commuters | % Commuters |
| Less than 5 Minutes | 31 | 2.4% |
| 5 to 9 Minutes | 105 | 8.2% |
| 10 to 14 Minutes | 239 | 18.5% |
| 15 to 19 Minutes | 192 | 14.9% |
| 20 to 24 Minutes | 233 | 18.1% |
| 25 to 29 Minutes | 49 | 3.8% |
| 30 to 34 Minutes | 98 | 7.6% |
| 35 to 39 Minutes | 30 | 2.3% |
| 40 to 44 Minutes | 120 | 9.3% |
| 45 to 59 Minutes | 146 | 11.3% |
| 60 to 89 Minutes | 21 | 1.6% |
| 90 or more Minutes | 25 | 1.9% |
Commute Time by Sex in Excelsior
The most common commute times in Excelsior are 10 to 14 minutes (221 commuters, 29.7%) for males and 20 to 24 minutes (179 commuters, 32.8%) for females.
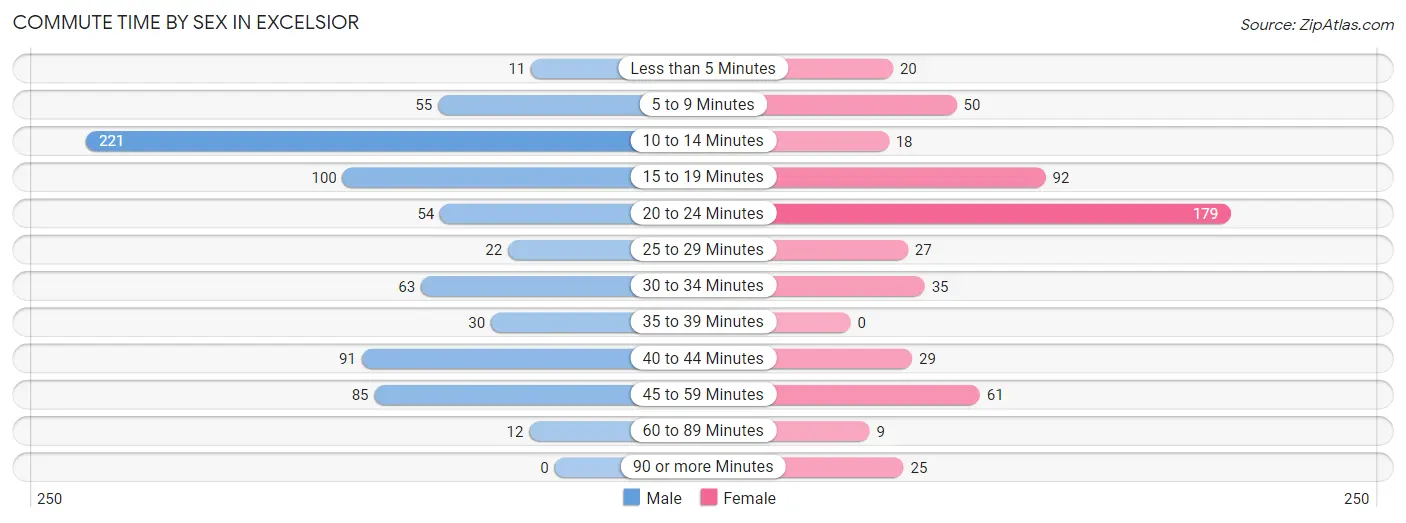
| Commute Time | Male | Female |
| Less than 5 Minutes | 11 (1.5%) | 20 (3.7%) |
| 5 to 9 Minutes | 55 (7.4%) | 50 (9.2%) |
| 10 to 14 Minutes | 221 (29.7%) | 18 (3.3%) |
| 15 to 19 Minutes | 100 (13.4%) | 92 (16.9%) |
| 20 to 24 Minutes | 54 (7.3%) | 179 (32.8%) |
| 25 to 29 Minutes | 22 (3.0%) | 27 (5.0%) |
| 30 to 34 Minutes | 63 (8.5%) | 35 (6.4%) |
| 35 to 39 Minutes | 30 (4.0%) | 0 (0.0%) |
| 40 to 44 Minutes | 91 (12.2%) | 29 (5.3%) |
| 45 to 59 Minutes | 85 (11.4%) | 61 (11.2%) |
| 60 to 89 Minutes | 12 (1.6%) | 9 (1.7%) |
| 90 or more Minutes | 0 (0.0%) | 25 (4.6%) |
Time of Departure to Work by Sex in Excelsior
The most frequent times of departure to work in Excelsior are 7:00 AM to 7:29 AM (203, 27.3%) for males and 7:30 AM to 7:59 AM (127, 23.3%) for females.
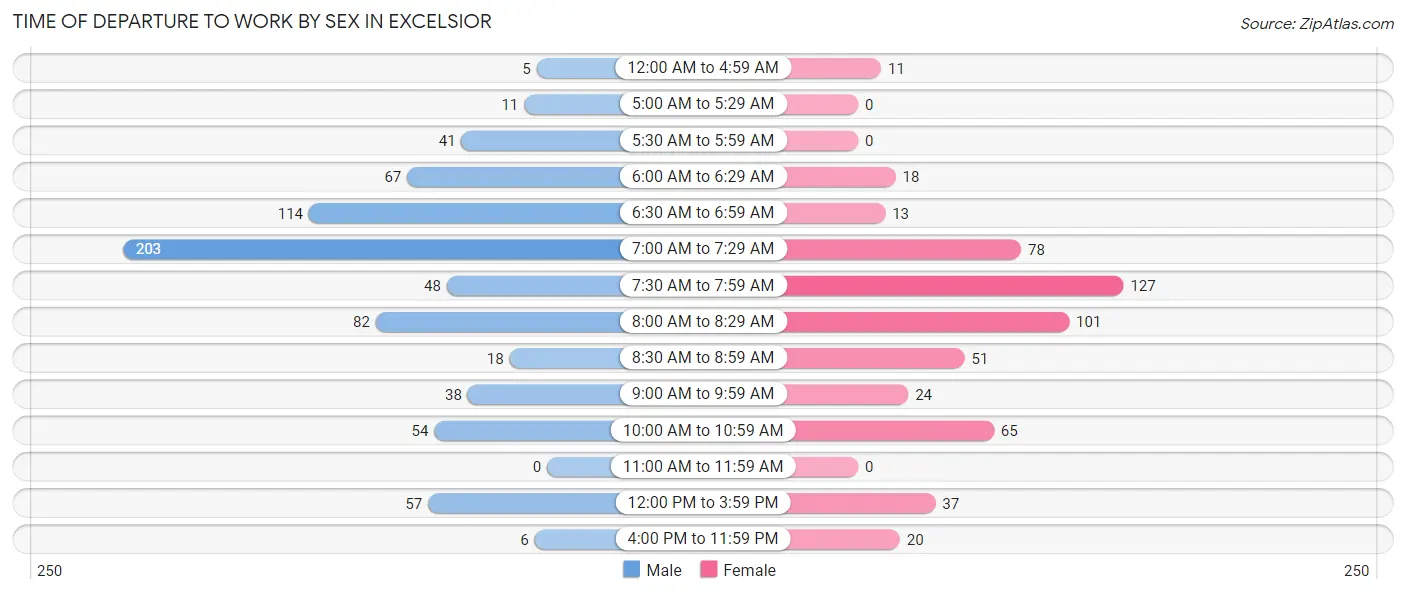
| Time of Departure | Male | Female |
| 12:00 AM to 4:59 AM | 5 (0.7%) | 11 (2.0%) |
| 5:00 AM to 5:29 AM | 11 (1.5%) | 0 (0.0%) |
| 5:30 AM to 5:59 AM | 41 (5.5%) | 0 (0.0%) |
| 6:00 AM to 6:29 AM | 67 (9.0%) | 18 (3.3%) |
| 6:30 AM to 6:59 AM | 114 (15.3%) | 13 (2.4%) |
| 7:00 AM to 7:29 AM | 203 (27.3%) | 78 (14.3%) |
| 7:30 AM to 7:59 AM | 48 (6.5%) | 127 (23.3%) |
| 8:00 AM to 8:29 AM | 82 (11.0%) | 101 (18.5%) |
| 8:30 AM to 8:59 AM | 18 (2.4%) | 51 (9.4%) |
| 9:00 AM to 9:59 AM | 38 (5.1%) | 24 (4.4%) |
| 10:00 AM to 10:59 AM | 54 (7.3%) | 65 (11.9%) |
| 11:00 AM to 11:59 AM | 0 (0.0%) | 0 (0.0%) |
| 12:00 PM to 3:59 PM | 57 (7.7%) | 37 (6.8%) |
| 4:00 PM to 11:59 PM | 6 (0.8%) | 20 (3.7%) |
| Total | 744 (100.0%) | 545 (100.0%) |
Housing Occupancy in Excelsior
Occupancy by Ownership in Excelsior
Of the total 1,059 dwellings in Excelsior, owner-occupied units account for 435 (41.1%), while renter-occupied units make up 624 (58.9%).
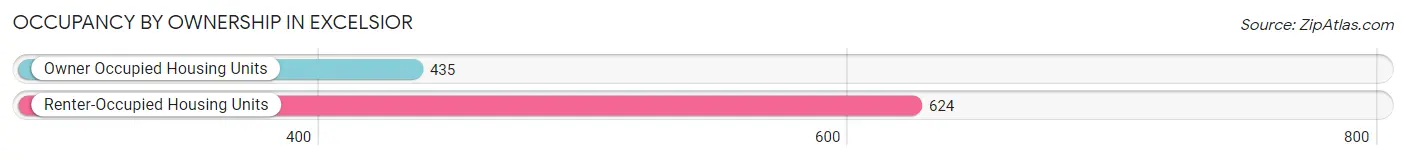
| Occupancy | # Housing Units | % Housing Units |
| Owner Occupied Housing Units | 435 | 41.1% |
| Renter-Occupied Housing Units | 624 | 58.9% |
| Total Occupied Housing Units | 1,059 | 100.0% |
Occupancy by Household Size in Excelsior
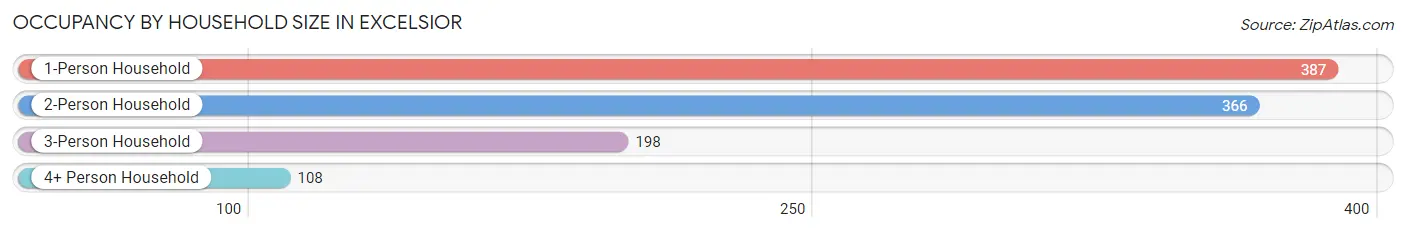
| Household Size | # Housing Units | % Housing Units |
| 1-Person Household | 387 | 36.5% |
| 2-Person Household | 366 | 34.6% |
| 3-Person Household | 198 | 18.7% |
| 4+ Person Household | 108 | 10.2% |
| Total Housing Units | 1,059 | 100.0% |
Occupancy by Ownership by Household Size in Excelsior
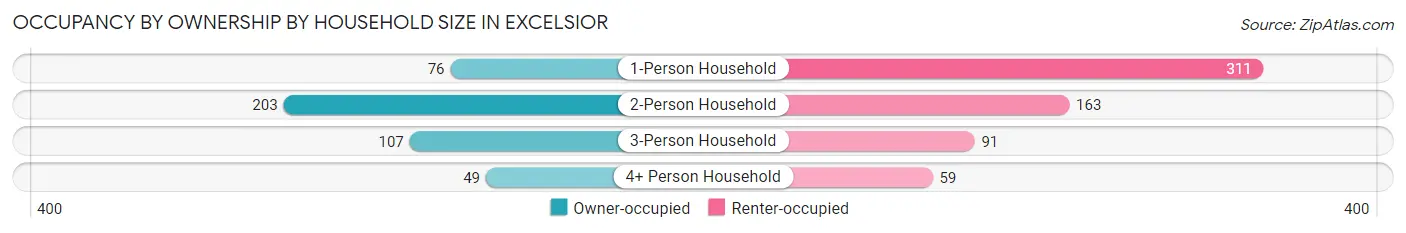
| Household Size | Owner-occupied | Renter-occupied |
| 1-Person Household | 76 (19.6%) | 311 (80.4%) |
| 2-Person Household | 203 (55.5%) | 163 (44.5%) |
| 3-Person Household | 107 (54.0%) | 91 (46.0%) |
| 4+ Person Household | 49 (45.4%) | 59 (54.6%) |
| Total Housing Units | 435 (41.1%) | 624 (58.9%) |
Occupancy by Educational Attainment in Excelsior
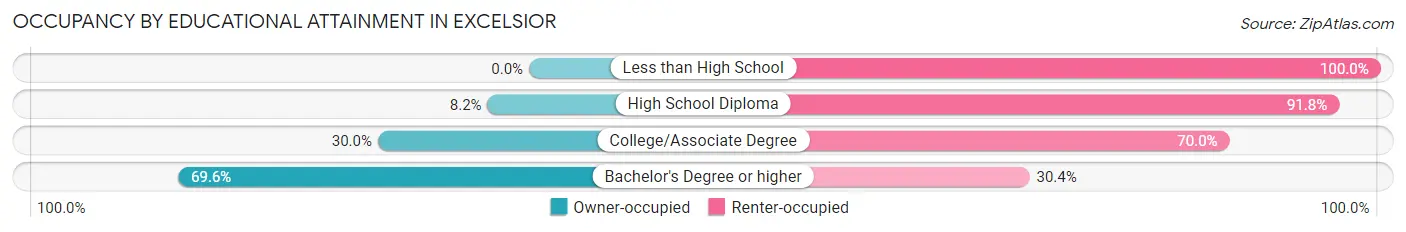
| Household Size | Owner-occupied | Renter-occupied |
| Less than High School | 0 (0.0%) | 5 (100.0%) |
| High School Diploma | 20 (8.2%) | 223 (91.8%) |
| College/Associate Degree | 113 (30.0%) | 264 (70.0%) |
| Bachelor's Degree or higher | 302 (69.6%) | 132 (30.4%) |
Occupancy by Age of Householder in Excelsior
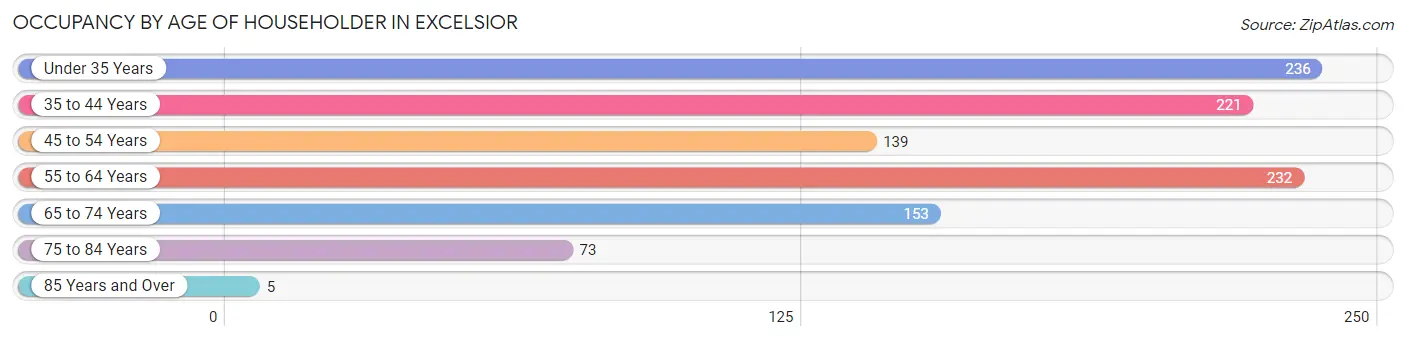
| Age Bracket | # Households | % Households |
| Under 35 Years | 236 | 22.3% |
| 35 to 44 Years | 221 | 20.9% |
| 45 to 54 Years | 139 | 13.1% |
| 55 to 64 Years | 232 | 21.9% |
| 65 to 74 Years | 153 | 14.4% |
| 75 to 84 Years | 73 | 6.9% |
| 85 Years and Over | 5 | 0.5% |
| Total | 1,059 | 100.0% |
Housing Finances in Excelsior
Median Income by Occupancy in Excelsior
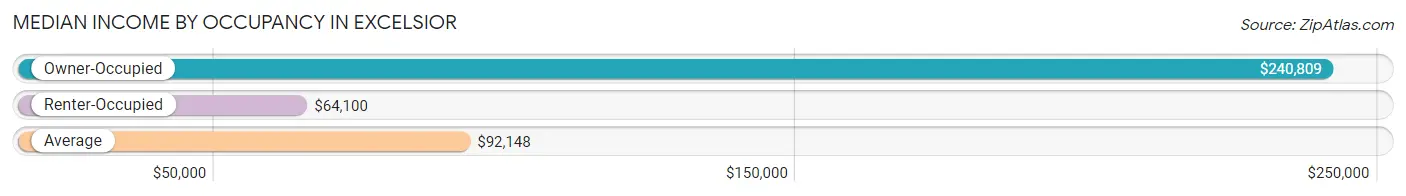
| Occupancy Type | # Households | Median Income |
| Owner-Occupied | 435 (41.1%) | $240,809 |
| Renter-Occupied | 624 (58.9%) | $64,100 |
| Average | 1,059 (100.0%) | $92,148 |
Occupancy by Householder Income Bracket in Excelsior
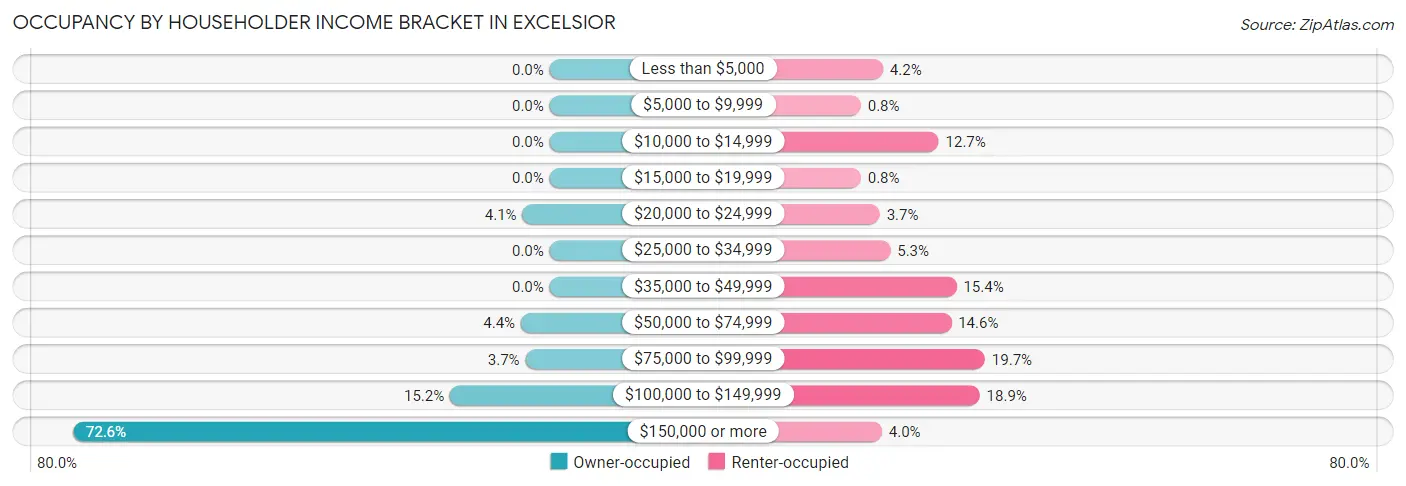
| Income Bracket | Owner-occupied | Renter-occupied |
| Less than $5,000 | 0 (0.0%) | 26 (4.2%) |
| $5,000 to $9,999 | 0 (0.0%) | 5 (0.8%) |
| $10,000 to $14,999 | 0 (0.0%) | 79 (12.7%) |
| $15,000 to $19,999 | 0 (0.0%) | 5 (0.8%) |
| $20,000 to $24,999 | 18 (4.1%) | 23 (3.7%) |
| $25,000 to $34,999 | 0 (0.0%) | 33 (5.3%) |
| $35,000 to $49,999 | 0 (0.0%) | 96 (15.4%) |
| $50,000 to $74,999 | 19 (4.4%) | 91 (14.6%) |
| $75,000 to $99,999 | 16 (3.7%) | 123 (19.7%) |
| $100,000 to $149,999 | 66 (15.2%) | 118 (18.9%) |
| $150,000 or more | 316 (72.6%) | 25 (4.0%) |
| Total | 435 (100.0%) | 624 (100.0%) |
Monthly Housing Cost Tiers in Excelsior
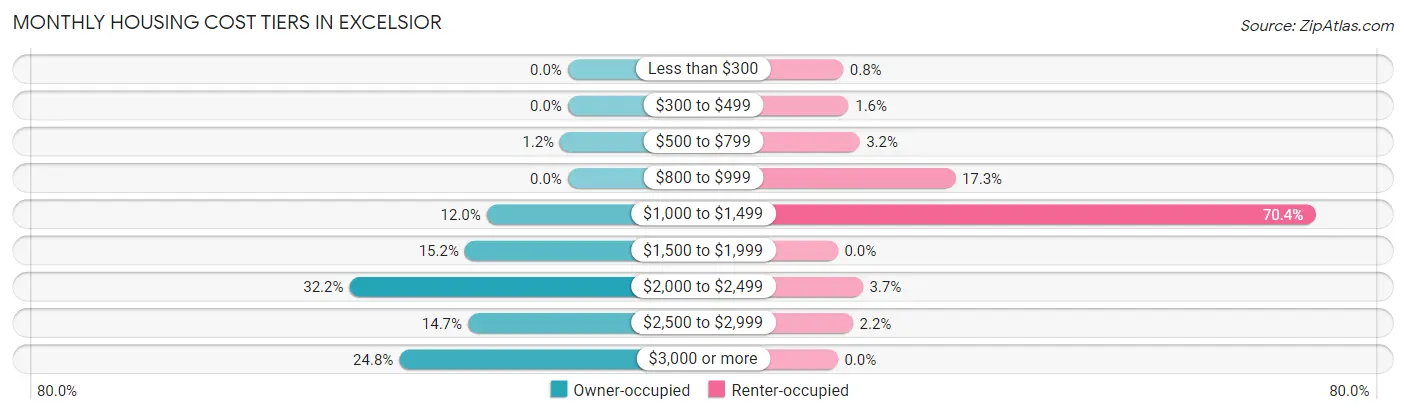
| Monthly Cost | Owner-occupied | Renter-occupied |
| Less than $300 | 0 (0.0%) | 5 (0.8%) |
| $300 to $499 | 0 (0.0%) | 10 (1.6%) |
| $500 to $799 | 5 (1.1%) | 20 (3.2%) |
| $800 to $999 | 0 (0.0%) | 108 (17.3%) |
| $1,000 to $1,499 | 52 (11.9%) | 439 (70.4%) |
| $1,500 to $1,999 | 66 (15.2%) | 0 (0.0%) |
| $2,000 to $2,499 | 140 (32.2%) | 23 (3.7%) |
| $2,500 to $2,999 | 64 (14.7%) | 14 (2.2%) |
| $3,000 or more | 108 (24.8%) | 0 (0.0%) |
| Total | 435 (100.0%) | 624 (100.0%) |
Physical Housing Characteristics in Excelsior
Housing Structures in Excelsior
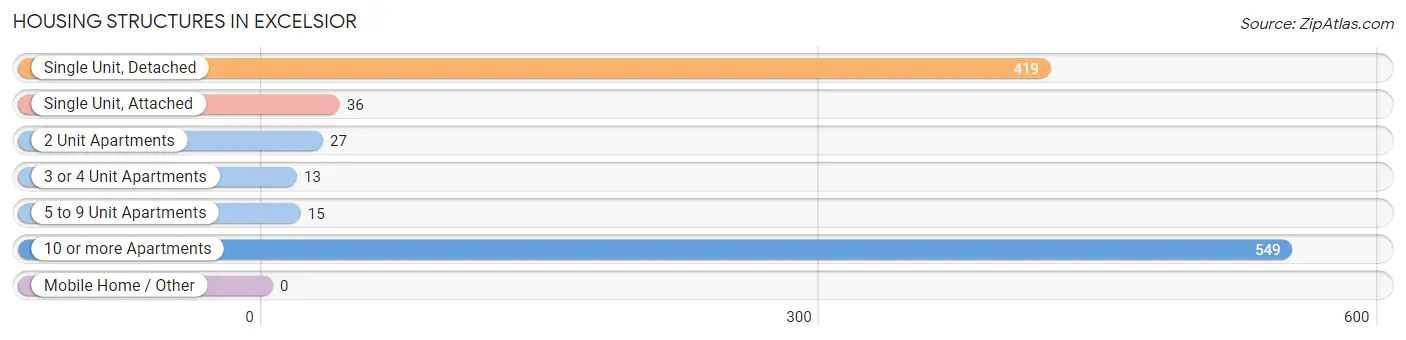
| Structure Type | # Housing Units | % Housing Units |
| Single Unit, Detached | 419 | 39.6% |
| Single Unit, Attached | 36 | 3.4% |
| 2 Unit Apartments | 27 | 2.5% |
| 3 or 4 Unit Apartments | 13 | 1.2% |
| 5 to 9 Unit Apartments | 15 | 1.4% |
| 10 or more Apartments | 549 | 51.8% |
| Mobile Home / Other | 0 | 0.0% |
| Total | 1,059 | 100.0% |
Housing Structures by Occupancy in Excelsior
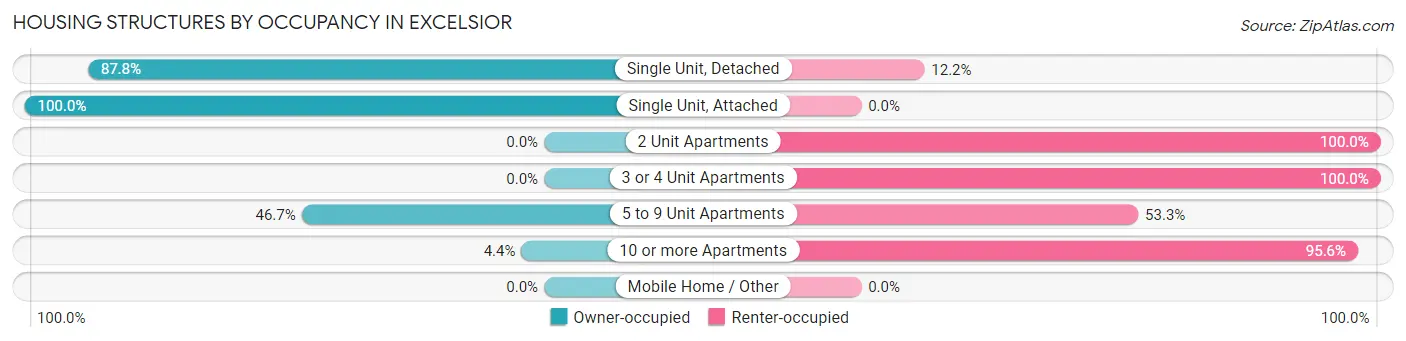
| Structure Type | Owner-occupied | Renter-occupied |
| Single Unit, Detached | 368 (87.8%) | 51 (12.2%) |
| Single Unit, Attached | 36 (100.0%) | 0 (0.0%) |
| 2 Unit Apartments | 0 (0.0%) | 27 (100.0%) |
| 3 or 4 Unit Apartments | 0 (0.0%) | 13 (100.0%) |
| 5 to 9 Unit Apartments | 7 (46.7%) | 8 (53.3%) |
| 10 or more Apartments | 24 (4.4%) | 525 (95.6%) |
| Mobile Home / Other | 0 (0.0%) | 0 (0.0%) |
| Total | 435 (41.1%) | 624 (58.9%) |
Housing Structures by Number of Rooms in Excelsior
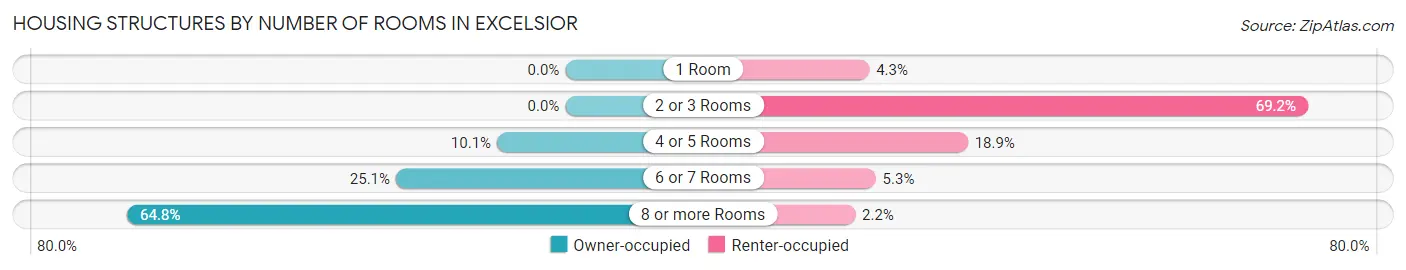
| Number of Rooms | Owner-occupied | Renter-occupied |
| 1 Room | 0 (0.0%) | 27 (4.3%) |
| 2 or 3 Rooms | 0 (0.0%) | 432 (69.2%) |
| 4 or 5 Rooms | 44 (10.1%) | 118 (18.9%) |
| 6 or 7 Rooms | 109 (25.1%) | 33 (5.3%) |
| 8 or more Rooms | 282 (64.8%) | 14 (2.2%) |
| Total | 435 (100.0%) | 624 (100.0%) |
Housing Structure by Heating Type in Excelsior
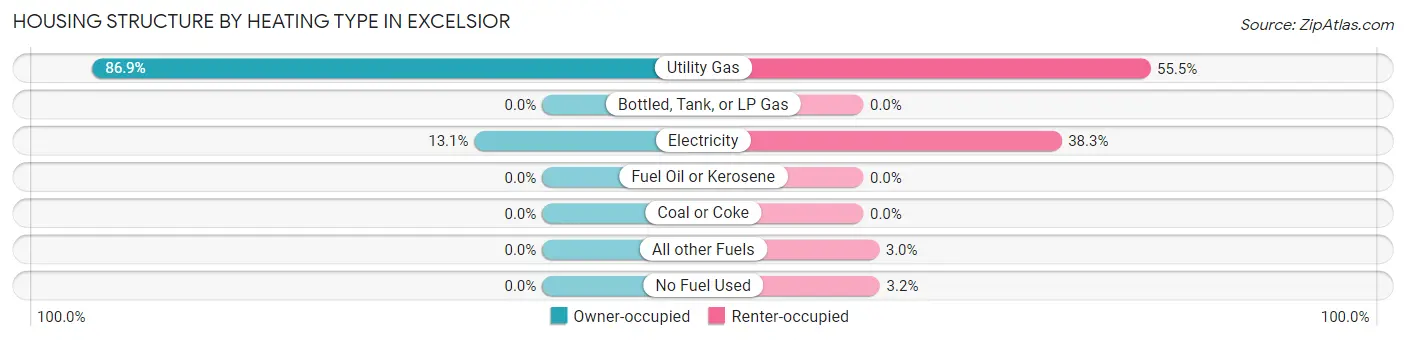
| Heating Type | Owner-occupied | Renter-occupied |
| Utility Gas | 378 (86.9%) | 346 (55.4%) |
| Bottled, Tank, or LP Gas | 0 (0.0%) | 0 (0.0%) |
| Electricity | 57 (13.1%) | 239 (38.3%) |
| Fuel Oil or Kerosene | 0 (0.0%) | 0 (0.0%) |
| Coal or Coke | 0 (0.0%) | 0 (0.0%) |
| All other Fuels | 0 (0.0%) | 19 (3.0%) |
| No Fuel Used | 0 (0.0%) | 20 (3.2%) |
| Total | 435 (100.0%) | 624 (100.0%) |
Household Vehicle Usage in Excelsior
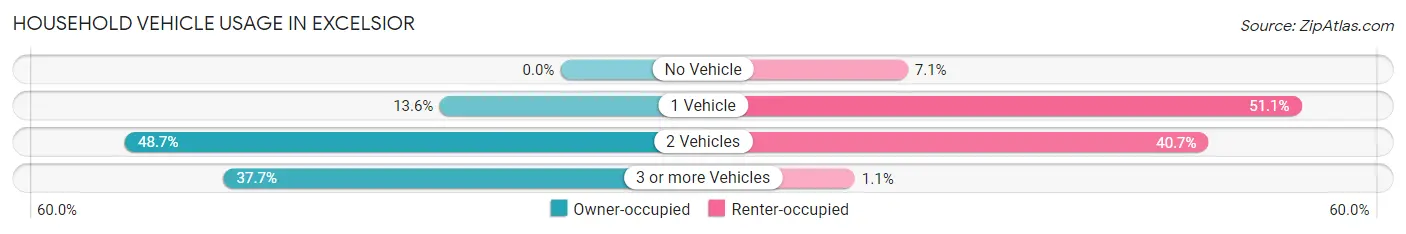
| Vehicles per Household | Owner-occupied | Renter-occupied |
| No Vehicle | 0 (0.0%) | 44 (7.0%) |
| 1 Vehicle | 59 (13.6%) | 319 (51.1%) |
| 2 Vehicles | 212 (48.7%) | 254 (40.7%) |
| 3 or more Vehicles | 164 (37.7%) | 7 (1.1%) |
| Total | 435 (100.0%) | 624 (100.0%) |
Real Estate & Mortgages in Excelsior
Real Estate and Mortgage Overview in Excelsior
| Characteristic | Without Mortgage | With Mortgage |
| Housing Units | 115 | 320 |
| Median Property Value | $675,000 | $1,032,100 |
| Median Household Income | - | - |
| Monthly Housing Costs | $1,501 | $104 |
| Real Estate Taxes | $8,821 | $0 |
Property Value by Mortgage Status in Excelsior
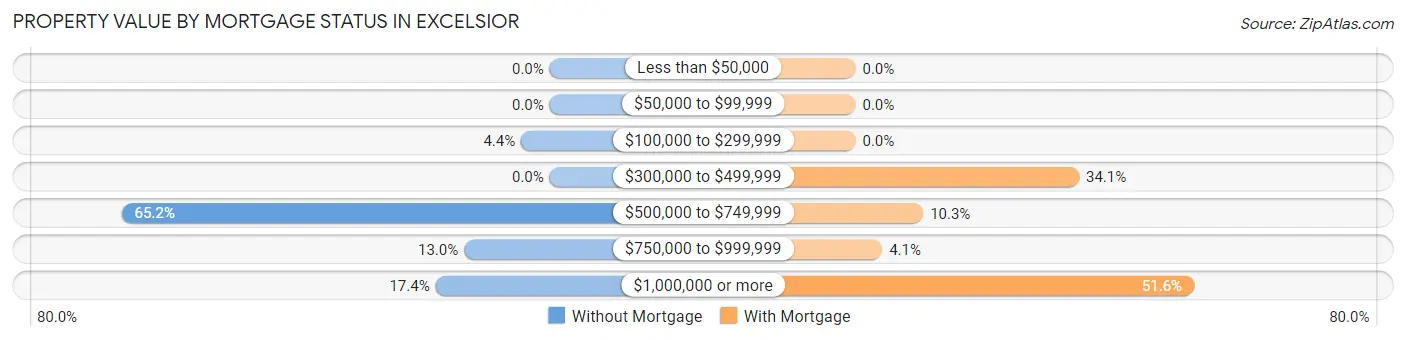
| Property Value | Without Mortgage | With Mortgage |
| Less than $50,000 | 0 (0.0%) | 0 (0.0%) |
| $50,000 to $99,999 | 0 (0.0%) | 0 (0.0%) |
| $100,000 to $299,999 | 5 (4.3%) | 0 (0.0%) |
| $300,000 to $499,999 | 0 (0.0%) | 109 (34.1%) |
| $500,000 to $749,999 | 75 (65.2%) | 33 (10.3%) |
| $750,000 to $999,999 | 15 (13.0%) | 13 (4.1%) |
| $1,000,000 or more | 20 (17.4%) | 165 (51.6%) |
| Total | 115 (100.0%) | 320 (100.0%) |
Household Income by Mortgage Status in Excelsior
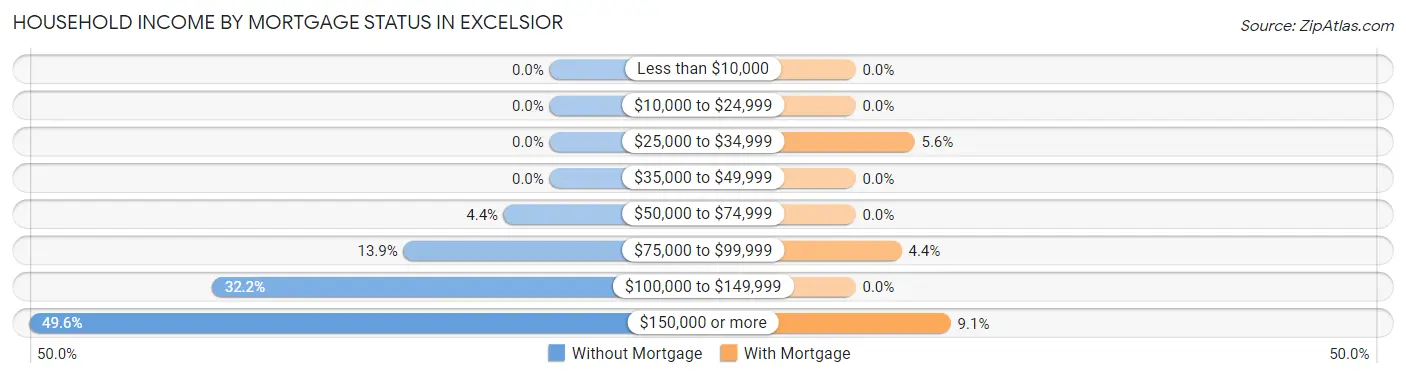
| Household Income | Without Mortgage | With Mortgage |
| Less than $10,000 | 0 (0.0%) | 0 (0.0%) |
| $10,000 to $24,999 | 0 (0.0%) | 0 (0.0%) |
| $25,000 to $34,999 | 0 (0.0%) | 18 (5.6%) |
| $35,000 to $49,999 | 0 (0.0%) | 0 (0.0%) |
| $50,000 to $74,999 | 5 (4.3%) | 0 (0.0%) |
| $75,000 to $99,999 | 16 (13.9%) | 14 (4.4%) |
| $100,000 to $149,999 | 37 (32.2%) | 0 (0.0%) |
| $150,000 or more | 57 (49.6%) | 29 (9.1%) |
| Total | 115 (100.0%) | 320 (100.0%) |
Property Value to Household Income Ratio in Excelsior
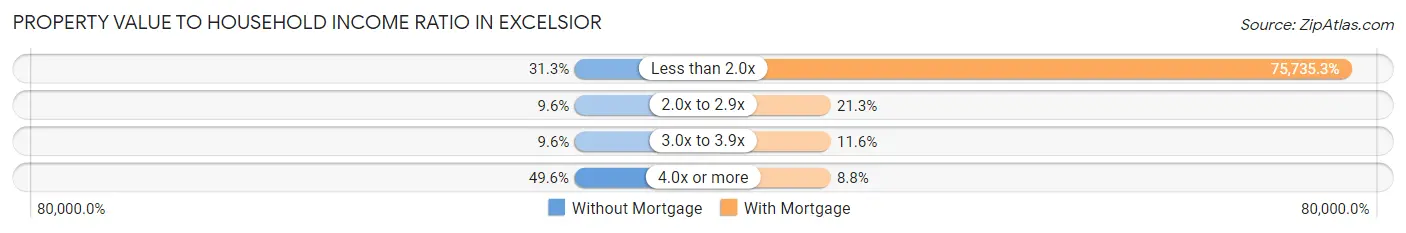
| Value-to-Income Ratio | Without Mortgage | With Mortgage |
| Less than 2.0x | 36 (31.3%) | 242,353 (75,735.3%) |
| 2.0x to 2.9x | 11 (9.6%) | 68 (21.2%) |
| 3.0x to 3.9x | 11 (9.6%) | 37 (11.6%) |
| 4.0x or more | 57 (49.6%) | 28 (8.7%) |
| Total | 115 (100.0%) | 320 (100.0%) |
Real Estate Taxes by Mortgage Status in Excelsior
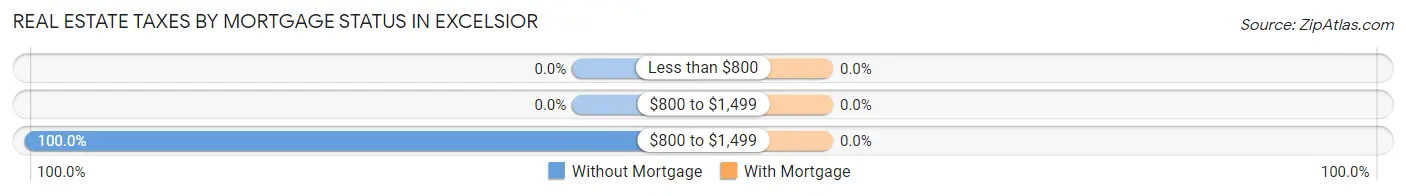
| Property Taxes | Without Mortgage | With Mortgage |
| Less than $800 | 0 (0.0%) | 0 (0.0%) |
| $800 to $1,499 | 0 (0.0%) | 0 (0.0%) |
| $800 to $1,499 | 115 (100.0%) | 0 (0.0%) |
| Total | 115 (100.0%) | 320 (100.0%) |
Health & Disability in Excelsior
Health Insurance Coverage by Age in Excelsior
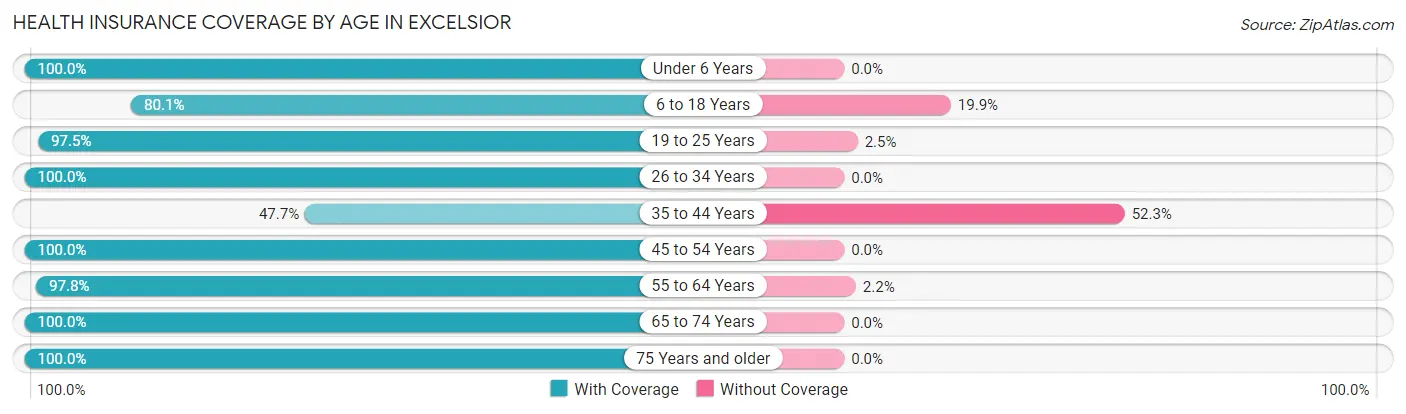
| Age Bracket | With Coverage | Without Coverage |
| Under 6 Years | 107 (100.0%) | 0 (0.0%) |
| 6 to 18 Years | 270 (80.1%) | 67 (19.9%) |
| 19 to 25 Years | 156 (97.5%) | 4 (2.5%) |
| 26 to 34 Years | 310 (100.0%) | 0 (0.0%) |
| 35 to 44 Years | 167 (47.7%) | 183 (52.3%) |
| 45 to 54 Years | 178 (100.0%) | 0 (0.0%) |
| 55 to 64 Years | 362 (97.8%) | 8 (2.2%) |
| 65 to 74 Years | 268 (100.0%) | 0 (0.0%) |
| 75 Years and older | 106 (100.0%) | 0 (0.0%) |
| Total | 1,924 (88.0%) | 262 (12.0%) |
Health Insurance Coverage by Citizenship Status in Excelsior
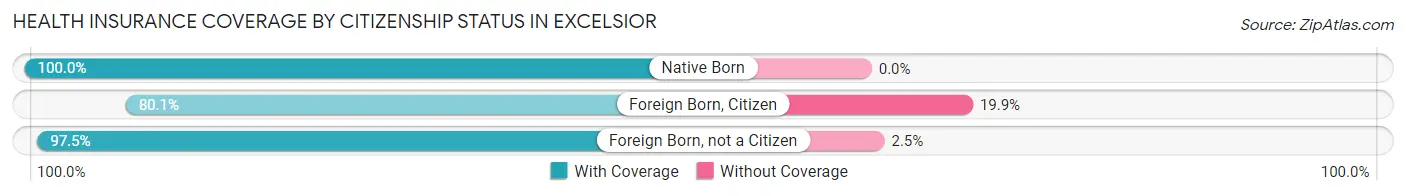
| Citizenship Status | With Coverage | Without Coverage |
| Native Born | 107 (100.0%) | 0 (0.0%) |
| Foreign Born, Citizen | 270 (80.1%) | 67 (19.9%) |
| Foreign Born, not a Citizen | 156 (97.5%) | 4 (2.5%) |
Health Insurance Coverage by Household Income in Excelsior
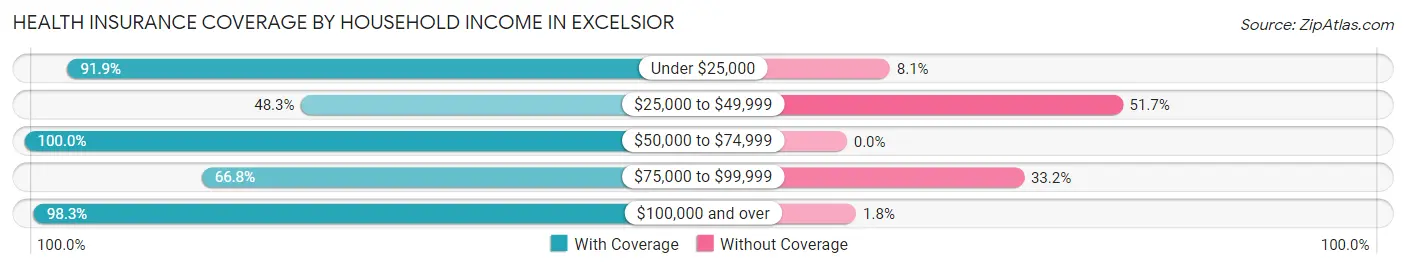
| Household Income | With Coverage | Without Coverage |
| Under $25,000 | 148 (91.9%) | 13 (8.1%) |
| $25,000 to $49,999 | 131 (48.3%) | 140 (51.7%) |
| $50,000 to $74,999 | 179 (100.0%) | 0 (0.0%) |
| $75,000 to $99,999 | 173 (66.8%) | 86 (33.2%) |
| $100,000 and over | 1,293 (98.3%) | 23 (1.8%) |
Public vs Private Health Insurance Coverage by Age in Excelsior
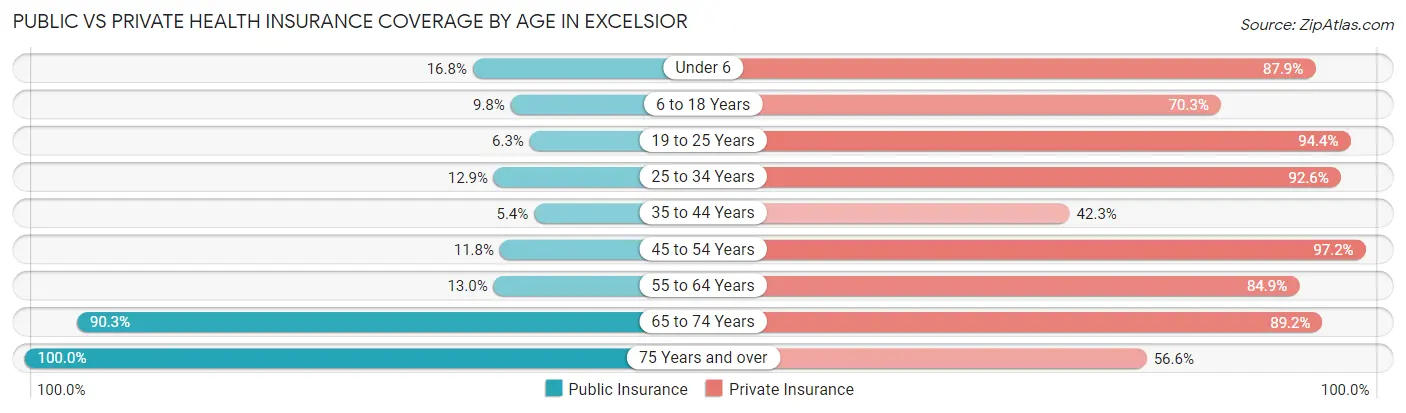
| Age Bracket | Public Insurance | Private Insurance |
| Under 6 | 18 (16.8%) | 94 (87.8%) |
| 6 to 18 Years | 33 (9.8%) | 237 (70.3%) |
| 19 to 25 Years | 10 (6.2%) | 151 (94.4%) |
| 25 to 34 Years | 40 (12.9%) | 287 (92.6%) |
| 35 to 44 Years | 19 (5.4%) | 148 (42.3%) |
| 45 to 54 Years | 21 (11.8%) | 173 (97.2%) |
| 55 to 64 Years | 48 (13.0%) | 314 (84.9%) |
| 65 to 74 Years | 242 (90.3%) | 239 (89.2%) |
| 75 Years and over | 106 (100.0%) | 60 (56.6%) |
| Total | 537 (24.6%) | 1,703 (77.9%) |
Disability Status by Sex by Age in Excelsior
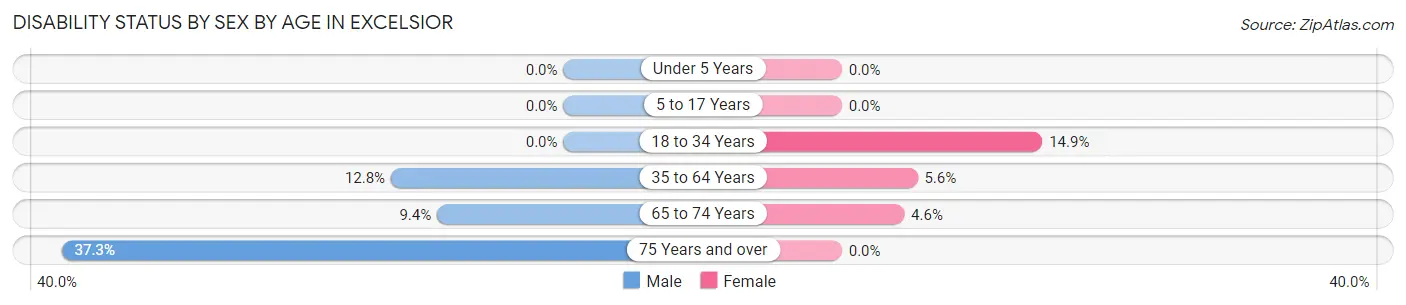
| Age Bracket | Male | Female |
| Under 5 Years | 0 (0.0%) | 0 (0.0%) |
| 5 to 17 Years | 0 (0.0%) | 0 (0.0%) |
| 18 to 34 Years | 0 (0.0%) | 32 (14.9%) |
| 35 to 64 Years | 58 (12.8%) | 25 (5.6%) |
| 65 to 74 Years | 15 (9.4%) | 5 (4.6%) |
| 75 Years and over | 19 (37.2%) | 0 (0.0%) |
Disability Class by Sex by Age in Excelsior
Disability Class: Hearing Difficulty
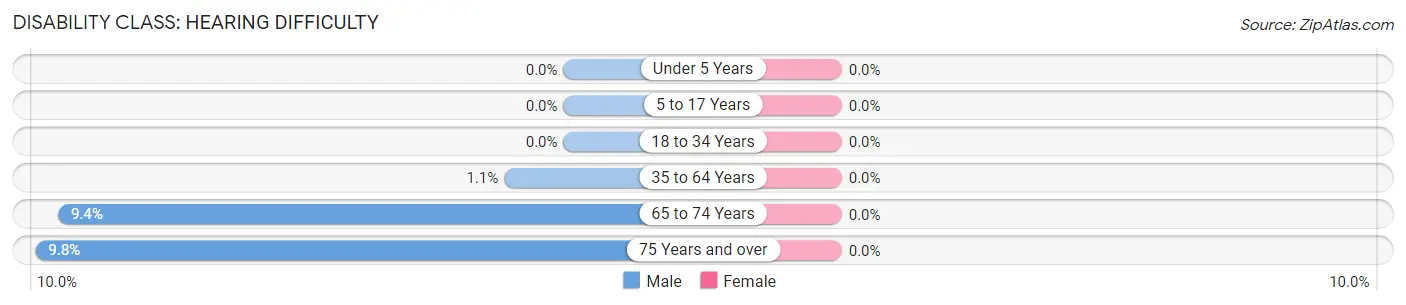
| Age Bracket | Male | Female |
| Under 5 Years | 0 (0.0%) | 0 (0.0%) |
| 5 to 17 Years | 0 (0.0%) | 0 (0.0%) |
| 18 to 34 Years | 0 (0.0%) | 0 (0.0%) |
| 35 to 64 Years | 5 (1.1%) | 0 (0.0%) |
| 65 to 74 Years | 15 (9.4%) | 0 (0.0%) |
| 75 Years and over | 5 (9.8%) | 0 (0.0%) |
Disability Class: Vision Difficulty
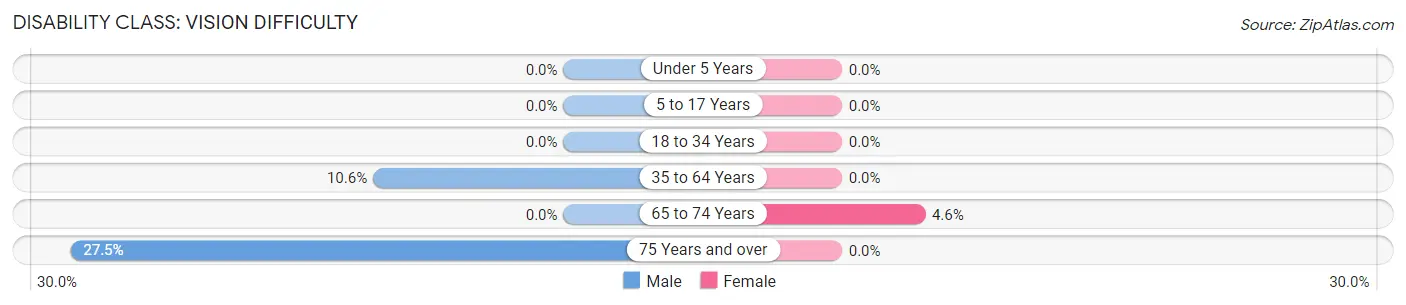
| Age Bracket | Male | Female |
| Under 5 Years | 0 (0.0%) | 0 (0.0%) |
| 5 to 17 Years | 0 (0.0%) | 0 (0.0%) |
| 18 to 34 Years | 0 (0.0%) | 0 (0.0%) |
| 35 to 64 Years | 48 (10.6%) | 0 (0.0%) |
| 65 to 74 Years | 0 (0.0%) | 5 (4.6%) |
| 75 Years and over | 14 (27.5%) | 0 (0.0%) |
Disability Class: Cognitive Difficulty
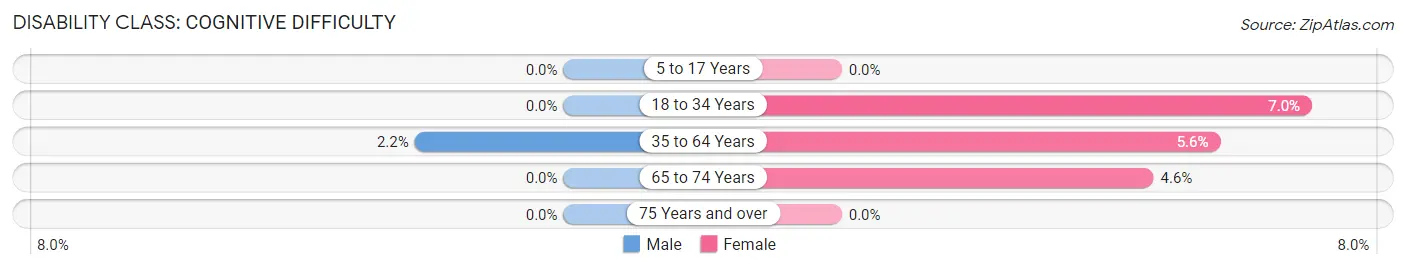
| Age Bracket | Male | Female |
| 5 to 17 Years | 0 (0.0%) | 0 (0.0%) |
| 18 to 34 Years | 0 (0.0%) | 15 (7.0%) |
| 35 to 64 Years | 10 (2.2%) | 25 (5.6%) |
| 65 to 74 Years | 0 (0.0%) | 5 (4.6%) |
| 75 Years and over | 0 (0.0%) | 0 (0.0%) |
Disability Class: Ambulatory Difficulty
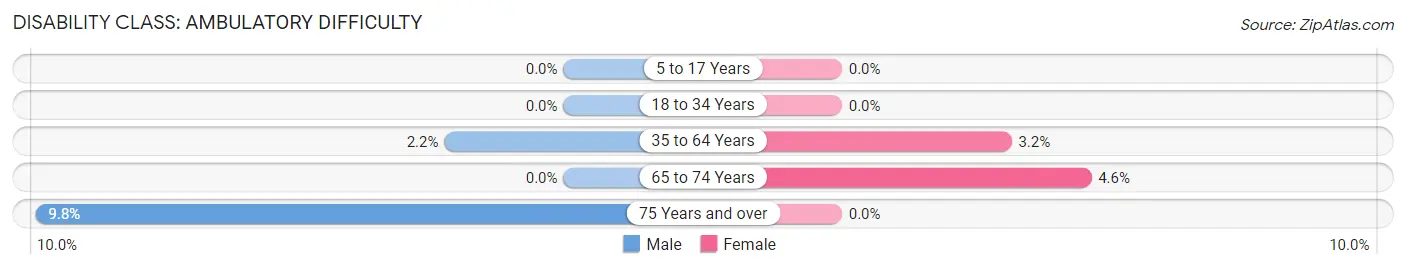
| Age Bracket | Male | Female |
| 5 to 17 Years | 0 (0.0%) | 0 (0.0%) |
| 18 to 34 Years | 0 (0.0%) | 0 (0.0%) |
| 35 to 64 Years | 10 (2.2%) | 14 (3.2%) |
| 65 to 74 Years | 0 (0.0%) | 5 (4.6%) |
| 75 Years and over | 5 (9.8%) | 0 (0.0%) |
Disability Class: Self-Care Difficulty
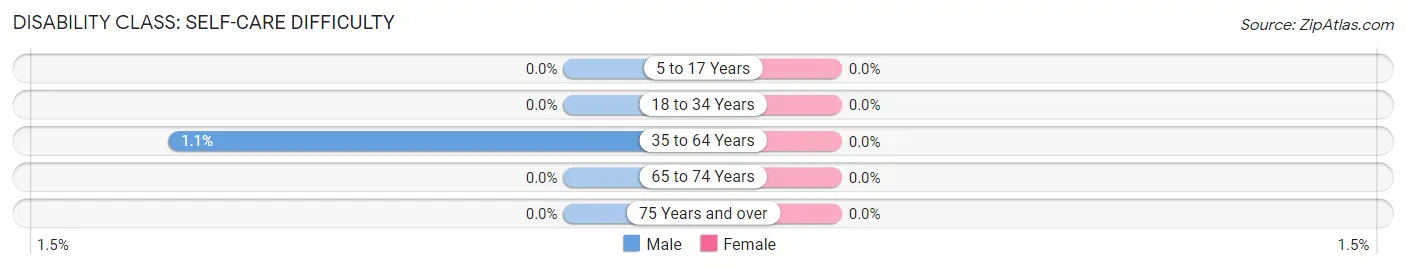
| Age Bracket | Male | Female |
| 5 to 17 Years | 0 (0.0%) | 0 (0.0%) |
| 18 to 34 Years | 0 (0.0%) | 0 (0.0%) |
| 35 to 64 Years | 5 (1.1%) | 0 (0.0%) |
| 65 to 74 Years | 0 (0.0%) | 0 (0.0%) |
| 75 Years and over | 0 (0.0%) | 0 (0.0%) |
Technology Access in Excelsior
Computing Device Access in Excelsior
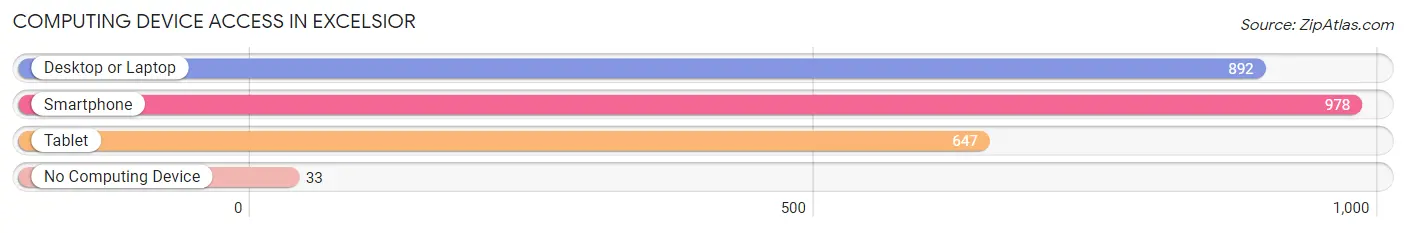
| Device Type | # Households | % Households |
| Desktop or Laptop | 892 | 84.2% |
| Smartphone | 978 | 92.3% |
| Tablet | 647 | 61.1% |
| No Computing Device | 33 | 3.1% |
| Total | 1,059 | 100.0% |
Internet Access in Excelsior
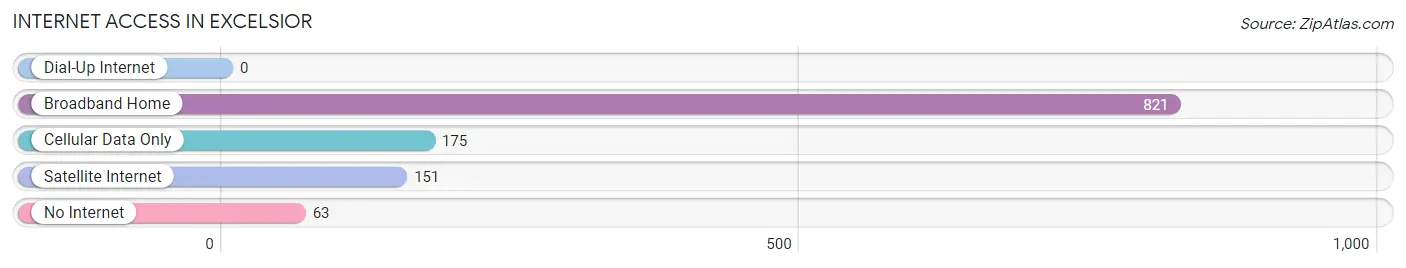
| Internet Type | # Households | % Households |
| Dial-Up Internet | 0 | 0.0% |
| Broadband Home | 821 | 77.5% |
| Cellular Data Only | 175 | 16.5% |
| Satellite Internet | 151 | 14.3% |
| No Internet | 63 | 5.9% |
| Total | 1,059 | 100.0% |
Excelsior Summary
Excelsior, Minnesota is a small city located in Hennepin County, Minnesota, United States. It is situated on the western shore of Lake Minnetonka, about 20 miles west of Minneapolis. The city has a population of 2,188 as of the 2010 census.
History
Excelsior was founded in 1853 by a group of settlers from New England. The town was named after the Latin phrase “Excelsior,” which means “ever upward.” The settlers were attracted to the area by its natural beauty and the abundance of fish and game in the area.
The town was incorporated in 1858 and quickly became a popular summer resort destination. The first hotel was built in 1859 and the first steamboat began operating on Lake Minnetonka in 1860. The town was connected to Minneapolis by rail in 1867, which further increased its popularity as a tourist destination.
In the late 19th century, Excelsior became a popular destination for wealthy Minneapolis residents. Many of the town’s grand Victorian homes were built during this period. The town also became a popular destination for artists, writers, and musicians.
Geography
Excelsior is located in Hennepin County, Minnesota, United States. It is situated on the western shore of Lake Minnetonka, about 20 miles west of Minneapolis. The city has a total area of 1.2 square miles, all of which is land.
The city is located in the Minneapolis-St. Paul metropolitan area. It is bordered by the cities of Shorewood, Deephaven, Greenwood, and Tonka Bay.
Economy
Excelsior’s economy is largely based on tourism and retail. The city is home to several popular restaurants, shops, and boutiques. It is also home to several marinas, which attract visitors from all over the region.
The city is also home to several corporate headquarters, including Cargill, Inc., and the Carlson Companies.
Demographics
As of the 2010 census, Excelsior had a population of 2,188. The racial makeup of the city was 94.2% White, 0.7% African American, 0.2% Native American, 2.2% Asian, 0.1% Pacific Islander, 0.7% from other races, and 1.9% from two or more races. Hispanic or Latino of any race were 2.2% of the population.
The median income for a household in the city was $76,944, and the median income for a family was $90,944. The per capita income for the city was $41,944. About 2.2% of families and 3.2% of the population were below the poverty line, including 3.2% of those under age 18 and 4.2% of those age 65 or over.
Common Questions
What is Per Capita Income in Excelsior?
Per Capita income in Excelsior is $73,823.
What is the Median Family Income in Excelsior?
Median Family Income in Excelsior is $117,314.
What is the Median Household income in Excelsior?
Median Household Income in Excelsior is $92,148.
What is Income or Wage Gap in Excelsior?
Income or Wage Gap in Excelsior is 19.9%.
Women in Excelsior earn 80.1 cents for every dollar earned by a man.
What is Inequality or Gini Index in Excelsior?
Inequality or Gini Index in Excelsior is 0.53.
What is the Total Population of Excelsior?
Total Population of Excelsior is 2,257.
What is the Total Male Population of Excelsior?
Total Male Population of Excelsior is 1,192.
What is the Total Female Population of Excelsior?
Total Female Population of Excelsior is 1,065.
What is the Ratio of Males per 100 Females in Excelsior?
There are 111.92 Males per 100 Females in Excelsior.
What is the Ratio of Females per 100 Males in Excelsior?
There are 89.35 Females per 100 Males in Excelsior.
What is the Median Population Age in Excelsior?
Median Population Age in Excelsior is 41.2 Years.
What is the Average Family Size in Excelsior
Average Family Size in Excelsior is 2.6 People.
What is the Average Household Size in Excelsior
Average Household Size in Excelsior is 2.1 People.
How Large is the Labor Force in Excelsior?
There are 1,503 People in the Labor Forcein in Excelsior.
What is the Percentage of People in the Labor Force in Excelsior?
80.1% of People are in the Labor Force in Excelsior.
What is the Unemployment Rate in Excelsior?
Unemployment Rate in Excelsior is 1.0%.