Park Rapids, MN Map & Demographics
Park Rapids Map
Park Rapids Overview
$32,320
PER CAPITA INCOME
$57,639
AVG FAMILY INCOME
$42,892
AVG HOUSEHOLD INCOME
27.5%
WAGE / INCOME GAP [ % ]
72.5¢/ $1
WAGE / INCOME GAP [ $ ]
0.54
INEQUALITY / GINI INDEX
4,163
TOTAL POPULATION
2,048
MALE POPULATION
2,115
FEMALE POPULATION
96.83
MALES / 100 FEMALES
103.27
FEMALES / 100 MALES
43.1
MEDIAN AGE
2.8
AVG FAMILY SIZE
2.1
AVG HOUSEHOLD SIZE
2,028
LABOR FORCE [ PEOPLE ]
58.3%
PERCENT IN LABOR FORCE
5.2%
UNEMPLOYMENT RATE
Park Rapids Zip Codes
Park Rapids Area Codes
Income in Park Rapids
Income Overview in Park Rapids
Per Capita Income in Park Rapids is $32,320, while median incomes of families and households are $57,639 and $42,892 respectively.
| Characteristic | Number | Measure |
| Per Capita Income | 4,163 | $32,320 |
| Median Family Income | 934 | $57,639 |
| Mean Family Income | 934 | $74,325 |
| Median Household Income | 1,857 | $42,892 |
| Mean Household Income | 1,857 | $71,897 |
| Income Deficit | 934 | $0 |
| Wage / Income Gap (%) | 4,163 | 27.54% |
| Wage / Income Gap ($) | 4,163 | 72.46¢ per $1 |
| Gini / Inequality Index | 4,163 | 0.54 |
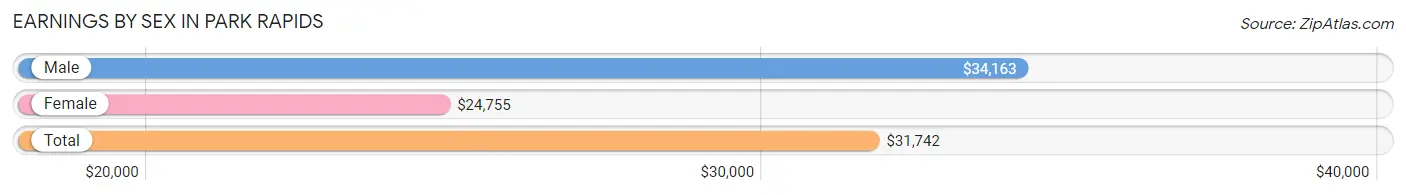
Earnings by Sex in Park Rapids
Average Earnings in Park Rapids are $31,742, $34,163 for men and $24,755 for women, a difference of 27.5%.
| Sex | Number | Average Earnings |
| Male | 1,193 (56.4%) | $34,163 |
| Female | 921 (43.6%) | $24,755 |
| Total | 2,114 (100.0%) | $31,742 |
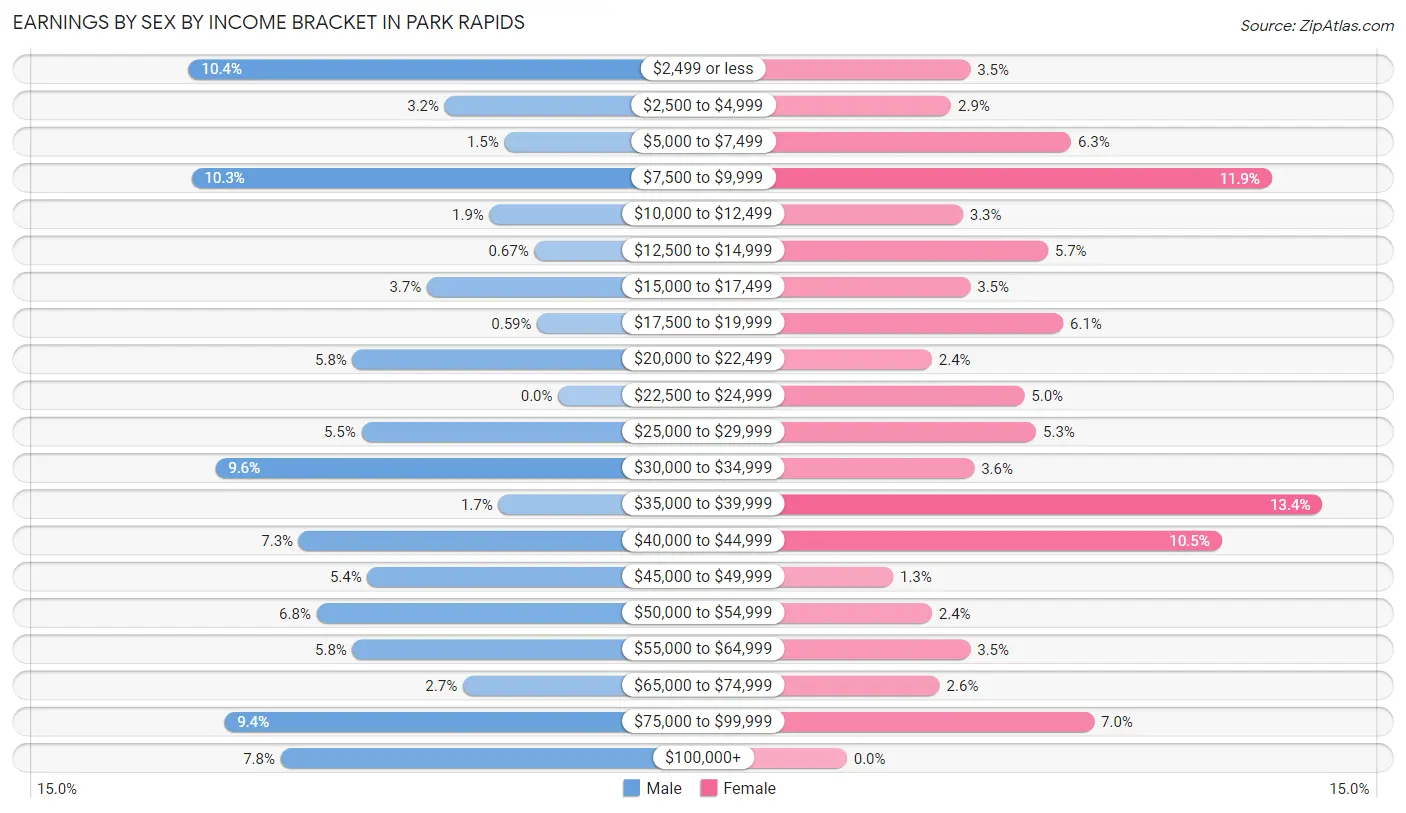
Earnings by Sex by Income Bracket in Park Rapids
The most common earnings brackets in Park Rapids are $2,499 or less for men (124 | 10.4%) and $35,000 to $39,999 for women (123 | 13.4%).
| Income | Male | Female |
| $2,499 or less | 124 (10.4%) | 32 (3.5%) |
| $2,500 to $4,999 | 38 (3.2%) | 27 (2.9%) |
| $5,000 to $7,499 | 18 (1.5%) | 58 (6.3%) |
| $7,500 to $9,999 | 123 (10.3%) | 110 (11.9%) |
| $10,000 to $12,499 | 23 (1.9%) | 30 (3.3%) |
| $12,500 to $14,999 | 8 (0.7%) | 52 (5.7%) |
| $15,000 to $17,499 | 44 (3.7%) | 32 (3.5%) |
| $17,500 to $19,999 | 7 (0.6%) | 56 (6.1%) |
| $20,000 to $22,499 | 69 (5.8%) | 22 (2.4%) |
| $22,500 to $24,999 | 0 (0.0%) | 46 (5.0%) |
| $25,000 to $29,999 | 66 (5.5%) | 49 (5.3%) |
| $30,000 to $34,999 | 115 (9.6%) | 33 (3.6%) |
| $35,000 to $39,999 | 20 (1.7%) | 123 (13.4%) |
| $40,000 to $44,999 | 87 (7.3%) | 97 (10.5%) |
| $45,000 to $49,999 | 64 (5.4%) | 12 (1.3%) |
| $50,000 to $54,999 | 81 (6.8%) | 22 (2.4%) |
| $55,000 to $64,999 | 69 (5.8%) | 32 (3.5%) |
| $65,000 to $74,999 | 32 (2.7%) | 24 (2.6%) |
| $75,000 to $99,999 | 112 (9.4%) | 64 (7.0%) |
| $100,000+ | 93 (7.8%) | 0 (0.0%) |
| Total | 1,193 (100.0%) | 921 (100.0%) |
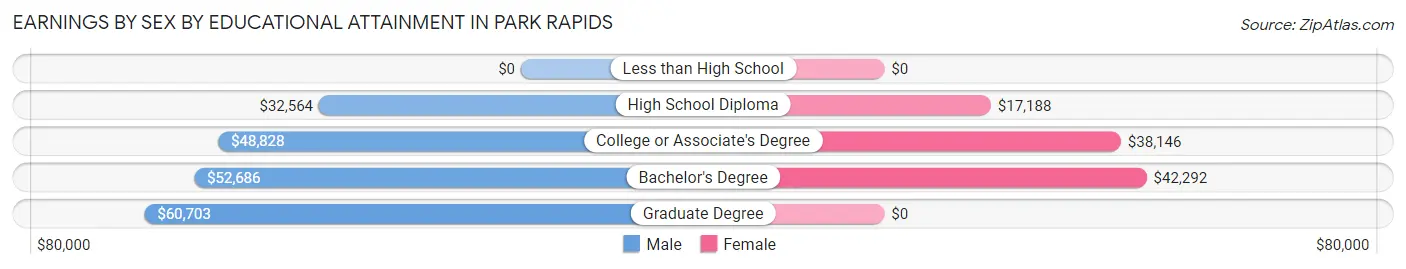
Earnings by Sex by Educational Attainment in Park Rapids
Average earnings in Park Rapids are $43,875 for men and $30,076 for women, a difference of 31.5%. Men with an educational attainment of graduate degree enjoy the highest average annual earnings of $60,703, while those with high school diploma education earn the least with $32,564. Women with an educational attainment of bachelor's degree earn the most with the average annual earnings of $42,292, while those with high school diploma education have the smallest earnings of $17,188.
| Educational Attainment | Male Income | Female Income |
| Less than High School | - | - |
| High School Diploma | $32,564 | $17,188 |
| College or Associate's Degree | $48,828 | $38,146 |
| Bachelor's Degree | $52,686 | $42,292 |
| Graduate Degree | $60,703 | $0 |
| Total | $43,875 | $30,076 |
Family Income in Park Rapids
Family Income Brackets in Park Rapids
According to the Park Rapids family income data, there are 191 families falling into the $50,000 to $74,999 income range, which is the most common income bracket and makes up 20.4% of all families. Conversely, the less than $10,000 income bracket is the least frequent group with only 15 families (1.6%) belonging to this category.
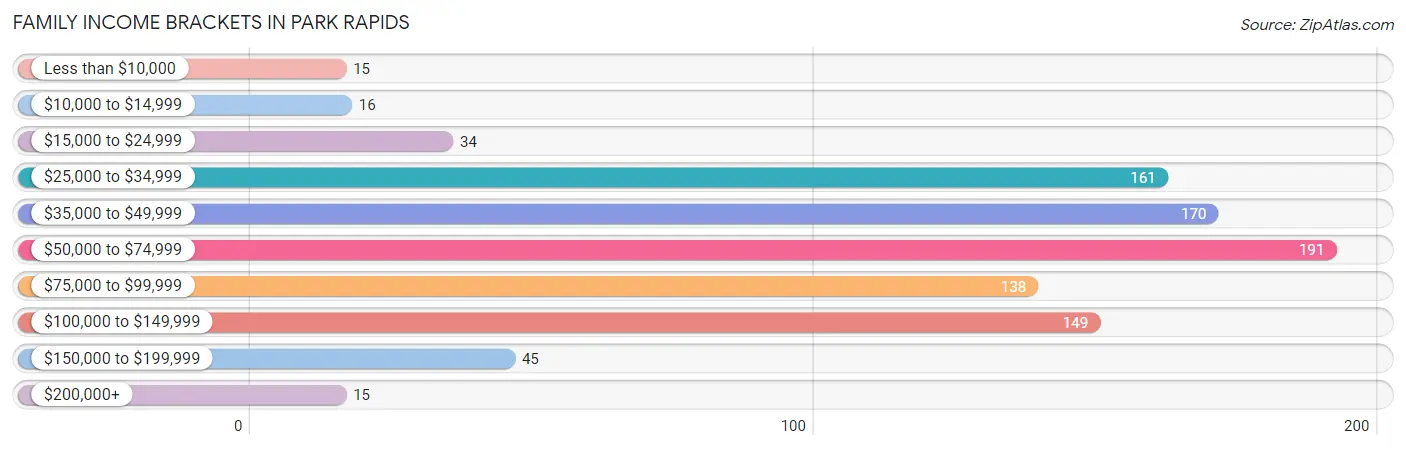
| Income Bracket | # Families | % Families |
| Less than $10,000 | 15 | 1.6% |
| $10,000 to $14,999 | 16 | 1.7% |
| $15,000 to $24,999 | 34 | 3.6% |
| $25,000 to $34,999 | 161 | 17.2% |
| $35,000 to $49,999 | 170 | 18.2% |
| $50,000 to $74,999 | 191 | 20.4% |
| $75,000 to $99,999 | 138 | 14.8% |
| $100,000 to $149,999 | 149 | 16.0% |
| $150,000 to $199,999 | 45 | 4.8% |
| $200,000+ | 15 | 1.6% |
Family Income by Famaliy Size in Park Rapids
4-person families (98 | 10.5%) account for the highest median family income in Park Rapids with $148,929 per family, while 4-person families (98 | 10.5%) have the highest median income of $37,232 per family member.
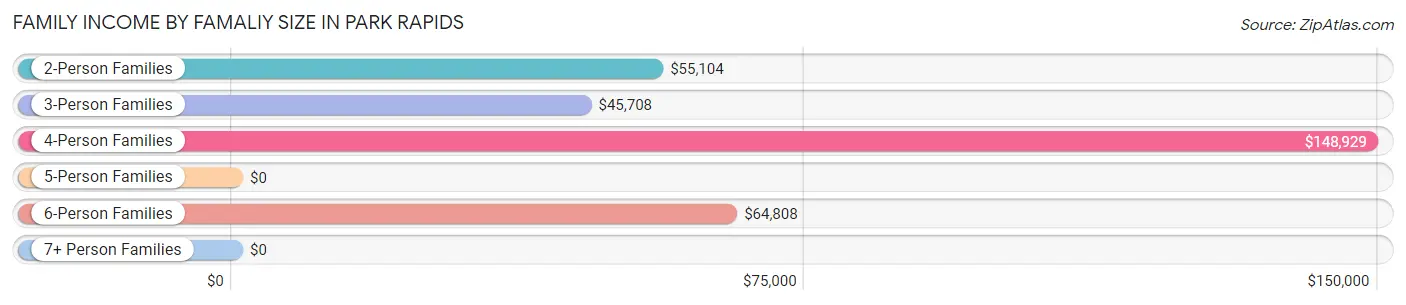
| Income Bracket | # Families | Median Income |
| 2-Person Families | 529 (56.6%) | $55,104 |
| 3-Person Families | 229 (24.5%) | $45,708 |
| 4-Person Families | 98 (10.5%) | $148,929 |
| 5-Person Families | 40 (4.3%) | $0 |
| 6-Person Families | 24 (2.6%) | $64,808 |
| 7+ Person Families | 14 (1.5%) | $0 |
| Total | 934 (100.0%) | $57,639 |
Family Income by Number of Earners in Park Rapids
The median family income in Park Rapids is $57,639, with families comprising 3+ earners (118) having the highest median family income of $134,474, while families with 1 earner (344) have the lowest median family income of $46,000, accounting for 12.6% and 36.8% of families, respectively.
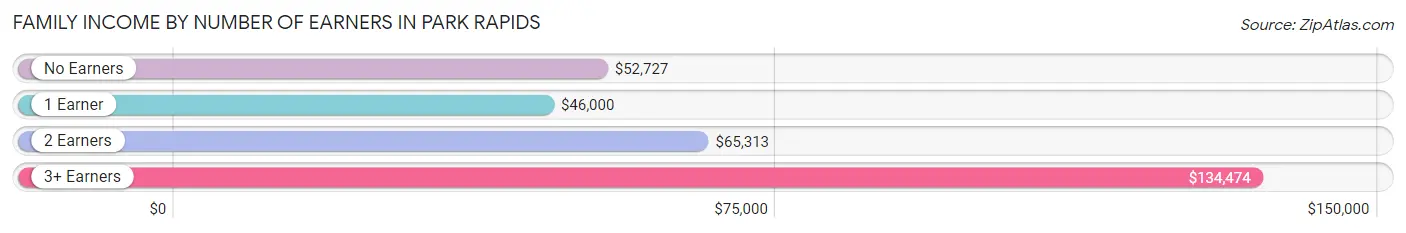
| Number of Earners | # Families | Median Income |
| No Earners | 186 (19.9%) | $52,727 |
| 1 Earner | 344 (36.8%) | $46,000 |
| 2 Earners | 286 (30.6%) | $65,313 |
| 3+ Earners | 118 (12.6%) | $134,474 |
| Total | 934 (100.0%) | $57,639 |
Household Income in Park Rapids
Household Income Brackets in Park Rapids
With 299 households falling in the category, the $50,000 to $74,999 income range is the most frequent in Park Rapids, accounting for 16.1% of all households. In contrast, only 41 households (2.2%) fall into the $200,000+ income bracket, making it the least populous group.
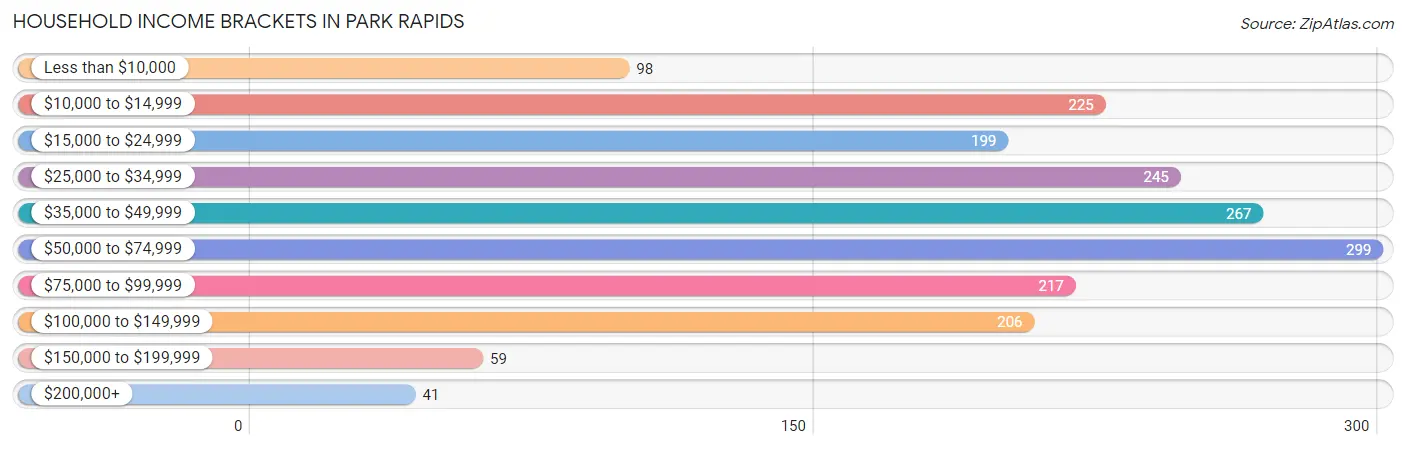
| Income Bracket | # Households | % Households |
| Less than $10,000 | 98 | 5.3% |
| $10,000 to $14,999 | 225 | 12.1% |
| $15,000 to $24,999 | 199 | 10.7% |
| $25,000 to $34,999 | 245 | 13.2% |
| $35,000 to $49,999 | 267 | 14.4% |
| $50,000 to $74,999 | 299 | 16.1% |
| $75,000 to $99,999 | 217 | 11.7% |
| $100,000 to $149,999 | 206 | 11.1% |
| $150,000 to $199,999 | 59 | 3.2% |
| $200,000+ | 41 | 2.2% |
Household Income by Householder Age in Park Rapids
The median household income in Park Rapids is $42,892, with the highest median household income of $66,875 found in the 25 to 44 years age bracket for the primary householder. A total of 419 households (22.6%) fall into this category. Meanwhile, the 15 to 24 years age bracket for the primary householder has the lowest median household income of $31,029, with 156 households (8.4%) in this group.
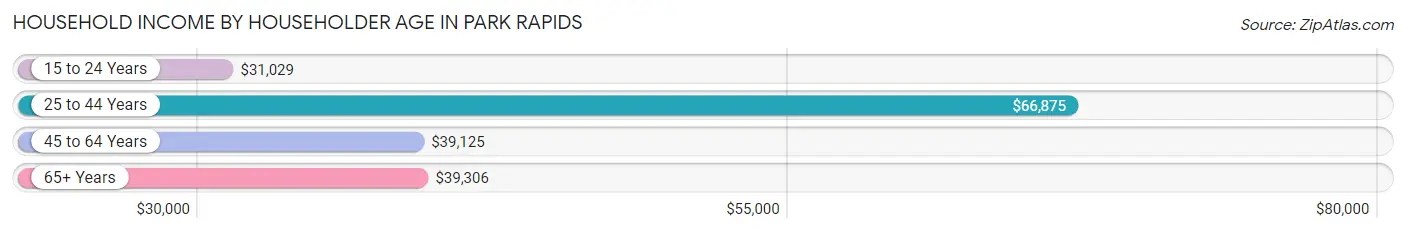
| Income Bracket | # Households | Median Income |
| 15 to 24 Years | 156 (8.4%) | $31,029 |
| 25 to 44 Years | 419 (22.6%) | $66,875 |
| 45 to 64 Years | 641 (34.5%) | $39,125 |
| 65+ Years | 641 (34.5%) | $39,306 |
| Total | 1,857 (100.0%) | $42,892 |
Poverty in Park Rapids
Income Below Poverty by Sex and Age in Park Rapids
With 17.1% poverty level for males and 13.9% for females among the residents of Park Rapids, 18 to 24 year old males and 55 to 64 year old females are the most vulnerable to poverty, with 80 males (41.9%) and 67 females (27.9%) in their respective age groups living below the poverty level.
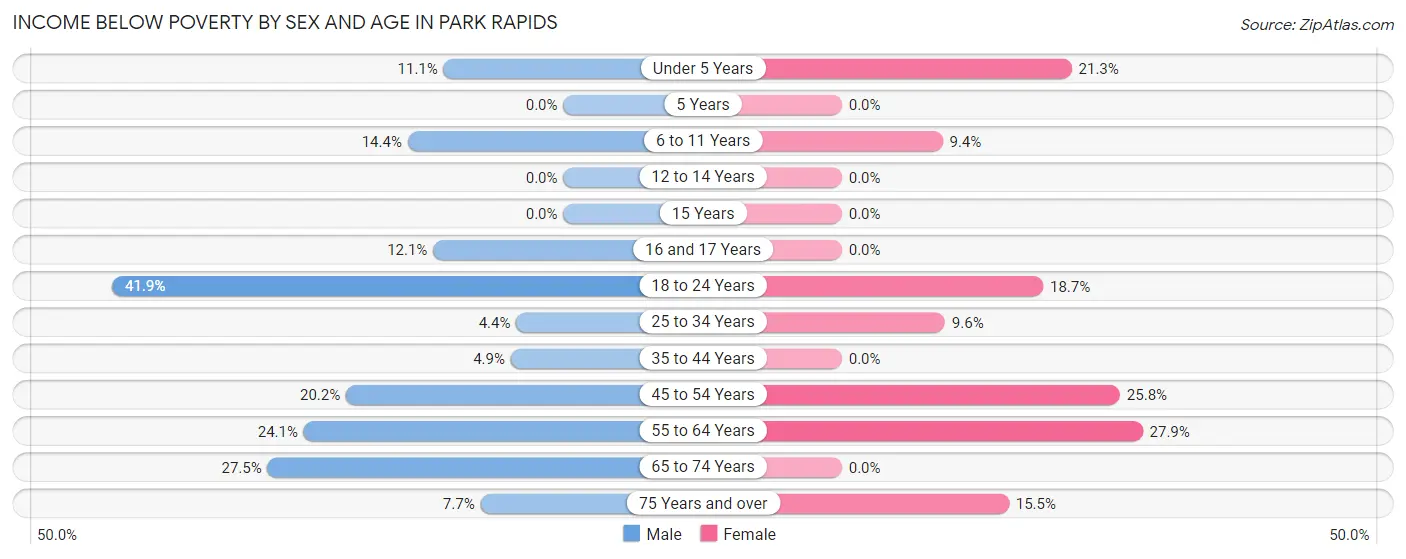
| Age Bracket | Male | Female |
| Under 5 Years | 12 (11.1%) | 32 (21.3%) |
| 5 Years | 0 (0.0%) | 0 (0.0%) |
| 6 to 11 Years | 13 (14.4%) | 13 (9.3%) |
| 12 to 14 Years | 0 (0.0%) | 0 (0.0%) |
| 15 Years | 0 (0.0%) | 0 (0.0%) |
| 16 and 17 Years | 18 (12.1%) | 0 (0.0%) |
| 18 to 24 Years | 80 (41.9%) | 34 (18.7%) |
| 25 to 34 Years | 9 (4.4%) | 27 (9.6%) |
| 35 to 44 Years | 14 (4.9%) | 0 (0.0%) |
| 45 to 54 Years | 47 (20.2%) | 56 (25.8%) |
| 55 to 64 Years | 53 (24.1%) | 67 (27.9%) |
| 65 to 74 Years | 70 (27.5%) | 0 (0.0%) |
| 75 Years and over | 12 (7.7%) | 51 (15.5%) |
| Total | 328 (17.1%) | 280 (13.9%) |
Income Above Poverty by Sex and Age in Park Rapids
According to the poverty statistics in Park Rapids, males aged 5 years and females aged 5 years are the age groups that are most secure financially, with 100.0% of males and 100.0% of females in these age groups living above the poverty line.
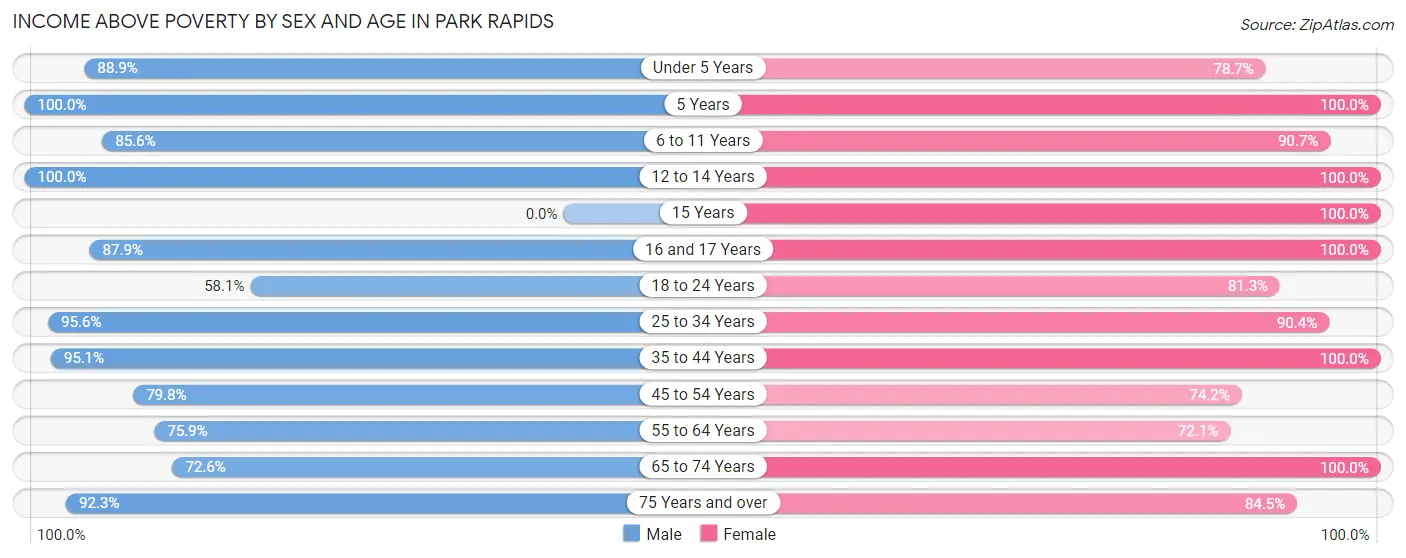
| Age Bracket | Male | Female |
| Under 5 Years | 96 (88.9%) | 118 (78.7%) |
| 5 Years | 15 (100.0%) | 17 (100.0%) |
| 6 to 11 Years | 77 (85.6%) | 126 (90.6%) |
| 12 to 14 Years | 14 (100.0%) | 74 (100.0%) |
| 15 Years | 0 (0.0%) | 15 (100.0%) |
| 16 and 17 Years | 131 (87.9%) | 42 (100.0%) |
| 18 to 24 Years | 111 (58.1%) | 148 (81.3%) |
| 25 to 34 Years | 197 (95.6%) | 255 (90.4%) |
| 35 to 44 Years | 273 (95.1%) | 156 (100.0%) |
| 45 to 54 Years | 186 (79.8%) | 161 (74.2%) |
| 55 to 64 Years | 167 (75.9%) | 173 (72.1%) |
| 65 to 74 Years | 185 (72.6%) | 177 (100.0%) |
| 75 Years and over | 144 (92.3%) | 278 (84.5%) |
| Total | 1,596 (83.0%) | 1,740 (86.1%) |
Income Below Poverty Among Married-Couple Families in Park Rapids
The poverty statistics for married-couple families in Park Rapids show that 8.0% or 45 of the total 560 families live below the poverty line. Families with 3 or 4 children have the highest poverty rate of 35.9%, comprising of 14 families. On the other hand, families with 1 or 2 children have the lowest poverty rate of 2.7%, which includes 5 families.
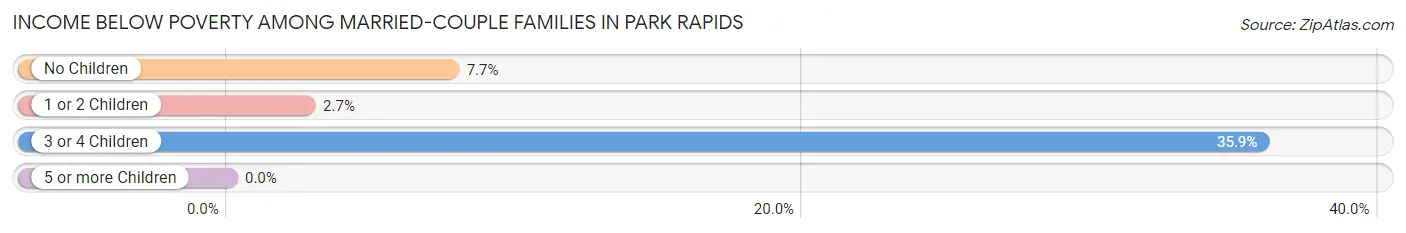
| Children | Above Poverty | Below Poverty |
| No Children | 311 (92.3%) | 26 (7.7%) |
| 1 or 2 Children | 179 (97.3%) | 5 (2.7%) |
| 3 or 4 Children | 25 (64.1%) | 14 (35.9%) |
| 5 or more Children | 0 (0.0%) | 0 (0.0%) |
| Total | 515 (92.0%) | 45 (8.0%) |
Income Below Poverty Among Single-Parent Households in Park Rapids
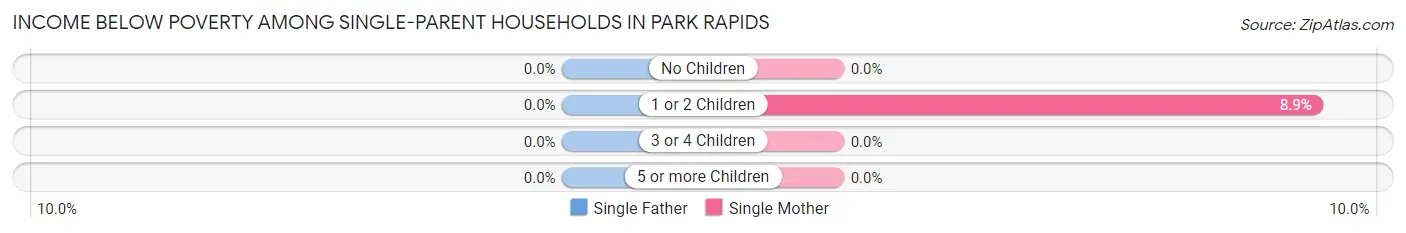
| Children | Single Father | Single Mother |
| No Children | 0 (0.0%) | 0 (0.0%) |
| 1 or 2 Children | 0 (0.0%) | 16 (8.9%) |
| 3 or 4 Children | 0 (0.0%) | 0 (0.0%) |
| 5 or more Children | 0 (0.0%) | 0 (0.0%) |
| Total | 0 (0.0%) | 16 (7.0%) |
Income Below Poverty Among Married-Couple vs Single-Parent Households in Park Rapids
The poverty data for Park Rapids shows that 45 of the married-couple family households (8.0%) and 16 of the single-parent households (4.3%) are living below the poverty level. Within the married-couple family households, those with 3 or 4 children have the highest poverty rate, with 14 households (35.9%) falling below the poverty line. Among the single-parent households, those with 1 or 2 children have the highest poverty rate, with 16 household (5.2%) living below poverty.
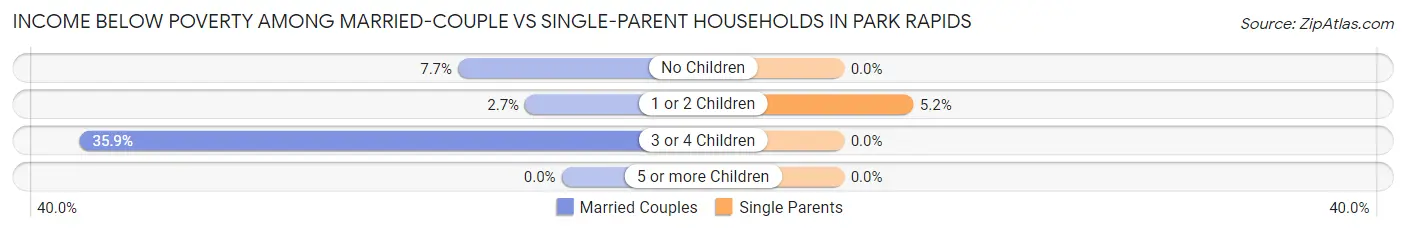
| Children | Married-Couple Families | Single-Parent Households |
| No Children | 26 (7.7%) | 0 (0.0%) |
| 1 or 2 Children | 5 (2.7%) | 16 (5.2%) |
| 3 or 4 Children | 14 (35.9%) | 0 (0.0%) |
| 5 or more Children | 0 (0.0%) | 0 (0.0%) |
| Total | 45 (8.0%) | 16 (4.3%) |
Race in Park Rapids
The most populous races in Park Rapids are White / Caucasian (3,734 | 89.7%), Hispanic or Latino (252 | 6.0%), and Two or more Races (194 | 4.7%).
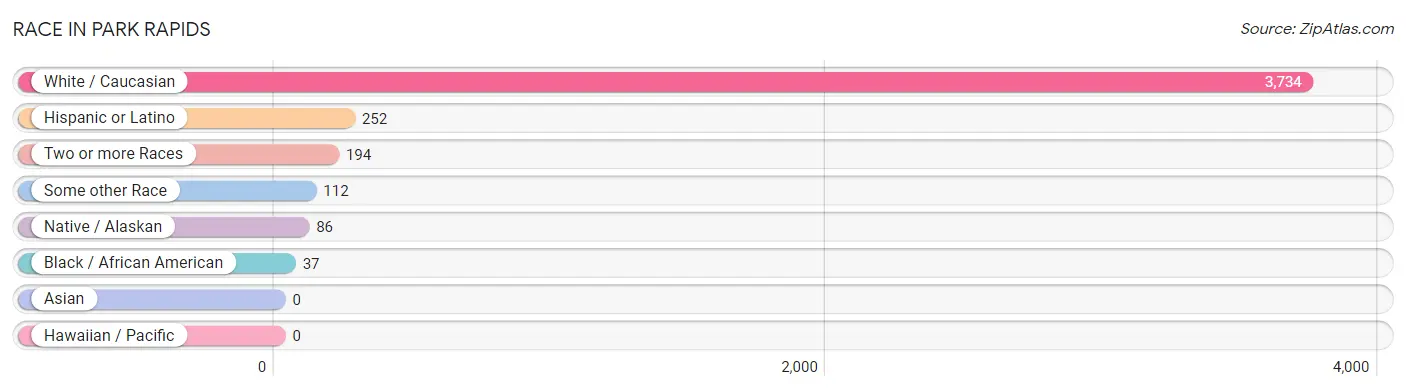
| Race | # Population | % Population |
| Asian | 0 | 0.0% |
| Black / African American | 37 | 0.9% |
| Hawaiian / Pacific | 0 | 0.0% |
| Hispanic or Latino | 252 | 6.0% |
| Native / Alaskan | 86 | 2.1% |
| White / Caucasian | 3,734 | 89.7% |
| Two or more Races | 194 | 4.7% |
| Some other Race | 112 | 2.7% |
| Total | 4,163 | 100.0% |
Ancestry in Park Rapids
The most populous ancestries reported in Park Rapids are German (1,059 | 25.4%), Norwegian (566 | 13.6%), Finnish (368 | 8.8%), English (357 | 8.6%), and Irish (341 | 8.2%), together accounting for 64.6% of all Park Rapids residents.
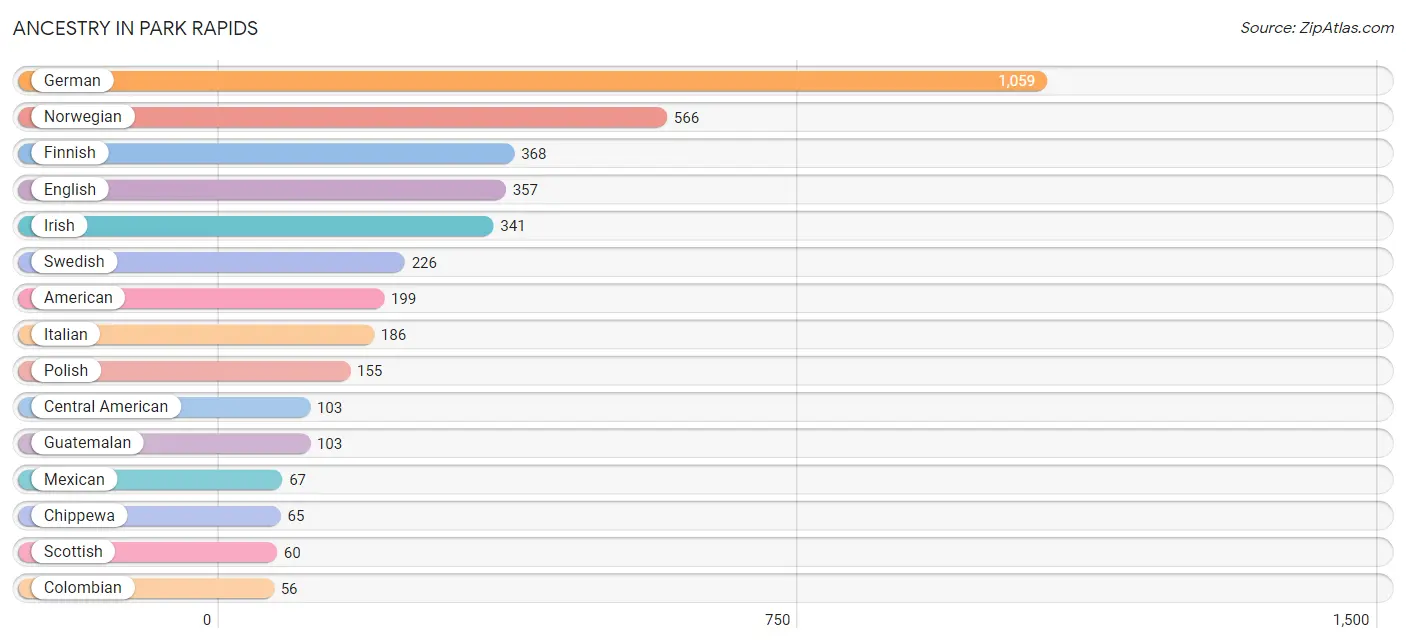
| Ancestry | # Population | % Population |
| American | 199 | 4.8% |
| Belgian | 10 | 0.2% |
| Blackfeet | 24 | 0.6% |
| British | 12 | 0.3% |
| Canadian | 10 | 0.2% |
| Central American | 103 | 2.5% |
| Chippewa | 65 | 1.6% |
| Colombian | 56 | 1.3% |
| Cuban | 26 | 0.6% |
| Czech | 52 | 1.3% |
| Danish | 43 | 1.0% |
| Dutch | 55 | 1.3% |
| English | 357 | 8.6% |
| European | 47 | 1.1% |
| Finnish | 368 | 8.8% |
| French | 35 | 0.8% |
| French Canadian | 16 | 0.4% |
| German | 1,059 | 25.4% |
| Greek | 12 | 0.3% |
| Guatemalan | 103 | 2.5% |
| Indian (Asian) | 30 | 0.7% |
| Inupiat | 5 | 0.1% |
| Irish | 341 | 8.2% |
| Italian | 186 | 4.5% |
| Mexican | 67 | 1.6% |
| Northern European | 16 | 0.4% |
| Norwegian | 566 | 13.6% |
| Polish | 155 | 3.7% |
| Russian | 44 | 1.1% |
| Scandinavian | 30 | 0.7% |
| Scottish | 60 | 1.4% |
| Slovene | 11 | 0.3% |
| South American | 56 | 1.3% |
| Swedish | 226 | 5.4% |
| Ukrainian | 13 | 0.3% |
| Welsh | 9 | 0.2% |
| Yup'ik | 2 | 0.1% | View All 37 Rows |
Immigrants in Park Rapids
The most numerous immigrant groups reported in Park Rapids came from Latin America (98 | 2.4%), Central America (82 | 2.0%), Guatemala (82 | 2.0%), Europe (60 | 1.4%), and Eastern Europe (44 | 1.1%), together accounting for 8.8% of all Park Rapids residents.
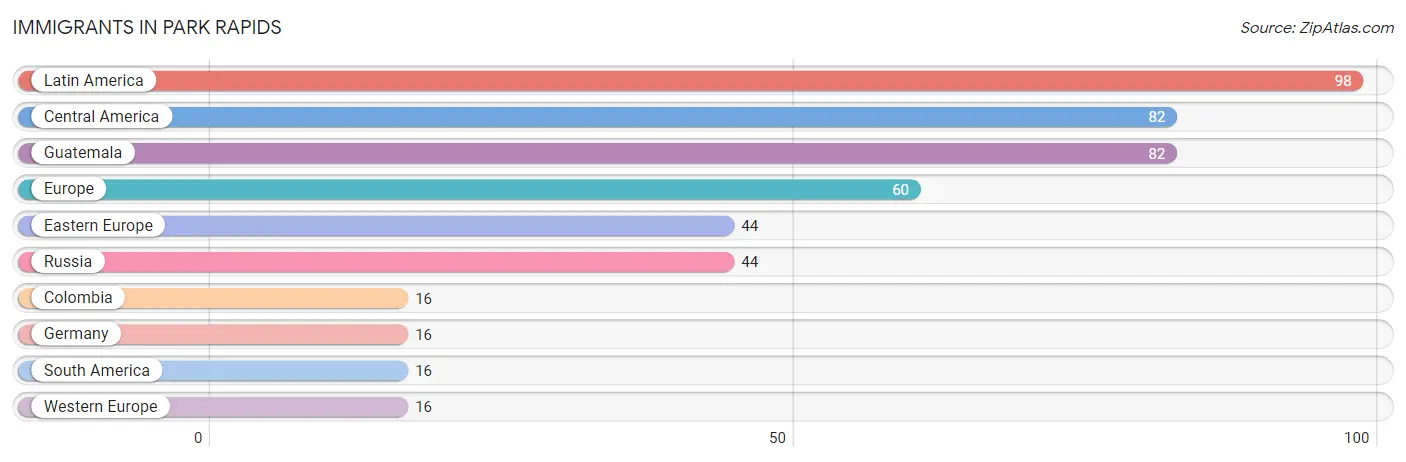
| Immigration Origin | # Population | % Population |
| Central America | 82 | 2.0% |
| Colombia | 16 | 0.4% |
| Eastern Europe | 44 | 1.1% |
| Europe | 60 | 1.4% |
| Germany | 16 | 0.4% |
| Guatemala | 82 | 2.0% |
| Latin America | 98 | 2.4% |
| Russia | 44 | 1.1% |
| South America | 16 | 0.4% |
| Western Europe | 16 | 0.4% | View All 10 Rows |
Sex and Age in Park Rapids
Sex and Age in Park Rapids
The most populous age groups in Park Rapids are 40 to 44 Years (194 | 9.5%) for men and 85 Years and over (202 | 9.6%) for women.
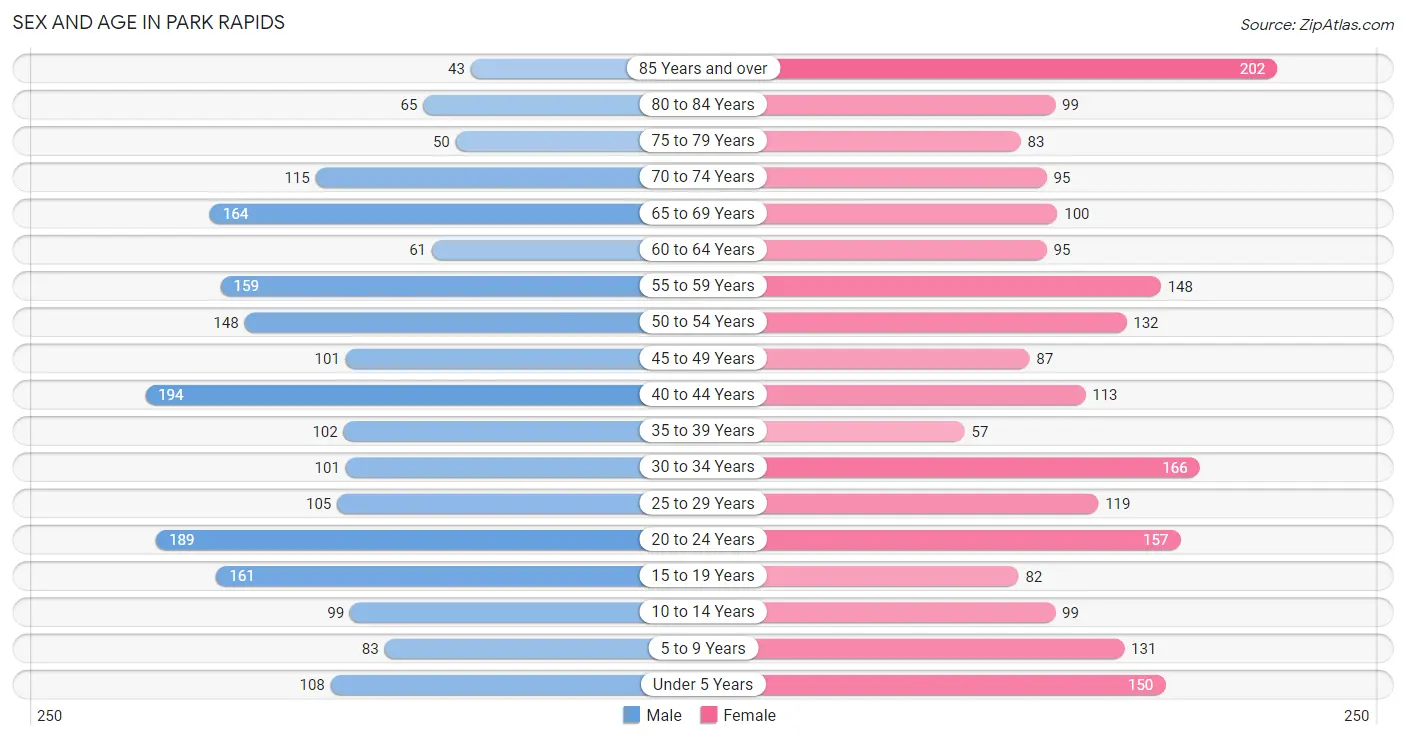
| Age Bracket | Male | Female |
| Under 5 Years | 108 (5.3%) | 150 (7.1%) |
| 5 to 9 Years | 83 (4.1%) | 131 (6.2%) |
| 10 to 14 Years | 99 (4.8%) | 99 (4.7%) |
| 15 to 19 Years | 161 (7.9%) | 82 (3.9%) |
| 20 to 24 Years | 189 (9.2%) | 157 (7.4%) |
| 25 to 29 Years | 105 (5.1%) | 119 (5.6%) |
| 30 to 34 Years | 101 (4.9%) | 166 (7.9%) |
| 35 to 39 Years | 102 (5.0%) | 57 (2.7%) |
| 40 to 44 Years | 194 (9.5%) | 113 (5.3%) |
| 45 to 49 Years | 101 (4.9%) | 87 (4.1%) |
| 50 to 54 Years | 148 (7.2%) | 132 (6.2%) |
| 55 to 59 Years | 159 (7.8%) | 148 (7.0%) |
| 60 to 64 Years | 61 (3.0%) | 95 (4.5%) |
| 65 to 69 Years | 164 (8.0%) | 100 (4.7%) |
| 70 to 74 Years | 115 (5.6%) | 95 (4.5%) |
| 75 to 79 Years | 50 (2.4%) | 83 (3.9%) |
| 80 to 84 Years | 65 (3.2%) | 99 (4.7%) |
| 85 Years and over | 43 (2.1%) | 202 (9.6%) |
| Total | 2,048 (100.0%) | 2,115 (100.0%) |
Families and Households in Park Rapids
Median Family Size in Park Rapids
The median family size in Park Rapids is 2.81 persons per family, with married-couple families (560 | 60.0%) accounting for the largest median family size of 3.04 persons per family. On the other hand, single male/father families (147 | 15.7%) represent the smallest median family size with 2.22 persons per family.
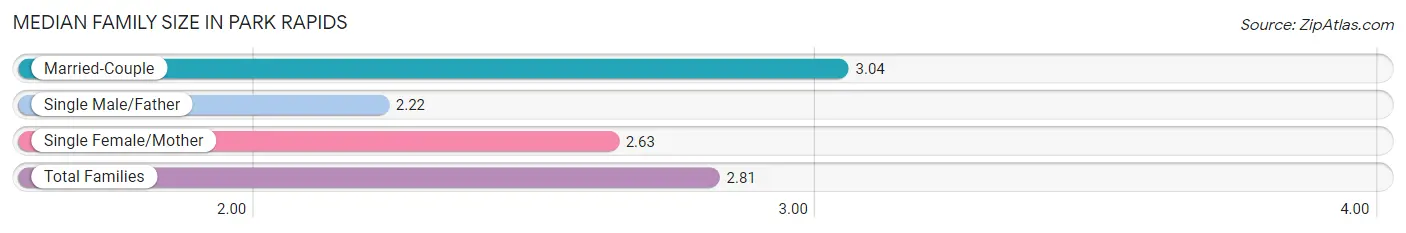
| Family Type | # Families | Family Size |
| Married-Couple | 560 (60.0%) | 3.04 |
| Single Male/Father | 147 (15.7%) | 2.22 |
| Single Female/Mother | 227 (24.3%) | 2.63 |
| Total Families | 934 (100.0%) | 2.81 |
Median Household Size in Park Rapids
The median household size in Park Rapids is 2.12 persons per household, with single female/mother households (227 | 12.2%) accounting for the largest median household size of 3.32 persons per household. non-family households (923 | 49.7%) represent the smallest median household size with 1.15 persons per household.
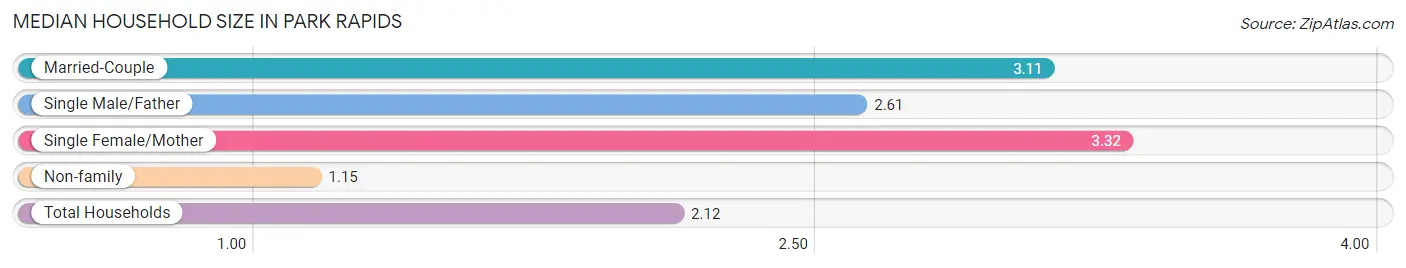
| Household Type | # Households | Household Size |
| Married-Couple | 560 (30.2%) | 3.11 |
| Single Male/Father | 147 (7.9%) | 2.61 |
| Single Female/Mother | 227 (12.2%) | 3.32 |
| Non-family | 923 (49.7%) | 1.15 |
| Total Households | 1,857 (100.0%) | 2.12 |
Household Size by Marriage Status in Park Rapids
Out of a total of 1,857 households in Park Rapids, 934 (50.3%) are family households, while 923 (49.7%) are nonfamily households. The most numerous type of family households are 2-person households, comprising 441, and the most common type of nonfamily households are 1-person households, comprising 802.
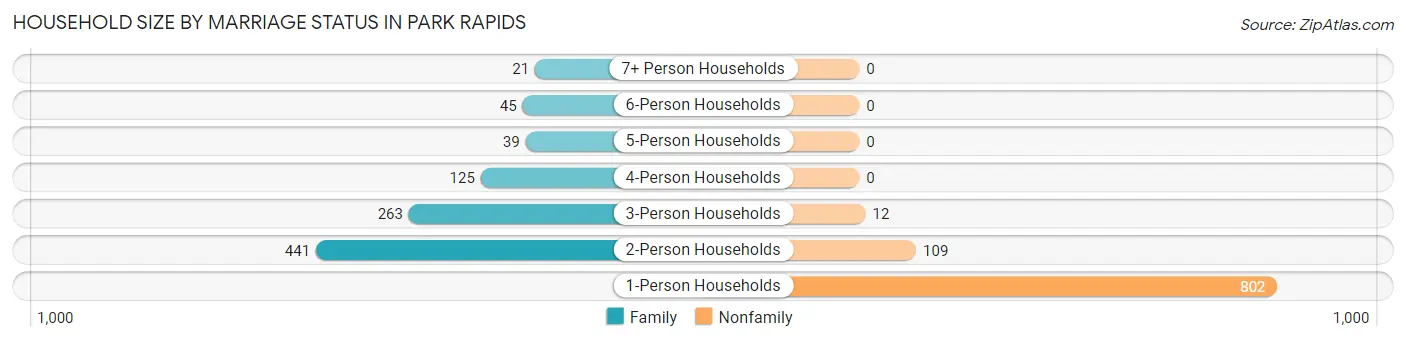
| Household Size | Family Households | Nonfamily Households |
| 1-Person Households | - | 802 (43.2%) |
| 2-Person Households | 441 (23.7%) | 109 (5.9%) |
| 3-Person Households | 263 (14.2%) | 12 (0.6%) |
| 4-Person Households | 125 (6.7%) | 0 (0.0%) |
| 5-Person Households | 39 (2.1%) | 0 (0.0%) |
| 6-Person Households | 45 (2.4%) | 0 (0.0%) |
| 7+ Person Households | 21 (1.1%) | 0 (0.0%) |
| Total | 934 (50.3%) | 923 (49.7%) |
Female Fertility in Park Rapids
Fertility by Age in Park Rapids
Average fertility rate in Park Rapids is 67.0 births per 1,000 women. Women in the age bracket of 20 to 34 years have the highest fertility rate with 120.0 births per 1,000 women. Women in the age bracket of 20 to 34 years acount for 100.0% of all women with births.
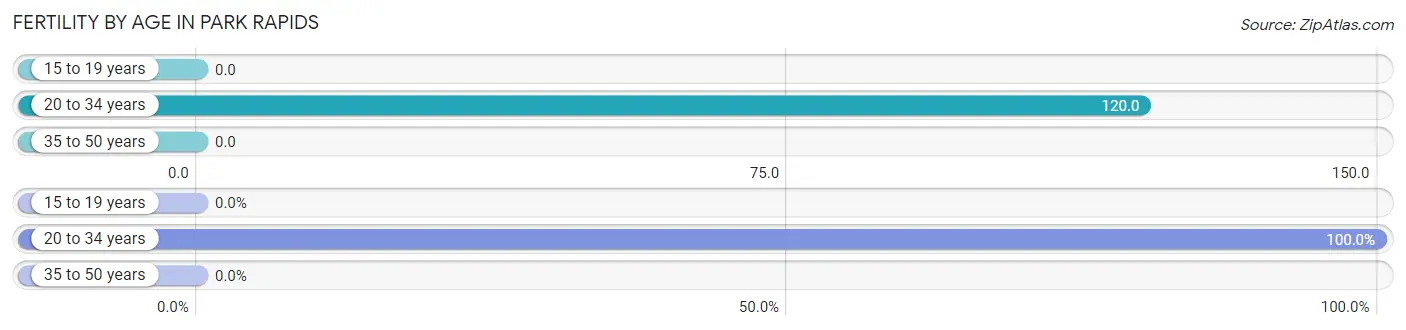
| Age Bracket | Women with Births | Births / 1,000 Women |
| 15 to 19 years | 0 (0.0%) | 0.0 |
| 20 to 34 years | 53 (100.0%) | 120.0 |
| 35 to 50 years | 0 (0.0%) | 0.0 |
| Total | 53 (100.0%) | 67.0 |
Fertility by Age by Marriage Status in Park Rapids
56.6% of women with births (53) in Park Rapids are married. The highest percentage of unmarried women with births falls into 20 to 34 years age bracket with 43.4% of them unmarried at the time of birth, while the lowest percentage of unmarried women with births belong to 20 to 34 years age bracket with 43.4% of them unmarried.
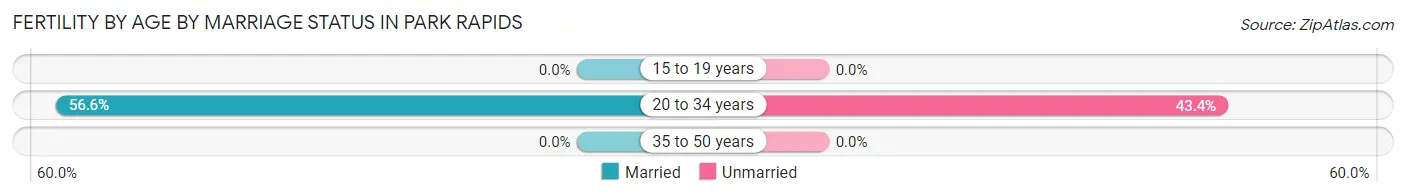
| Age Bracket | Married | Unmarried |
| 15 to 19 years | 0 (0.0%) | 0 (0.0%) |
| 20 to 34 years | 30 (56.6%) | 23 (43.4%) |
| 35 to 50 years | 0 (0.0%) | 0 (0.0%) |
| Total | 30 (56.6%) | 23 (43.4%) |
Fertility by Education in Park Rapids
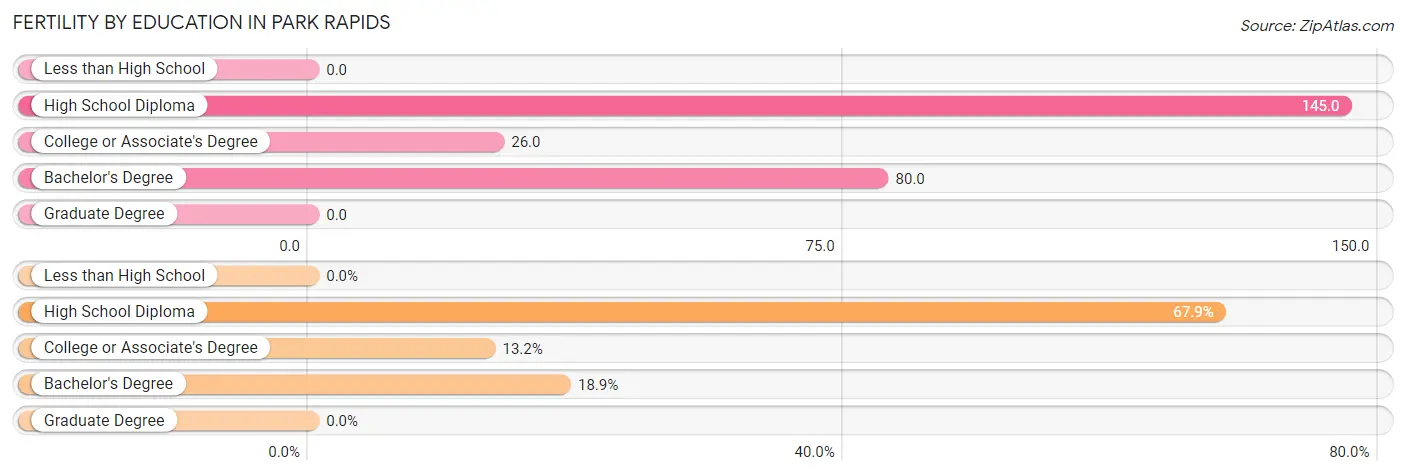
| Educational Attainment | Women with Births | Births / 1,000 Women |
| Less than High School | 0 (0.0%) | 0.0 |
| High School Diploma | 36 (67.9%) | 145.0 |
| College or Associate's Degree | 7 (13.2%) | 26.0 |
| Bachelor's Degree | 10 (18.9%) | 80.0 |
| Graduate Degree | 0 (0.0%) | 0.0 |
| Total | 53 (100.0%) | 67.0 |
Fertility by Education by Marriage Status in Park Rapids
43.4% of women with births in Park Rapids are unmarried. Women with the educational attainment of bachelor's degree are most likely to be married with 100.0% of them married at childbirth, while women with the educational attainment of college or associate's degree are least likely to be married with 100.0% of them unmarried at childbirth.
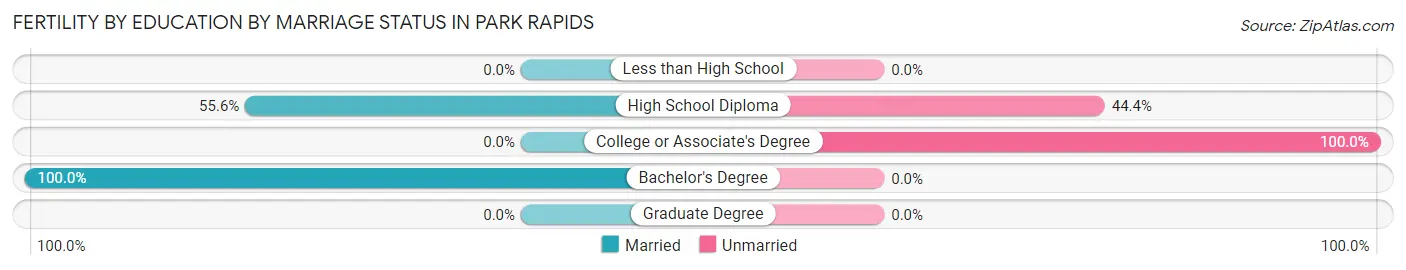
| Educational Attainment | Married | Unmarried |
| Less than High School | 0 (0.0%) | 0 (0.0%) |
| High School Diploma | 20 (55.6%) | 16 (44.4%) |
| College or Associate's Degree | 0 (0.0%) | 7 (100.0%) |
| Bachelor's Degree | 10 (100.0%) | 0 (0.0%) |
| Graduate Degree | 0 (0.0%) | 0 (0.0%) |
| Total | 30 (56.6%) | 23 (43.4%) |
Employment Characteristics in Park Rapids
Employment by Class of Employer in Park Rapids
Among the 1,883 employed individuals in Park Rapids, private company employees (1,322 | 70.2%), self-employed (not incorporated) (197 | 10.5%), and not-for-profit organizations (139 | 7.4%) make up the most common classes of employment.
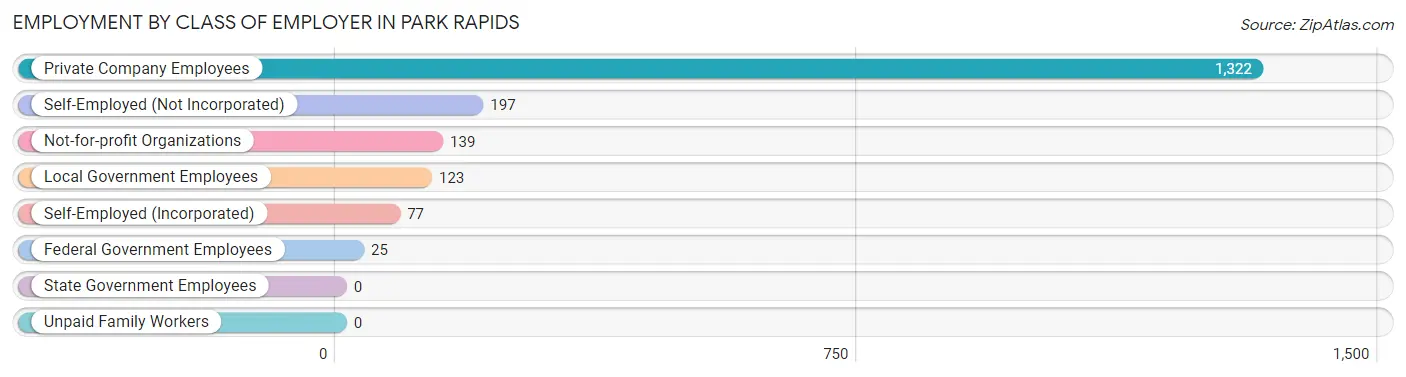
| Employer Class | # Employees | % Employees |
| Private Company Employees | 1,322 | 70.2% |
| Self-Employed (Incorporated) | 77 | 4.1% |
| Self-Employed (Not Incorporated) | 197 | 10.5% |
| Not-for-profit Organizations | 139 | 7.4% |
| Local Government Employees | 123 | 6.5% |
| State Government Employees | 0 | 0.0% |
| Federal Government Employees | 25 | 1.3% |
| Unpaid Family Workers | 0 | 0.0% |
| Total | 1,883 | 100.0% |
Employment Status by Age in Park Rapids
According to the labor force statistics for Park Rapids, out of the total population over 16 years of age (3,478), 58.3% or 2,028 individuals are in the labor force, with 5.2% or 105 of them unemployed. The age group with the highest labor force participation rate is 25 to 29 years, with 96.9% or 217 individuals in the labor force. Within the labor force, the 60 to 64 years age range has the highest percentage of unemployed individuals, with 20.0% or 23 of them being unemployed.
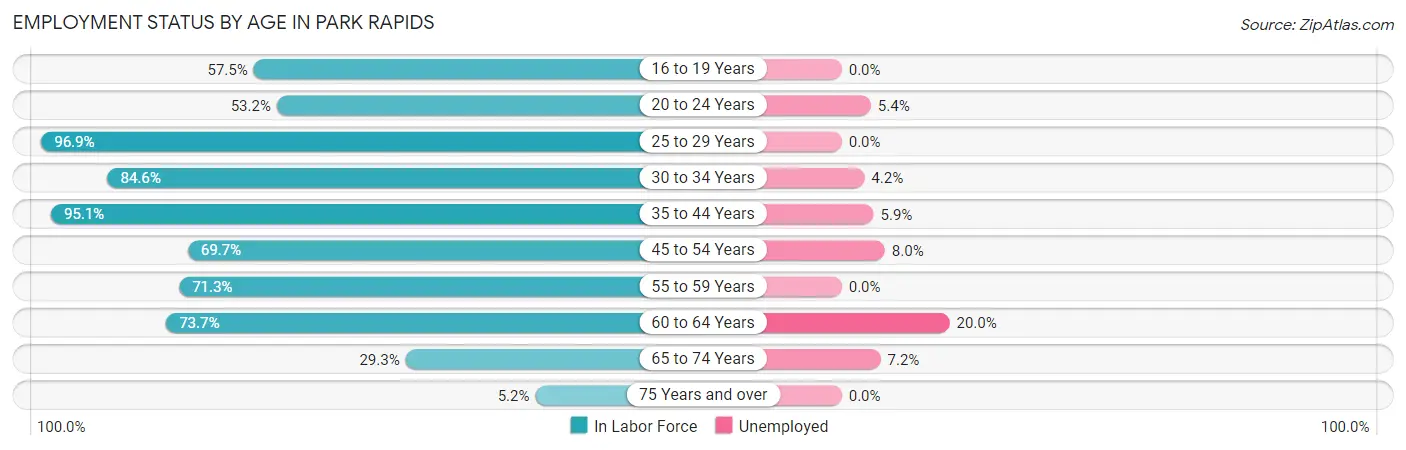
| Age Bracket | In Labor Force | Unemployed |
| 16 to 19 Years | 131 (57.5%) | 0 (0.0%) |
| 20 to 24 Years | 184 (53.2%) | 10 (5.4%) |
| 25 to 29 Years | 217 (96.9%) | 0 (0.0%) |
| 30 to 34 Years | 226 (84.6%) | 9 (4.2%) |
| 35 to 44 Years | 443 (95.1%) | 26 (5.9%) |
| 45 to 54 Years | 326 (69.7%) | 26 (8.0%) |
| 55 to 59 Years | 219 (71.3%) | 0 (0.0%) |
| 60 to 64 Years | 115 (73.7%) | 23 (20.0%) |
| 65 to 74 Years | 139 (29.3%) | 10 (7.2%) |
| 75 Years and over | 28 (5.2%) | 0 (0.0%) |
| Total | 2,028 (58.3%) | 105 (5.2%) |
Employment Status by Educational Attainment in Park Rapids
According to labor force statistics for Park Rapids, 81.9% of individuals (1,546) out of the total population between 25 and 64 years of age (1,888) are in the labor force, with 5.5% or 85 of them being unemployed. The group with the highest labor force participation rate are those with the educational attainment of bachelor's degree or higher, with 96.4% or 326 individuals in the labor force. Within the labor force, individuals with high school diploma education have the highest percentage of unemployment, with 8.6% or 36 of them being unemployed.
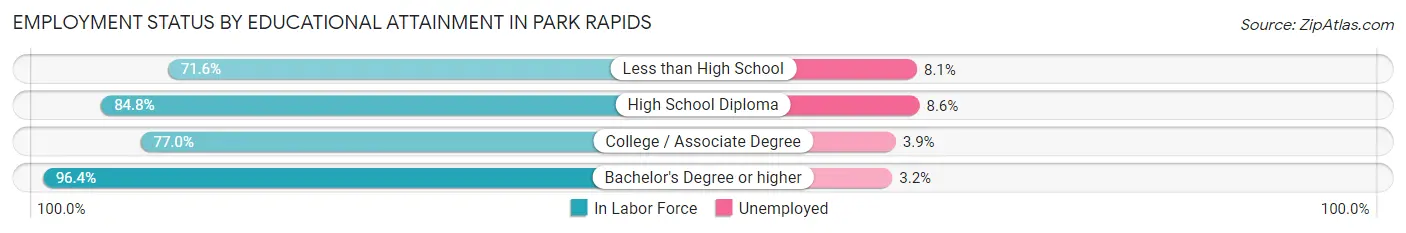
| Educational Attainment | In Labor Force | Unemployed |
| Less than High School | 161 (71.6%) | 18 (8.1%) |
| High School Diploma | 418 (84.8%) | 42 (8.6%) |
| College / Associate Degree | 641 (77.0%) | 32 (3.9%) |
| Bachelor's Degree or higher | 326 (96.4%) | 11 (3.2%) |
| Total | 1,546 (81.9%) | 104 (5.5%) |
Employment Occupations by Sex in Park Rapids
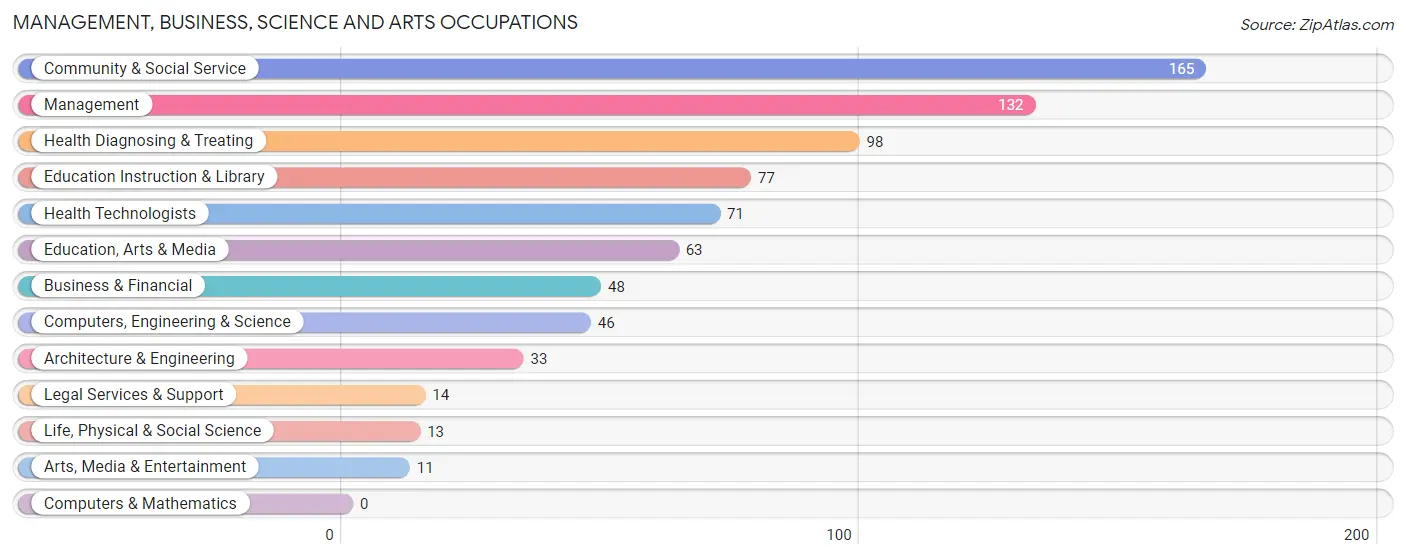
Management, Business, Science and Arts Occupations
The most common Management, Business, Science and Arts occupations in Park Rapids are Community & Social Service (165 | 8.6%), Management (132 | 6.9%), Health Diagnosing & Treating (98 | 5.1%), Education Instruction & Library (77 | 4.0%), and Health Technologists (71 | 3.7%).
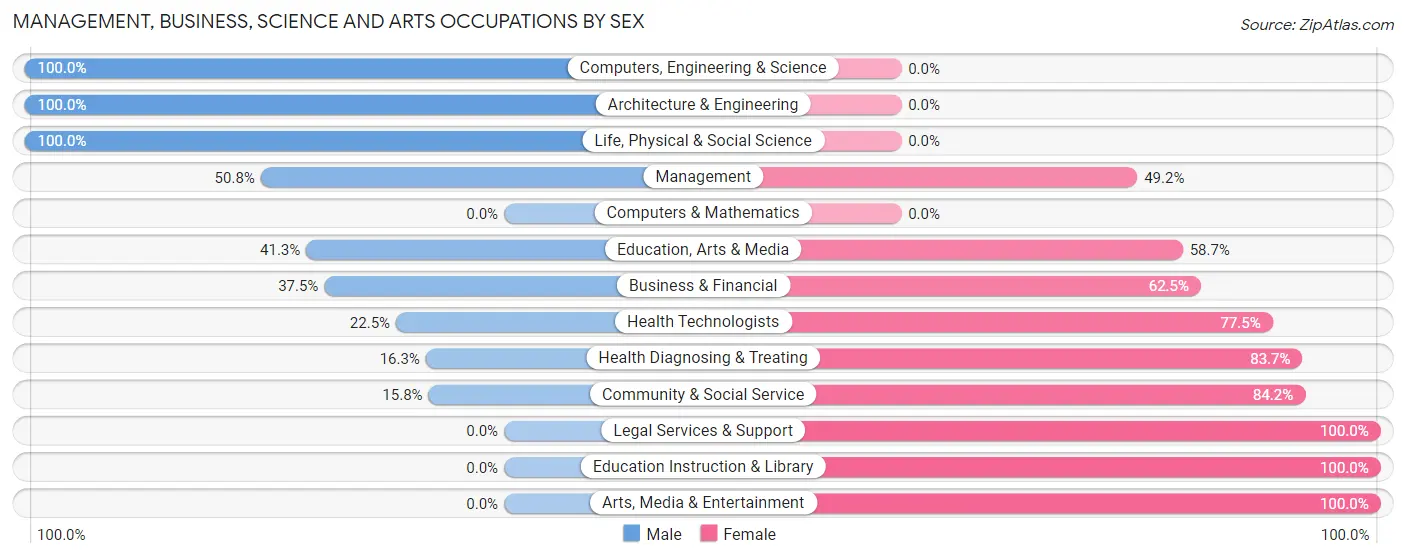
Management, Business, Science and Arts Occupations by Sex
Within the Management, Business, Science and Arts occupations in Park Rapids, the most male-oriented occupations are Computers, Engineering & Science (100.0%), Architecture & Engineering (100.0%), and Life, Physical & Social Science (100.0%), while the most female-oriented occupations are Legal Services & Support (100.0%), Education Instruction & Library (100.0%), and Arts, Media & Entertainment (100.0%).
| Occupation | Male | Female |
| Management | 67 (50.8%) | 65 (49.2%) |
| Business & Financial | 18 (37.5%) | 30 (62.5%) |
| Computers, Engineering & Science | 46 (100.0%) | 0 (0.0%) |
| Computers & Mathematics | 0 (0.0%) | 0 (0.0%) |
| Architecture & Engineering | 33 (100.0%) | 0 (0.0%) |
| Life, Physical & Social Science | 13 (100.0%) | 0 (0.0%) |
| Community & Social Service | 26 (15.8%) | 139 (84.2%) |
| Education, Arts & Media | 26 (41.3%) | 37 (58.7%) |
| Legal Services & Support | 0 (0.0%) | 14 (100.0%) |
| Education Instruction & Library | 0 (0.0%) | 77 (100.0%) |
| Arts, Media & Entertainment | 0 (0.0%) | 11 (100.0%) |
| Health Diagnosing & Treating | 16 (16.3%) | 82 (83.7%) |
| Health Technologists | 16 (22.5%) | 55 (77.5%) |
| Total (Category) | 173 (35.4%) | 316 (64.6%) |
| Total (Overall) | 1,044 (54.6%) | 868 (45.4%) |
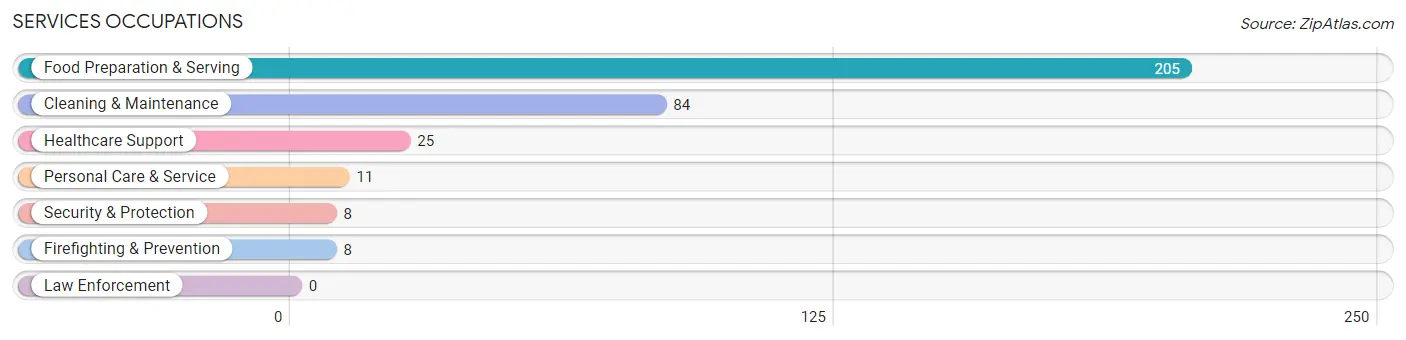
Services Occupations
The most common Services occupations in Park Rapids are Food Preparation & Serving (205 | 10.7%), Cleaning & Maintenance (84 | 4.4%), Healthcare Support (25 | 1.3%), Personal Care & Service (11 | 0.6%), and Security & Protection (8 | 0.4%).
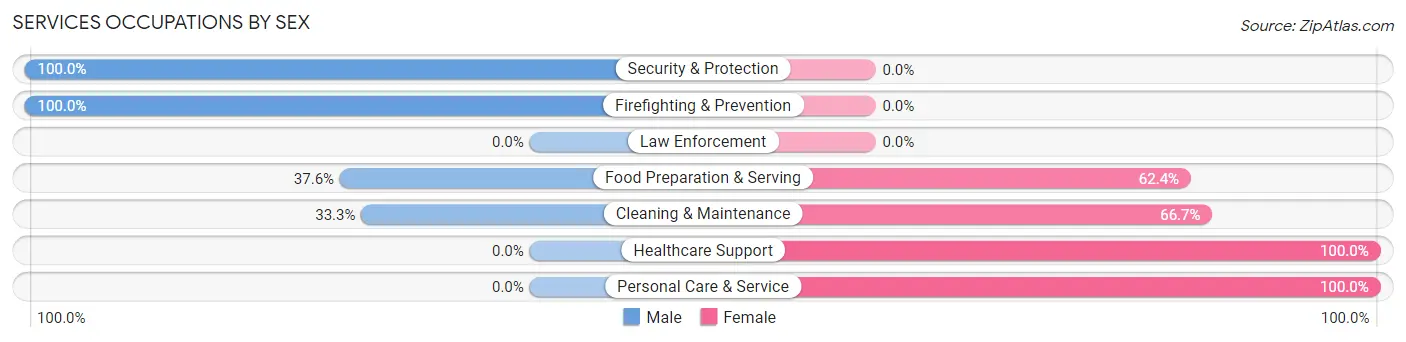
Services Occupations by Sex
Within the Services occupations in Park Rapids, the most male-oriented occupations are Security & Protection (100.0%), Firefighting & Prevention (100.0%), and Food Preparation & Serving (37.6%), while the most female-oriented occupations are Healthcare Support (100.0%), Personal Care & Service (100.0%), and Cleaning & Maintenance (66.7%).
| Occupation | Male | Female |
| Healthcare Support | 0 (0.0%) | 25 (100.0%) |
| Security & Protection | 8 (100.0%) | 0 (0.0%) |
| Firefighting & Prevention | 8 (100.0%) | 0 (0.0%) |
| Law Enforcement | 0 (0.0%) | 0 (0.0%) |
| Food Preparation & Serving | 77 (37.6%) | 128 (62.4%) |
| Cleaning & Maintenance | 28 (33.3%) | 56 (66.7%) |
| Personal Care & Service | 0 (0.0%) | 11 (100.0%) |
| Total (Category) | 113 (33.9%) | 220 (66.1%) |
| Total (Overall) | 1,044 (54.6%) | 868 (45.4%) |
Sales and Office Occupations
The most common Sales and Office occupations in Park Rapids are Sales & Related (168 | 8.8%), and Office & Administration (168 | 8.8%).
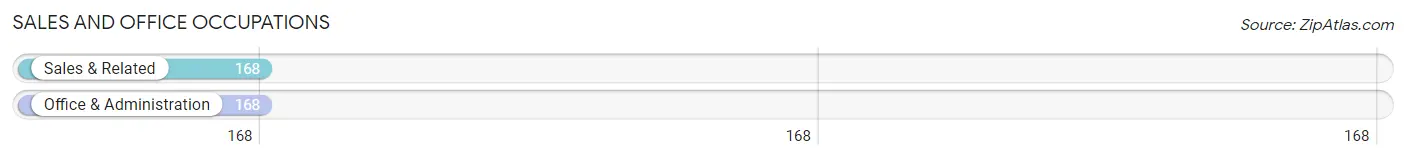
Sales and Office Occupations by Sex
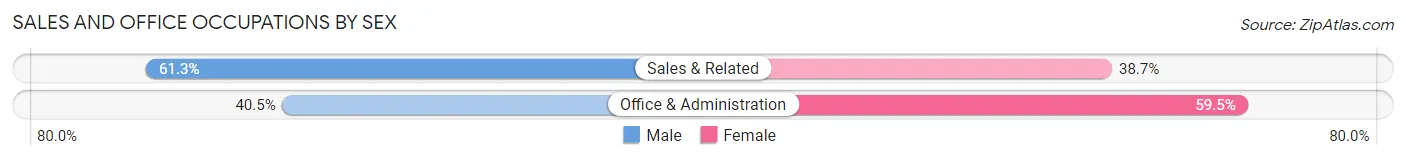
| Occupation | Male | Female |
| Sales & Related | 103 (61.3%) | 65 (38.7%) |
| Office & Administration | 68 (40.5%) | 100 (59.5%) |
| Total (Category) | 171 (50.9%) | 165 (49.1%) |
| Total (Overall) | 1,044 (54.6%) | 868 (45.4%) |
Natural Resources, Construction and Maintenance Occupations
The most common Natural Resources, Construction and Maintenance occupations in Park Rapids are Construction & Extraction (97 | 5.1%), Farming, Fishing & Forestry (84 | 4.4%), and Installation, Maintenance & Repair (64 | 3.4%).
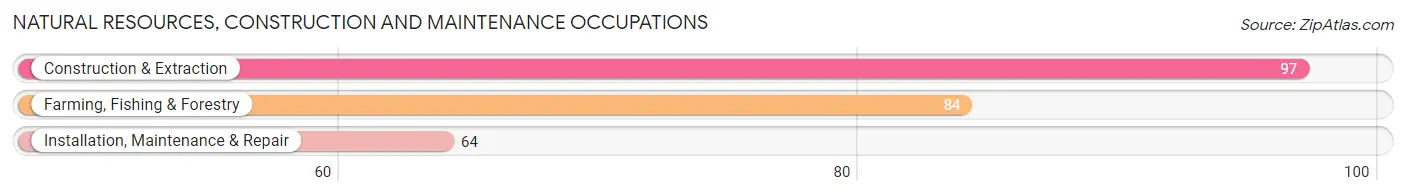
Natural Resources, Construction and Maintenance Occupations by Sex
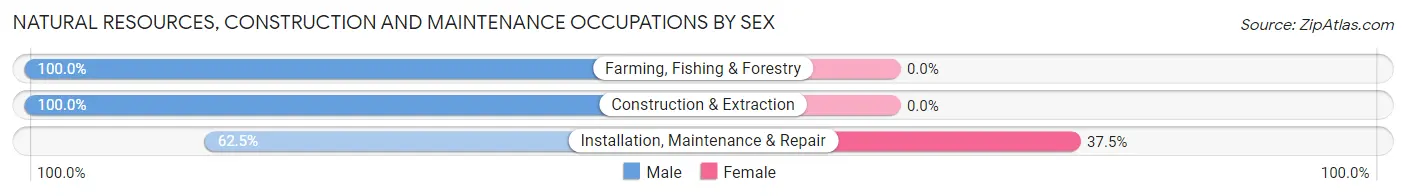
| Occupation | Male | Female |
| Farming, Fishing & Forestry | 84 (100.0%) | 0 (0.0%) |
| Construction & Extraction | 97 (100.0%) | 0 (0.0%) |
| Installation, Maintenance & Repair | 40 (62.5%) | 24 (37.5%) |
| Total (Category) | 221 (90.2%) | 24 (9.8%) |
| Total (Overall) | 1,044 (54.6%) | 868 (45.4%) |
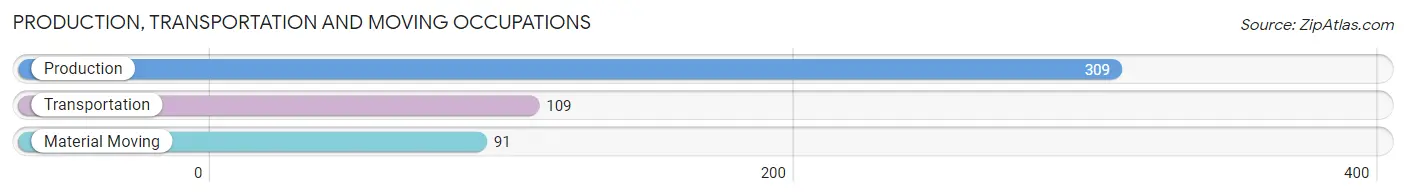
Production, Transportation and Moving Occupations
The most common Production, Transportation and Moving occupations in Park Rapids are Production (309 | 16.2%), Transportation (109 | 5.7%), and Material Moving (91 | 4.8%).
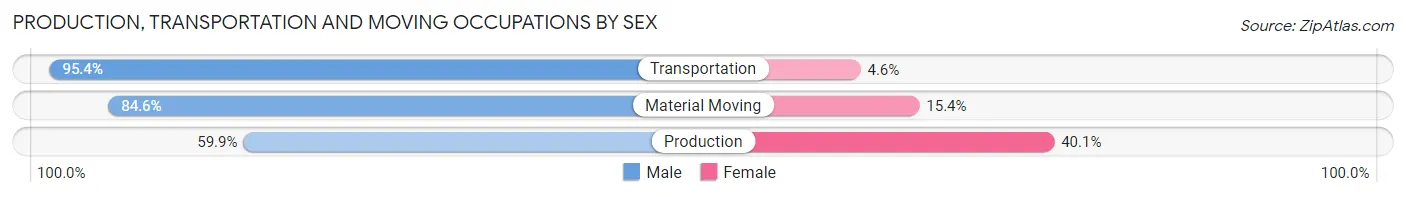
Production, Transportation and Moving Occupations by Sex
| Occupation | Male | Female |
| Production | 185 (59.9%) | 124 (40.1%) |
| Transportation | 104 (95.4%) | 5 (4.6%) |
| Material Moving | 77 (84.6%) | 14 (15.4%) |
| Total (Category) | 366 (71.9%) | 143 (28.1%) |
| Total (Overall) | 1,044 (54.6%) | 868 (45.4%) |
Employment Industries by Sex in Park Rapids
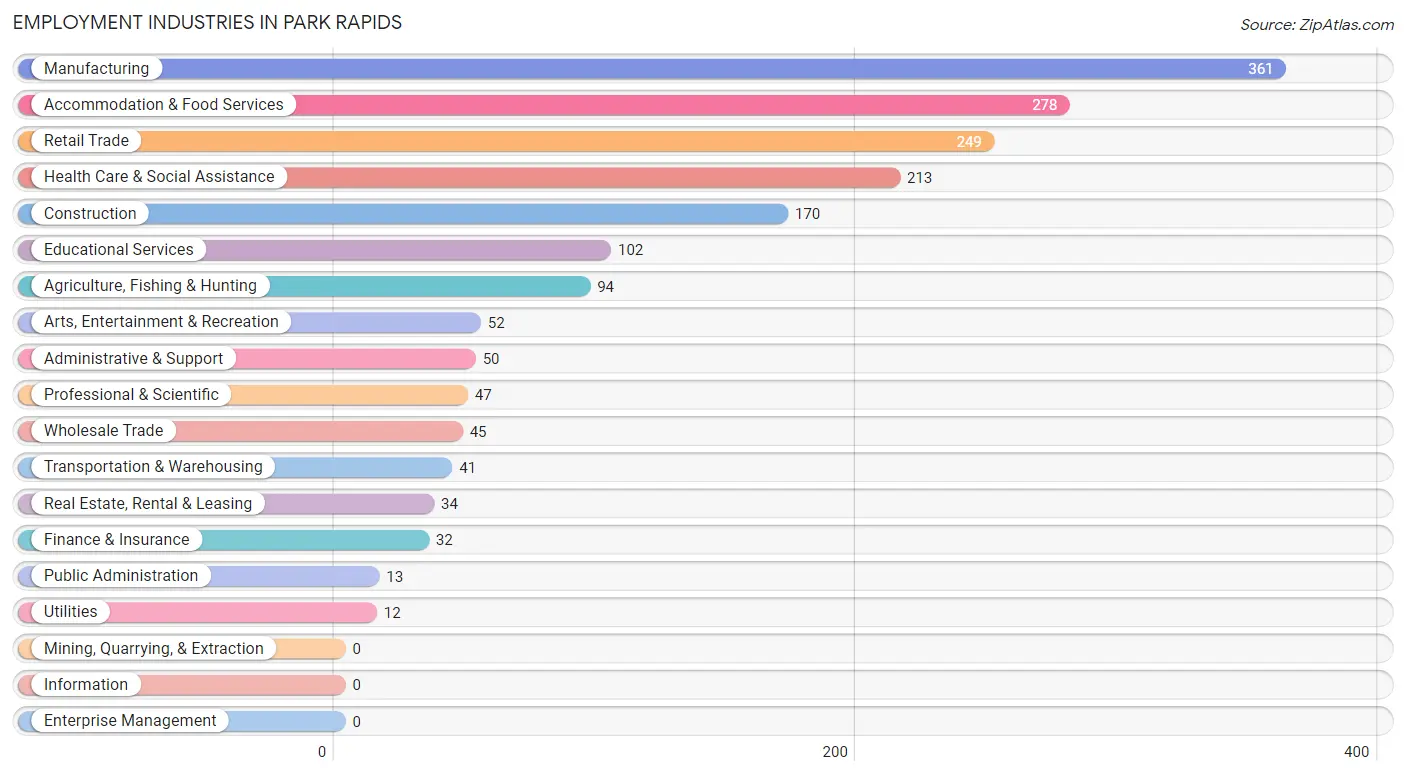
Employment Industries in Park Rapids
The major employment industries in Park Rapids include Manufacturing (361 | 18.9%), Accommodation & Food Services (278 | 14.5%), Retail Trade (249 | 13.0%), Health Care & Social Assistance (213 | 11.1%), and Construction (170 | 8.9%).
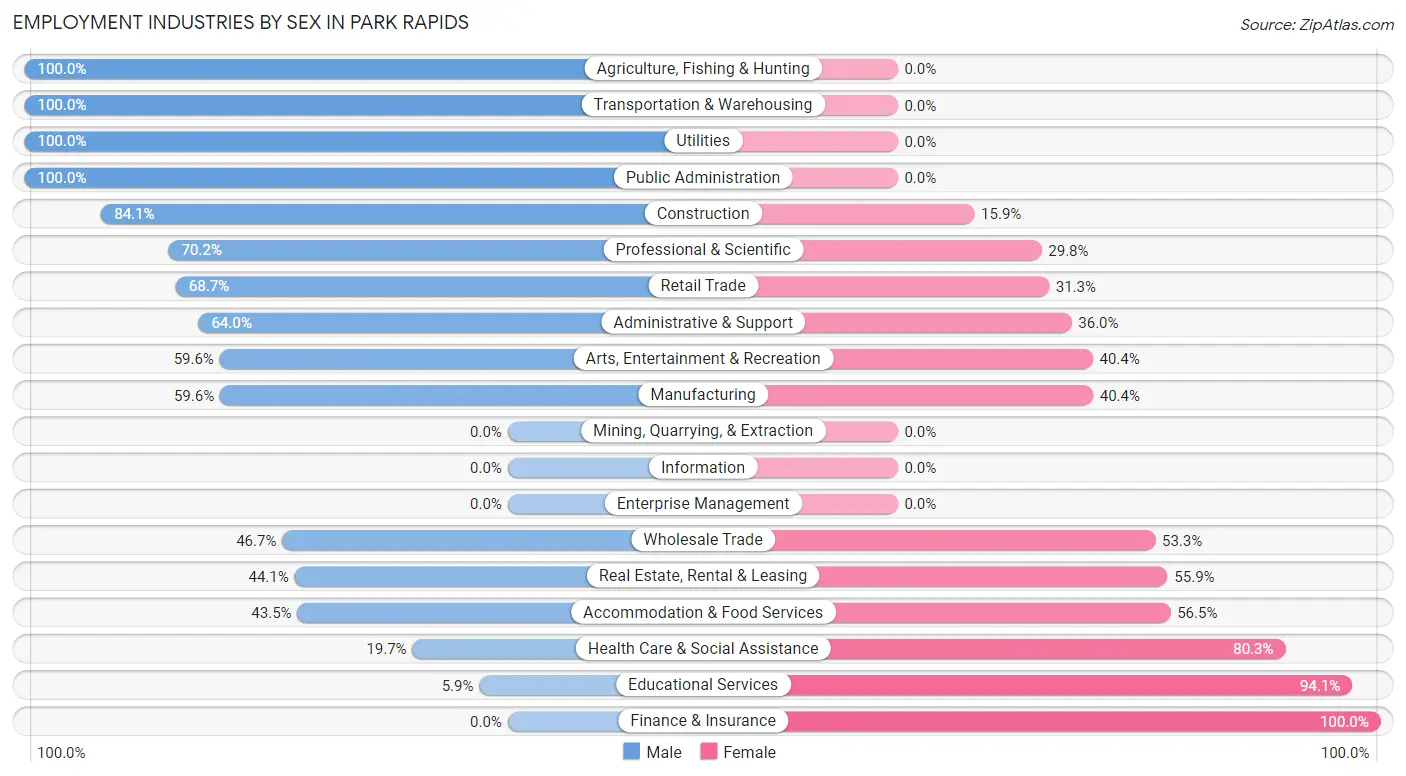
Employment Industries by Sex in Park Rapids
The Park Rapids industries that see more men than women are Agriculture, Fishing & Hunting (100.0%), Transportation & Warehousing (100.0%), and Utilities (100.0%), whereas the industries that tend to have a higher number of women are Finance & Insurance (100.0%), Educational Services (94.1%), and Health Care & Social Assistance (80.3%).
| Industry | Male | Female |
| Agriculture, Fishing & Hunting | 94 (100.0%) | 0 (0.0%) |
| Mining, Quarrying, & Extraction | 0 (0.0%) | 0 (0.0%) |
| Construction | 143 (84.1%) | 27 (15.9%) |
| Manufacturing | 215 (59.6%) | 146 (40.4%) |
| Wholesale Trade | 21 (46.7%) | 24 (53.3%) |
| Retail Trade | 171 (68.7%) | 78 (31.3%) |
| Transportation & Warehousing | 41 (100.0%) | 0 (0.0%) |
| Utilities | 12 (100.0%) | 0 (0.0%) |
| Information | 0 (0.0%) | 0 (0.0%) |
| Finance & Insurance | 0 (0.0%) | 32 (100.0%) |
| Real Estate, Rental & Leasing | 15 (44.1%) | 19 (55.9%) |
| Professional & Scientific | 33 (70.2%) | 14 (29.8%) |
| Enterprise Management | 0 (0.0%) | 0 (0.0%) |
| Administrative & Support | 32 (64.0%) | 18 (36.0%) |
| Educational Services | 6 (5.9%) | 96 (94.1%) |
| Health Care & Social Assistance | 42 (19.7%) | 171 (80.3%) |
| Arts, Entertainment & Recreation | 31 (59.6%) | 21 (40.4%) |
| Accommodation & Food Services | 121 (43.5%) | 157 (56.5%) |
| Public Administration | 13 (100.0%) | 0 (0.0%) |
| Total | 1,044 (54.6%) | 868 (45.4%) |
Education in Park Rapids
School Enrollment in Park Rapids
The most common levels of schooling among the 879 students in Park Rapids are high school (229 | 26.1%), elementary school (190 | 21.6%), and middle school (160 | 18.2%).
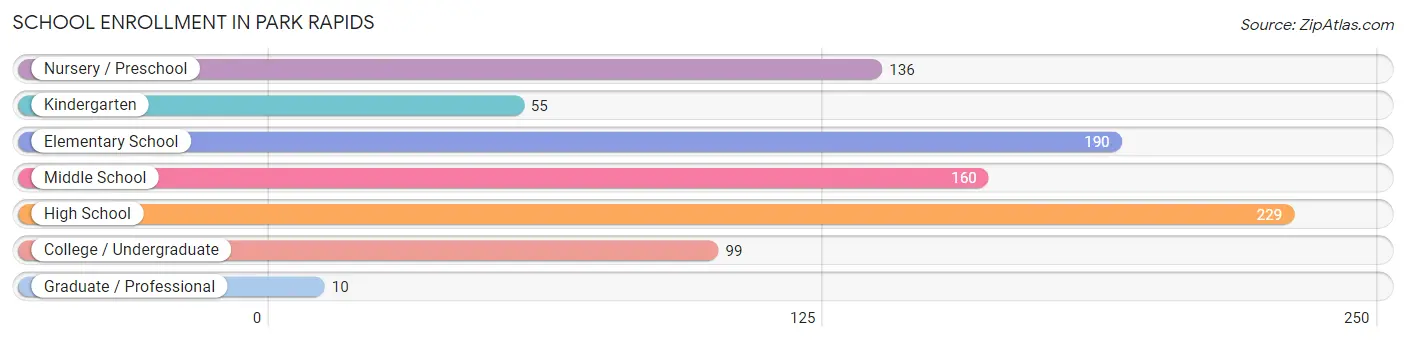
| School Level | # Students | % Students |
| Nursery / Preschool | 136 | 15.5% |
| Kindergarten | 55 | 6.3% |
| Elementary School | 190 | 21.6% |
| Middle School | 160 | 18.2% |
| High School | 229 | 26.1% |
| College / Undergraduate | 99 | 11.3% |
| Graduate / Professional | 10 | 1.1% |
| Total | 879 | 100.0% |
School Enrollment by Age by Funding Source in Park Rapids
Out of a total of 879 students who are enrolled in schools in Park Rapids, 84 (9.6%) attend a private institution, while the remaining 795 (90.4%) are enrolled in public schools. The age group of 15 to 17 year olds has the highest likelihood of being enrolled in private schools, with 56 (32.0% in the age bracket) enrolled. Conversely, the age group of 3 to 4 year olds has the lowest likelihood of being enrolled in a private school, with 136 (100.0% in the age bracket) attending a public institution.
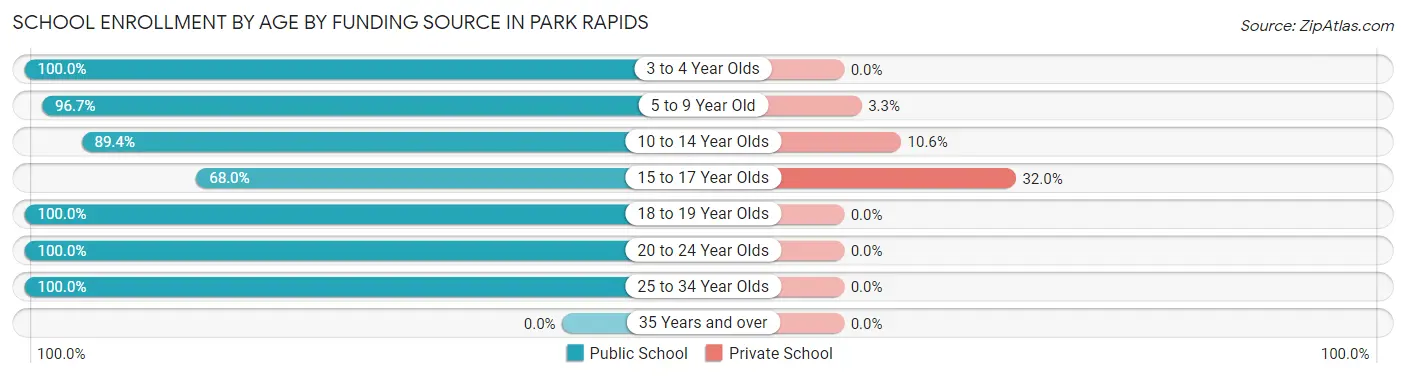
| Age Bracket | Public School | Private School |
| 3 to 4 Year Olds | 136 (100.0%) | 0 (0.0%) |
| 5 to 9 Year Old | 207 (96.7%) | 7 (3.3%) |
| 10 to 14 Year Olds | 177 (89.4%) | 21 (10.6%) |
| 15 to 17 Year Olds | 119 (68.0%) | 56 (32.0%) |
| 18 to 19 Year Olds | 25 (100.0%) | 0 (0.0%) |
| 20 to 24 Year Olds | 57 (100.0%) | 0 (0.0%) |
| 25 to 34 Year Olds | 74 (100.0%) | 0 (0.0%) |
| 35 Years and over | 0 (0.0%) | 0 (0.0%) |
| Total | 795 (90.4%) | 84 (9.6%) |
Educational Attainment by Field of Study in Park Rapids
Education (190 | 27.0%), business (154 | 21.9%), bio, nature & agricultural (88 | 12.5%), science & technology (76 | 10.8%), and liberal arts & history (60 | 8.5%) are the most common fields of study among 703 individuals in Park Rapids who have obtained a bachelor's degree or higher.
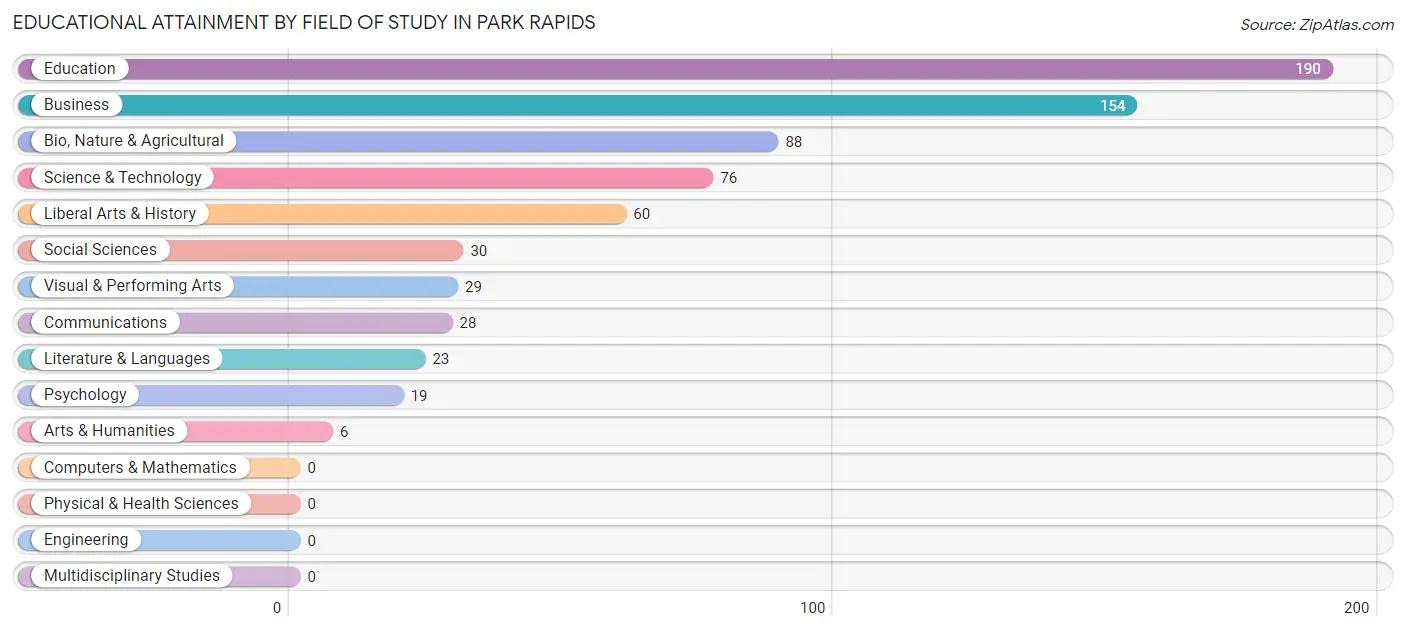
| Field of Study | # Graduates | % Graduates |
| Computers & Mathematics | 0 | 0.0% |
| Bio, Nature & Agricultural | 88 | 12.5% |
| Physical & Health Sciences | 0 | 0.0% |
| Psychology | 19 | 2.7% |
| Social Sciences | 30 | 4.3% |
| Engineering | 0 | 0.0% |
| Multidisciplinary Studies | 0 | 0.0% |
| Science & Technology | 76 | 10.8% |
| Business | 154 | 21.9% |
| Education | 190 | 27.0% |
| Literature & Languages | 23 | 3.3% |
| Liberal Arts & History | 60 | 8.5% |
| Visual & Performing Arts | 29 | 4.1% |
| Communications | 28 | 4.0% |
| Arts & Humanities | 6 | 0.9% |
| Total | 703 | 100.0% |
Transportation & Commute in Park Rapids
Vehicle Availability by Sex in Park Rapids
The most prevalent vehicle ownership categories in Park Rapids are males with 2 vehicles (349, accounting for 34.0%) and females with 2 vehicles (300, making up 43.0%).
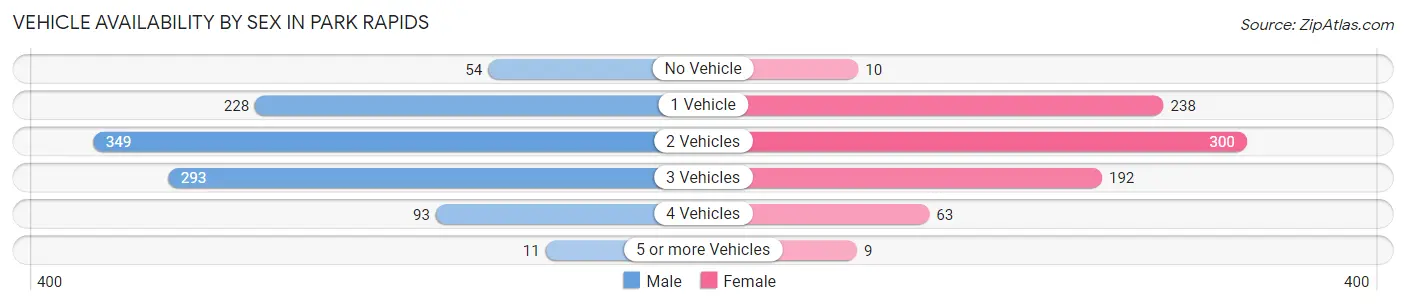
| Vehicles Available | Male | Female |
| No Vehicle | 54 (5.2%) | 10 (1.2%) |
| 1 Vehicle | 228 (22.2%) | 238 (29.3%) |
| 2 Vehicles | 349 (34.0%) | 300 (36.9%) |
| 3 Vehicles | 293 (28.5%) | 192 (23.6%) |
| 4 Vehicles | 93 (9.0%) | 63 (7.8%) |
| 5 or more Vehicles | 11 (1.1%) | 9 (1.1%) |
| Total | 1,028 (100.0%) | 812 (100.0%) |
Commute Time in Park Rapids
The most frequently occuring commute durations in Park Rapids are 5 to 9 minutes (675 commuters, 39.9%), 10 to 14 minutes (367 commuters, 21.7%), and 15 to 19 minutes (186 commuters, 11.0%).
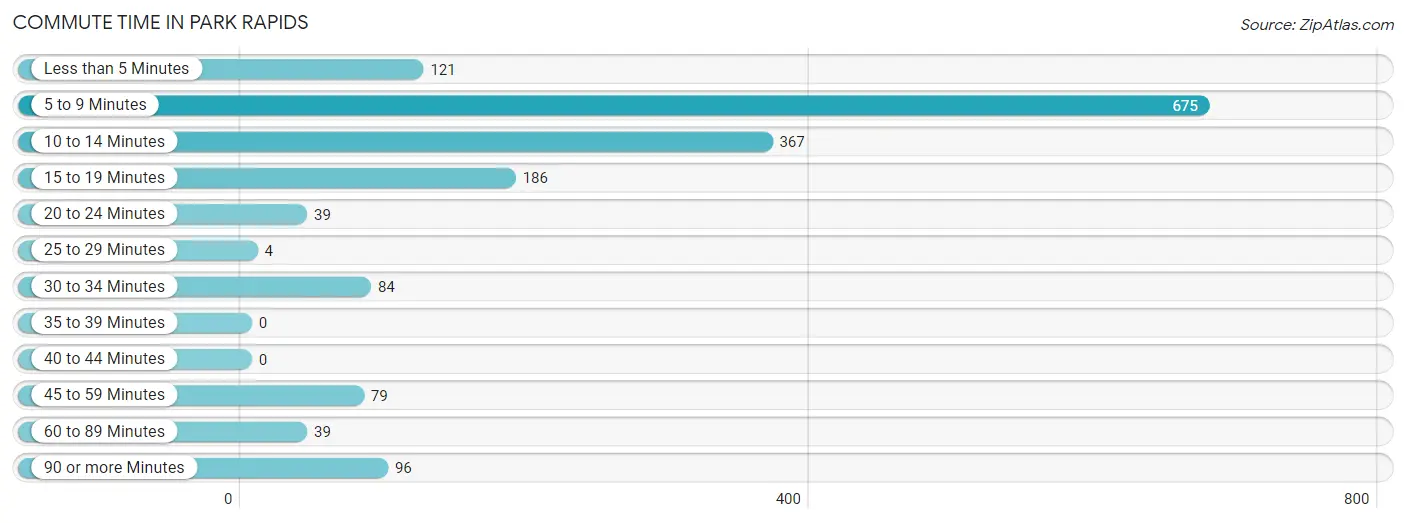
| Commute Time | # Commuters | % Commuters |
| Less than 5 Minutes | 121 | 7.2% |
| 5 to 9 Minutes | 675 | 39.9% |
| 10 to 14 Minutes | 367 | 21.7% |
| 15 to 19 Minutes | 186 | 11.0% |
| 20 to 24 Minutes | 39 | 2.3% |
| 25 to 29 Minutes | 4 | 0.2% |
| 30 to 34 Minutes | 84 | 5.0% |
| 35 to 39 Minutes | 0 | 0.0% |
| 40 to 44 Minutes | 0 | 0.0% |
| 45 to 59 Minutes | 79 | 4.7% |
| 60 to 89 Minutes | 39 | 2.3% |
| 90 or more Minutes | 96 | 5.7% |
Commute Time by Sex in Park Rapids
The most common commute times in Park Rapids are 5 to 9 minutes (285 commuters, 29.3%) for males and 5 to 9 minutes (390 commuters, 54.3%) for females.
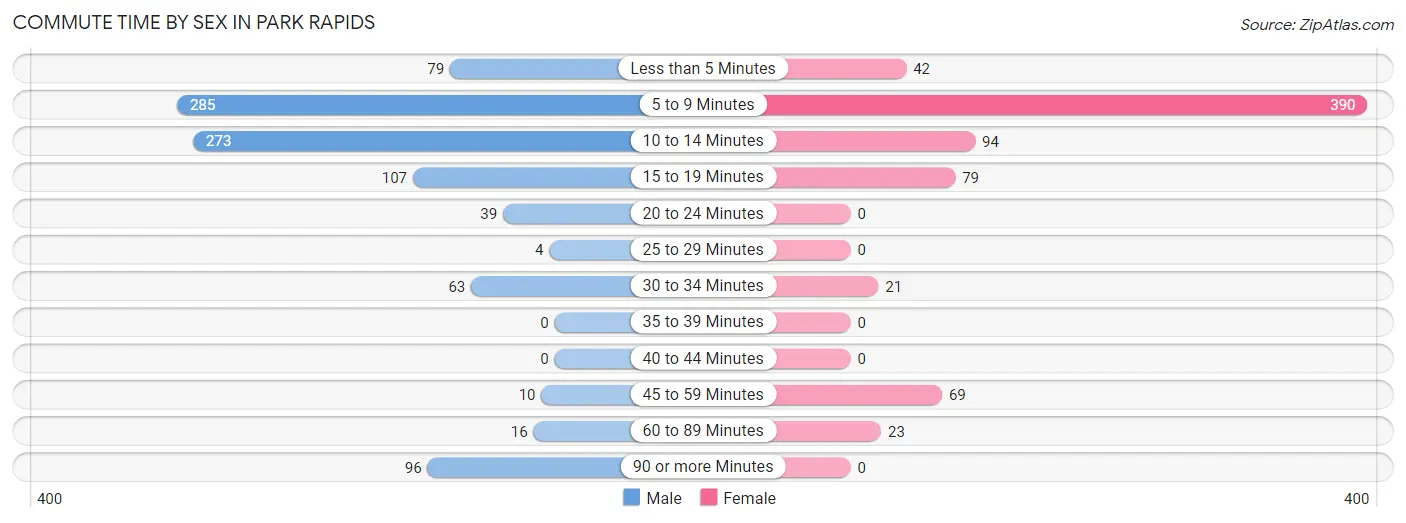
| Commute Time | Male | Female |
| Less than 5 Minutes | 79 (8.1%) | 42 (5.9%) |
| 5 to 9 Minutes | 285 (29.3%) | 390 (54.3%) |
| 10 to 14 Minutes | 273 (28.1%) | 94 (13.1%) |
| 15 to 19 Minutes | 107 (11.0%) | 79 (11.0%) |
| 20 to 24 Minutes | 39 (4.0%) | 0 (0.0%) |
| 25 to 29 Minutes | 4 (0.4%) | 0 (0.0%) |
| 30 to 34 Minutes | 63 (6.5%) | 21 (2.9%) |
| 35 to 39 Minutes | 0 (0.0%) | 0 (0.0%) |
| 40 to 44 Minutes | 0 (0.0%) | 0 (0.0%) |
| 45 to 59 Minutes | 10 (1.0%) | 69 (9.6%) |
| 60 to 89 Minutes | 16 (1.7%) | 23 (3.2%) |
| 90 or more Minutes | 96 (9.9%) | 0 (0.0%) |
Time of Departure to Work by Sex in Park Rapids
The most frequent times of departure to work in Park Rapids are 6:30 AM to 6:59 AM (162, 16.7%) for males and 7:00 AM to 7:29 AM (125, 17.4%) for females.
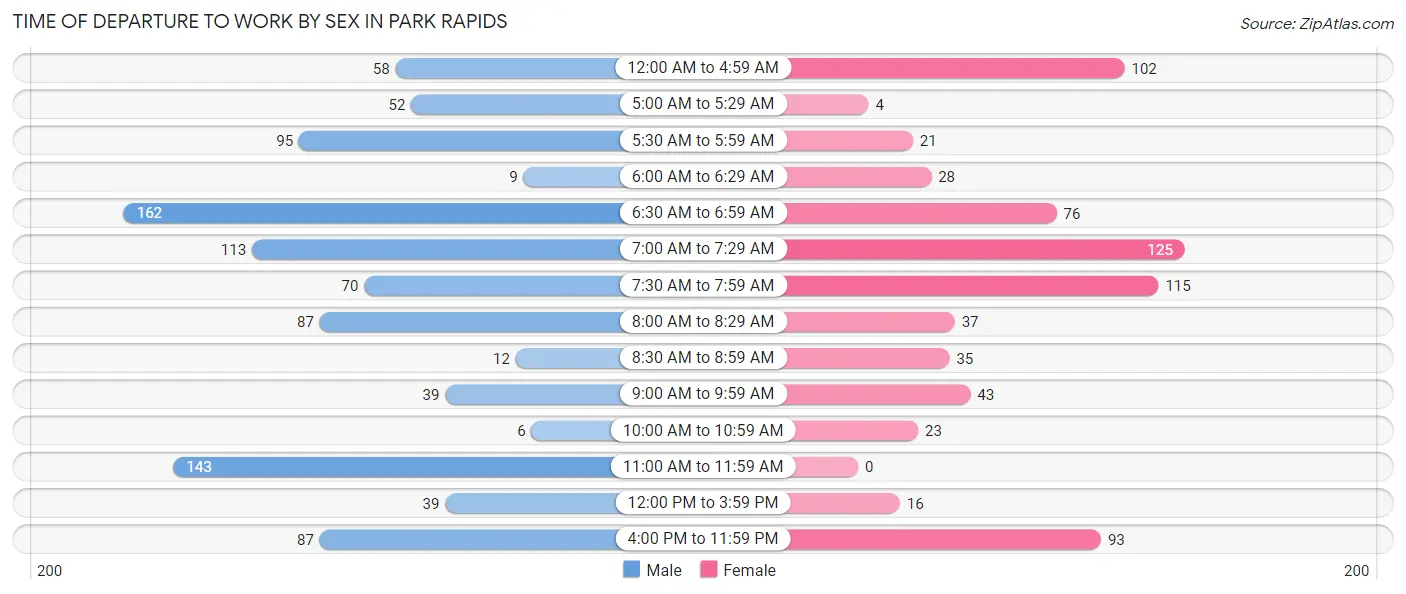
| Time of Departure | Male | Female |
| 12:00 AM to 4:59 AM | 58 (6.0%) | 102 (14.2%) |
| 5:00 AM to 5:29 AM | 52 (5.3%) | 4 (0.6%) |
| 5:30 AM to 5:59 AM | 95 (9.8%) | 21 (2.9%) |
| 6:00 AM to 6:29 AM | 9 (0.9%) | 28 (3.9%) |
| 6:30 AM to 6:59 AM | 162 (16.7%) | 76 (10.6%) |
| 7:00 AM to 7:29 AM | 113 (11.6%) | 125 (17.4%) |
| 7:30 AM to 7:59 AM | 70 (7.2%) | 115 (16.0%) |
| 8:00 AM to 8:29 AM | 87 (8.9%) | 37 (5.1%) |
| 8:30 AM to 8:59 AM | 12 (1.2%) | 35 (4.9%) |
| 9:00 AM to 9:59 AM | 39 (4.0%) | 43 (6.0%) |
| 10:00 AM to 10:59 AM | 6 (0.6%) | 23 (3.2%) |
| 11:00 AM to 11:59 AM | 143 (14.7%) | 0 (0.0%) |
| 12:00 PM to 3:59 PM | 39 (4.0%) | 16 (2.2%) |
| 4:00 PM to 11:59 PM | 87 (8.9%) | 93 (13.0%) |
| Total | 972 (100.0%) | 718 (100.0%) |
Housing Occupancy in Park Rapids
Occupancy by Ownership in Park Rapids
Of the total 1,857 dwellings in Park Rapids, owner-occupied units account for 837 (45.1%), while renter-occupied units make up 1,020 (54.9%).
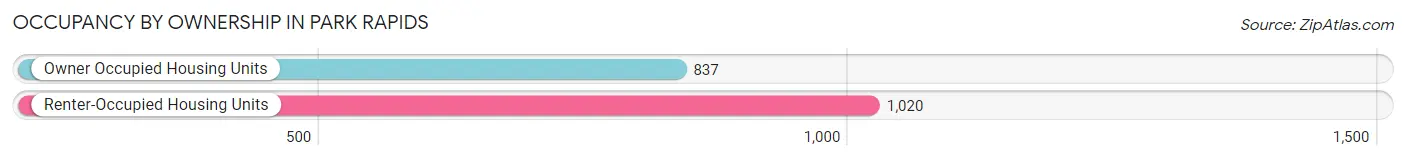
| Occupancy | # Housing Units | % Housing Units |
| Owner Occupied Housing Units | 837 | 45.1% |
| Renter-Occupied Housing Units | 1,020 | 54.9% |
| Total Occupied Housing Units | 1,857 | 100.0% |
Occupancy by Household Size in Park Rapids
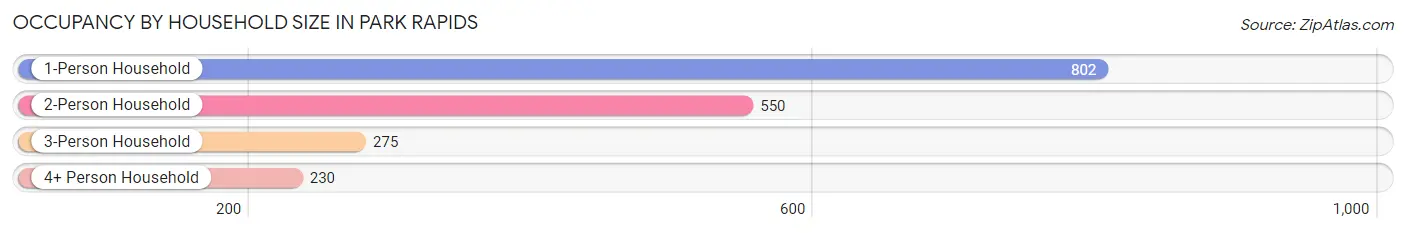
| Household Size | # Housing Units | % Housing Units |
| 1-Person Household | 802 | 43.2% |
| 2-Person Household | 550 | 29.6% |
| 3-Person Household | 275 | 14.8% |
| 4+ Person Household | 230 | 12.4% |
| Total Housing Units | 1,857 | 100.0% |
Occupancy by Ownership by Household Size in Park Rapids
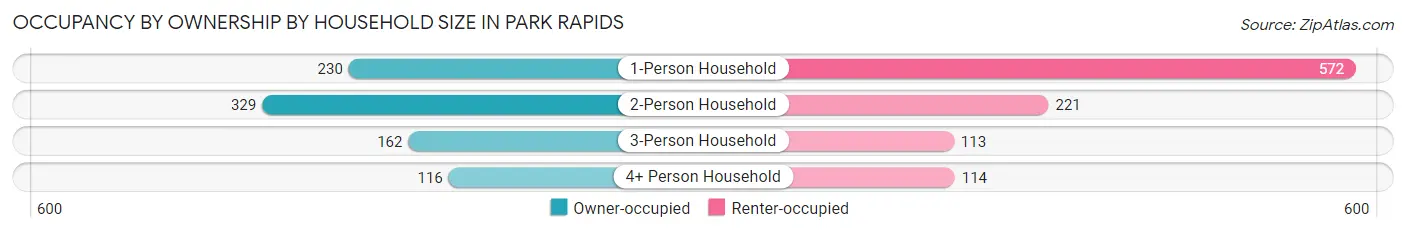
| Household Size | Owner-occupied | Renter-occupied |
| 1-Person Household | 230 (28.7%) | 572 (71.3%) |
| 2-Person Household | 329 (59.8%) | 221 (40.2%) |
| 3-Person Household | 162 (58.9%) | 113 (41.1%) |
| 4+ Person Household | 116 (50.4%) | 114 (49.6%) |
| Total Housing Units | 837 (45.1%) | 1,020 (54.9%) |
Occupancy by Educational Attainment in Park Rapids
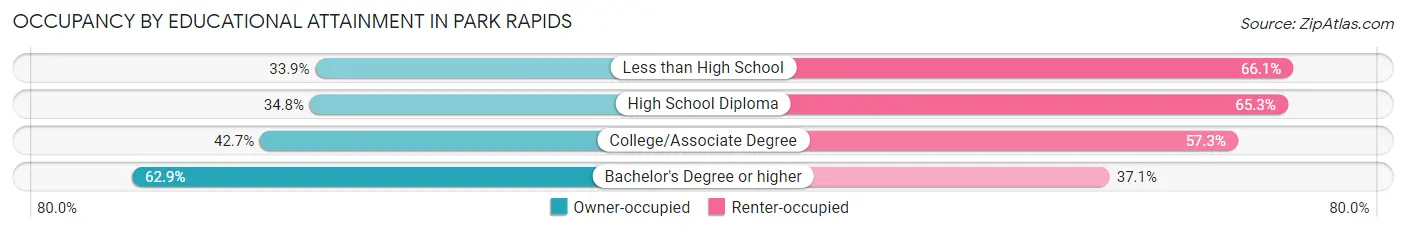
| Household Size | Owner-occupied | Renter-occupied |
| Less than High School | 83 (33.9%) | 162 (66.1%) |
| High School Diploma | 139 (34.7%) | 261 (65.2%) |
| College/Associate Degree | 311 (42.7%) | 418 (57.3%) |
| Bachelor's Degree or higher | 304 (62.9%) | 179 (37.1%) |
Occupancy by Age of Householder in Park Rapids
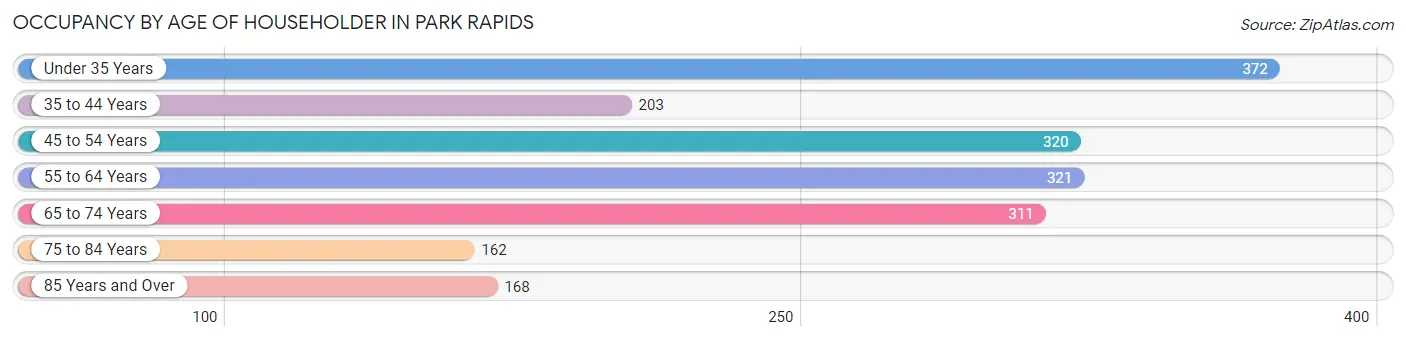
| Age Bracket | # Households | % Households |
| Under 35 Years | 372 | 20.0% |
| 35 to 44 Years | 203 | 10.9% |
| 45 to 54 Years | 320 | 17.2% |
| 55 to 64 Years | 321 | 17.3% |
| 65 to 74 Years | 311 | 16.8% |
| 75 to 84 Years | 162 | 8.7% |
| 85 Years and Over | 168 | 9.0% |
| Total | 1,857 | 100.0% |
Housing Finances in Park Rapids
Median Income by Occupancy in Park Rapids
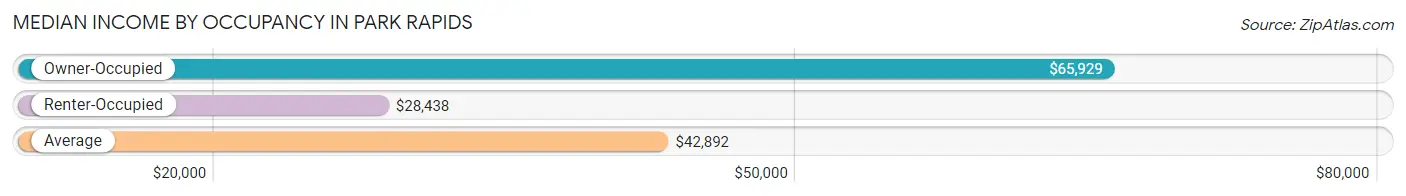
| Occupancy Type | # Households | Median Income |
| Owner-Occupied | 837 (45.1%) | $65,929 |
| Renter-Occupied | 1,020 (54.9%) | $28,438 |
| Average | 1,857 (100.0%) | $42,892 |
Occupancy by Householder Income Bracket in Park Rapids
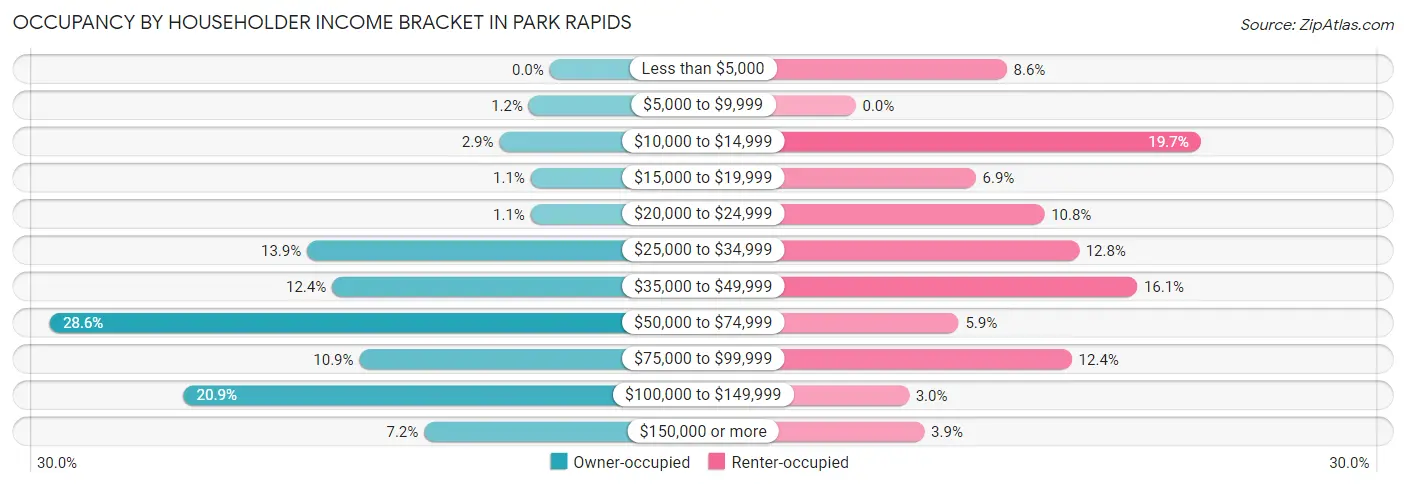
| Income Bracket | Owner-occupied | Renter-occupied |
| Less than $5,000 | 0 (0.0%) | 88 (8.6%) |
| $5,000 to $9,999 | 10 (1.2%) | 0 (0.0%) |
| $10,000 to $14,999 | 24 (2.9%) | 201 (19.7%) |
| $15,000 to $19,999 | 9 (1.1%) | 70 (6.9%) |
| $20,000 to $24,999 | 9 (1.1%) | 110 (10.8%) |
| $25,000 to $34,999 | 116 (13.9%) | 130 (12.8%) |
| $35,000 to $49,999 | 104 (12.4%) | 164 (16.1%) |
| $50,000 to $74,999 | 239 (28.5%) | 60 (5.9%) |
| $75,000 to $99,999 | 91 (10.9%) | 126 (12.3%) |
| $100,000 to $149,999 | 175 (20.9%) | 31 (3.0%) |
| $150,000 or more | 60 (7.2%) | 40 (3.9%) |
| Total | 837 (100.0%) | 1,020 (100.0%) |
Monthly Housing Cost Tiers in Park Rapids
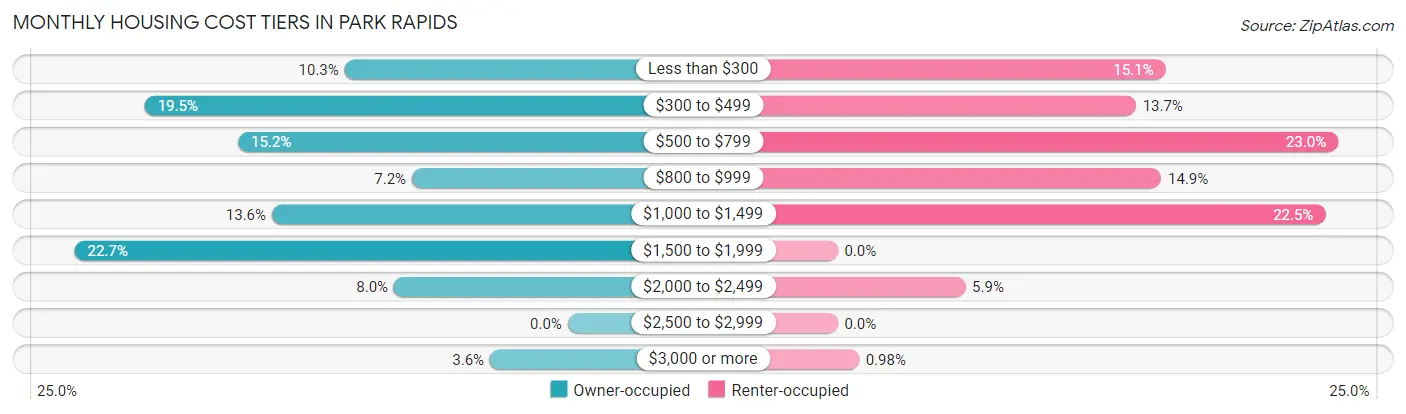
| Monthly Cost | Owner-occupied | Renter-occupied |
| Less than $300 | 86 (10.3%) | 154 (15.1%) |
| $300 to $499 | 163 (19.5%) | 140 (13.7%) |
| $500 to $799 | 127 (15.2%) | 235 (23.0%) |
| $800 to $999 | 60 (7.2%) | 152 (14.9%) |
| $1,000 to $1,499 | 114 (13.6%) | 229 (22.5%) |
| $1,500 to $1,999 | 190 (22.7%) | 0 (0.0%) |
| $2,000 to $2,499 | 67 (8.0%) | 60 (5.9%) |
| $2,500 to $2,999 | 0 (0.0%) | 0 (0.0%) |
| $3,000 or more | 30 (3.6%) | 10 (1.0%) |
| Total | 837 (100.0%) | 1,020 (100.0%) |
Physical Housing Characteristics in Park Rapids
Housing Structures in Park Rapids
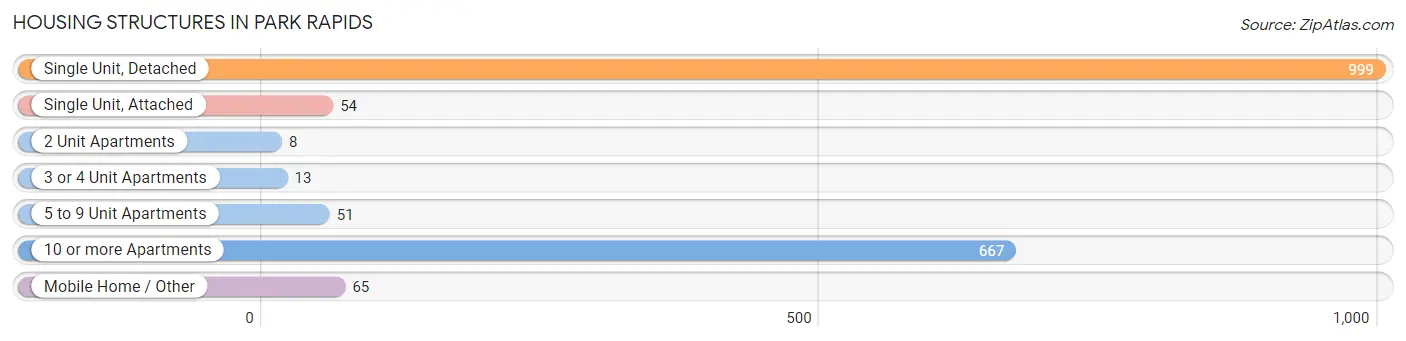
| Structure Type | # Housing Units | % Housing Units |
| Single Unit, Detached | 999 | 53.8% |
| Single Unit, Attached | 54 | 2.9% |
| 2 Unit Apartments | 8 | 0.4% |
| 3 or 4 Unit Apartments | 13 | 0.7% |
| 5 to 9 Unit Apartments | 51 | 2.8% |
| 10 or more Apartments | 667 | 35.9% |
| Mobile Home / Other | 65 | 3.5% |
| Total | 1,857 | 100.0% |
Housing Structures by Occupancy in Park Rapids
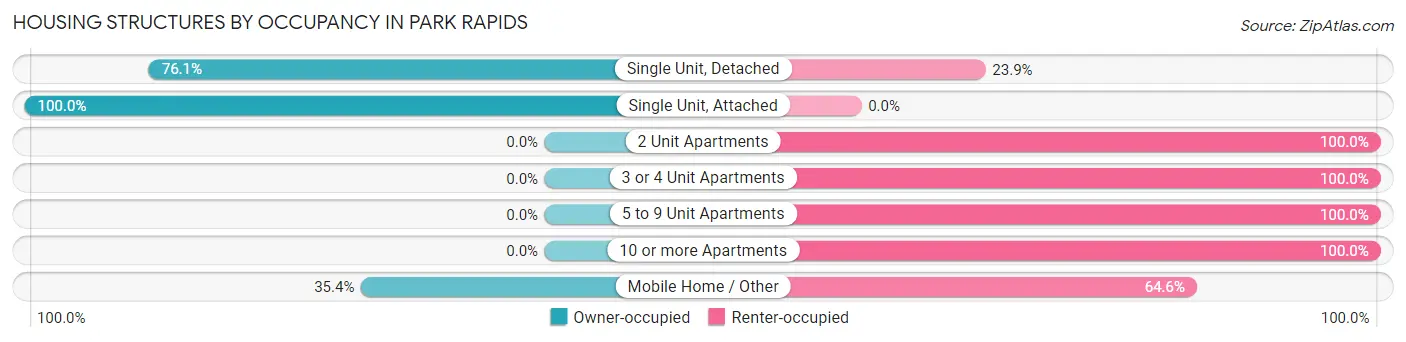
| Structure Type | Owner-occupied | Renter-occupied |
| Single Unit, Detached | 760 (76.1%) | 239 (23.9%) |
| Single Unit, Attached | 54 (100.0%) | 0 (0.0%) |
| 2 Unit Apartments | 0 (0.0%) | 8 (100.0%) |
| 3 or 4 Unit Apartments | 0 (0.0%) | 13 (100.0%) |
| 5 to 9 Unit Apartments | 0 (0.0%) | 51 (100.0%) |
| 10 or more Apartments | 0 (0.0%) | 667 (100.0%) |
| Mobile Home / Other | 23 (35.4%) | 42 (64.6%) |
| Total | 837 (45.1%) | 1,020 (54.9%) |
Housing Structures by Number of Rooms in Park Rapids
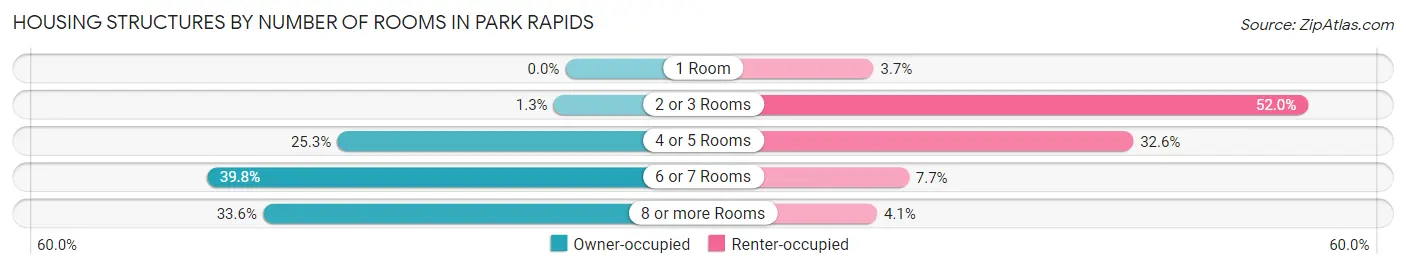
| Number of Rooms | Owner-occupied | Renter-occupied |
| 1 Room | 0 (0.0%) | 38 (3.7%) |
| 2 or 3 Rooms | 11 (1.3%) | 530 (52.0%) |
| 4 or 5 Rooms | 212 (25.3%) | 332 (32.6%) |
| 6 or 7 Rooms | 333 (39.8%) | 78 (7.6%) |
| 8 or more Rooms | 281 (33.6%) | 42 (4.1%) |
| Total | 837 (100.0%) | 1,020 (100.0%) |
Housing Structure by Heating Type in Park Rapids
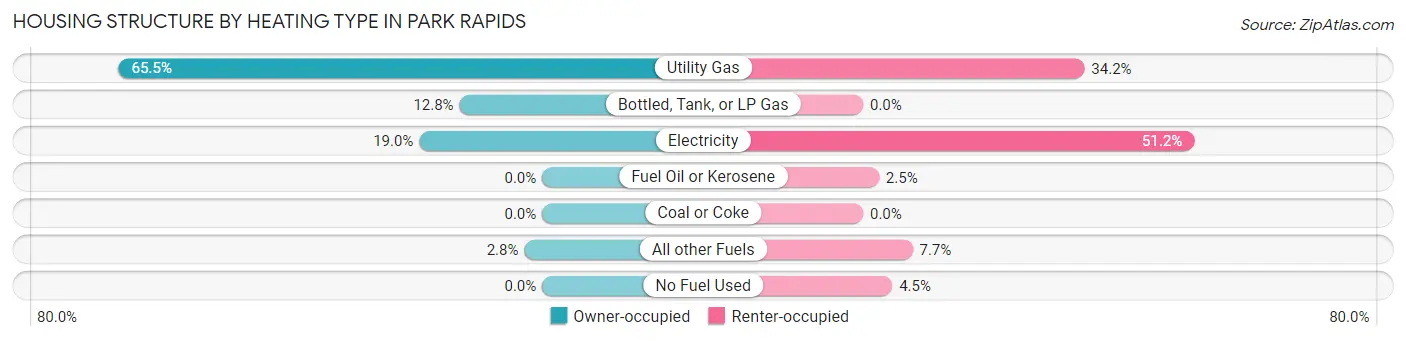
| Heating Type | Owner-occupied | Renter-occupied |
| Utility Gas | 548 (65.5%) | 349 (34.2%) |
| Bottled, Tank, or LP Gas | 107 (12.8%) | 0 (0.0%) |
| Electricity | 159 (19.0%) | 522 (51.2%) |
| Fuel Oil or Kerosene | 0 (0.0%) | 25 (2.5%) |
| Coal or Coke | 0 (0.0%) | 0 (0.0%) |
| All other Fuels | 23 (2.8%) | 78 (7.6%) |
| No Fuel Used | 0 (0.0%) | 46 (4.5%) |
| Total | 837 (100.0%) | 1,020 (100.0%) |
Household Vehicle Usage in Park Rapids
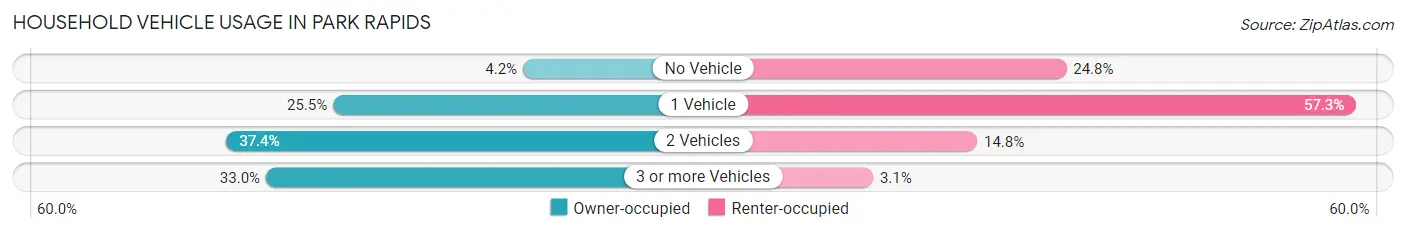
| Vehicles per Household | Owner-occupied | Renter-occupied |
| No Vehicle | 35 (4.2%) | 253 (24.8%) |
| 1 Vehicle | 213 (25.5%) | 584 (57.3%) |
| 2 Vehicles | 313 (37.4%) | 151 (14.8%) |
| 3 or more Vehicles | 276 (33.0%) | 32 (3.1%) |
| Total | 837 (100.0%) | 1,020 (100.0%) |
Real Estate & Mortgages in Park Rapids
Real Estate and Mortgage Overview in Park Rapids
| Characteristic | Without Mortgage | With Mortgage |
| Housing Units | 382 | 455 |
| Median Property Value | $214,800 | $229,400 |
| Median Household Income | $42,212 | $42 |
| Monthly Housing Costs | $406 | $19 |
| Real Estate Taxes | $2,088 | $20 |
Property Value by Mortgage Status in Park Rapids
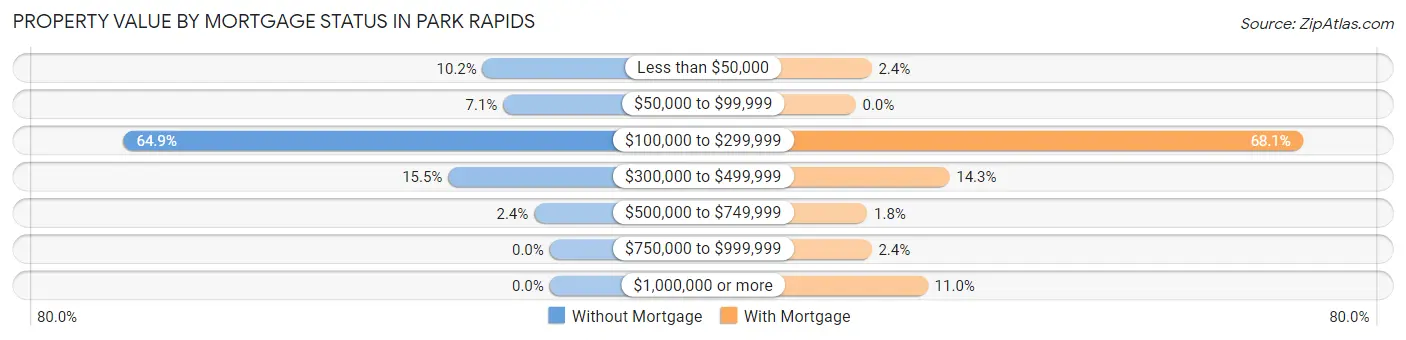
| Property Value | Without Mortgage | With Mortgage |
| Less than $50,000 | 39 (10.2%) | 11 (2.4%) |
| $50,000 to $99,999 | 27 (7.1%) | 0 (0.0%) |
| $100,000 to $299,999 | 248 (64.9%) | 310 (68.1%) |
| $300,000 to $499,999 | 59 (15.4%) | 65 (14.3%) |
| $500,000 to $749,999 | 9 (2.4%) | 8 (1.8%) |
| $750,000 to $999,999 | 0 (0.0%) | 11 (2.4%) |
| $1,000,000 or more | 0 (0.0%) | 50 (11.0%) |
| Total | 382 (100.0%) | 455 (100.0%) |
Household Income by Mortgage Status in Park Rapids
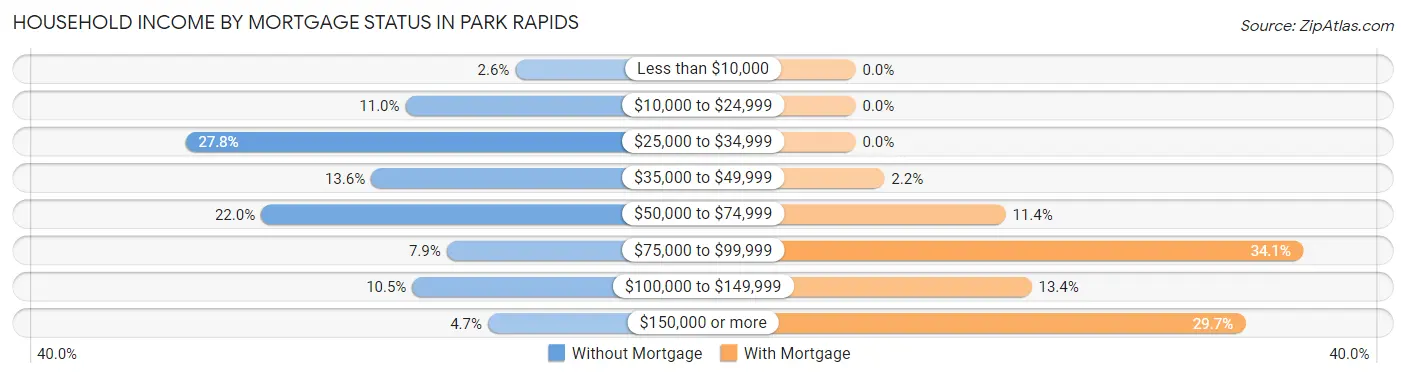
| Household Income | Without Mortgage | With Mortgage |
| Less than $10,000 | 10 (2.6%) | 0 (0.0%) |
| $10,000 to $24,999 | 42 (11.0%) | 0 (0.0%) |
| $25,000 to $34,999 | 106 (27.8%) | 0 (0.0%) |
| $35,000 to $49,999 | 52 (13.6%) | 10 (2.2%) |
| $50,000 to $74,999 | 84 (22.0%) | 52 (11.4%) |
| $75,000 to $99,999 | 30 (7.9%) | 155 (34.1%) |
| $100,000 to $149,999 | 40 (10.5%) | 61 (13.4%) |
| $150,000 or more | 18 (4.7%) | 135 (29.7%) |
| Total | 382 (100.0%) | 455 (100.0%) |
Property Value to Household Income Ratio in Park Rapids
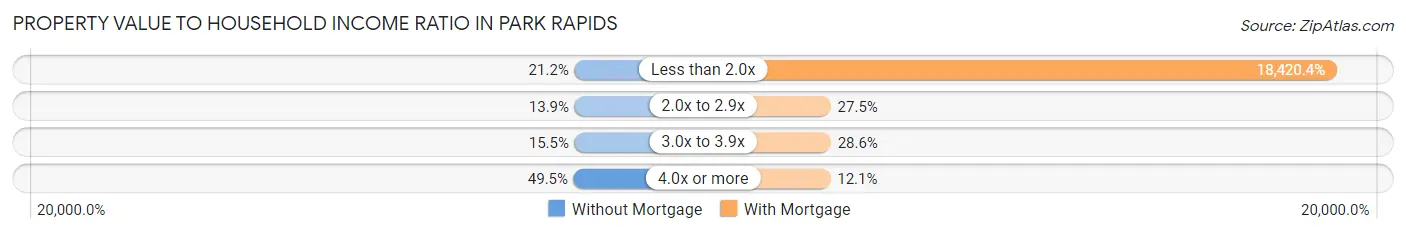
| Value-to-Income Ratio | Without Mortgage | With Mortgage |
| Less than 2.0x | 81 (21.2%) | 83,813 (18,420.4%) |
| 2.0x to 2.9x | 53 (13.9%) | 125 (27.5%) |
| 3.0x to 3.9x | 59 (15.4%) | 130 (28.6%) |
| 4.0x or more | 189 (49.5%) | 55 (12.1%) |
| Total | 382 (100.0%) | 455 (100.0%) |
Real Estate Taxes by Mortgage Status in Park Rapids
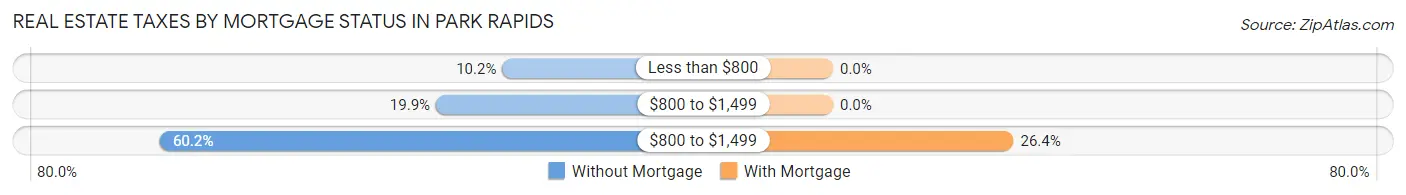
| Property Taxes | Without Mortgage | With Mortgage |
| Less than $800 | 39 (10.2%) | 0 (0.0%) |
| $800 to $1,499 | 76 (19.9%) | 0 (0.0%) |
| $800 to $1,499 | 230 (60.2%) | 120 (26.4%) |
| Total | 382 (100.0%) | 455 (100.0%) |
Health & Disability in Park Rapids
Health Insurance Coverage by Age in Park Rapids
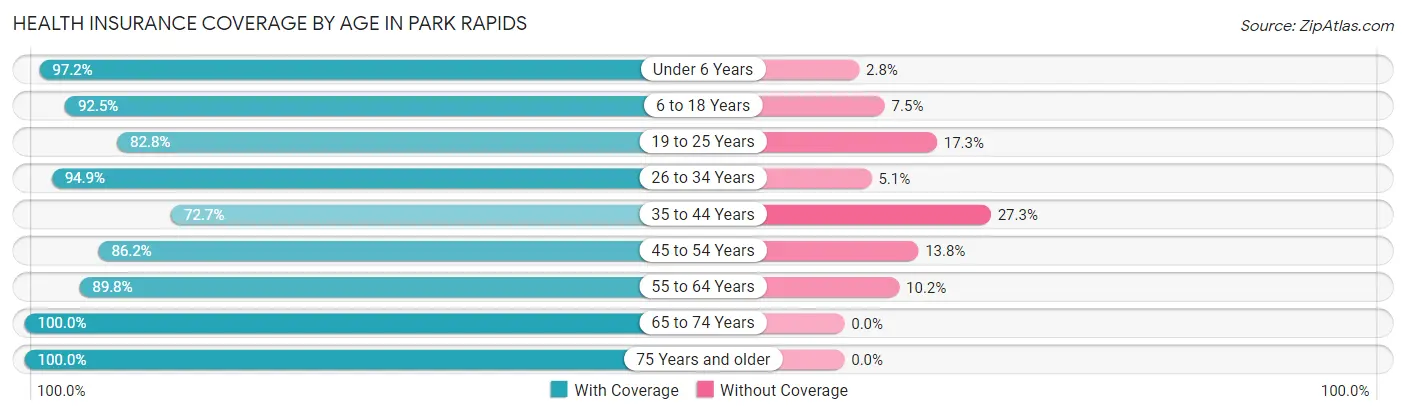
| Age Bracket | With Coverage | Without Coverage |
| Under 6 Years | 282 (97.2%) | 8 (2.8%) |
| 6 to 18 Years | 565 (92.5%) | 46 (7.5%) |
| 19 to 25 Years | 355 (82.8%) | 74 (17.2%) |
| 26 to 34 Years | 375 (94.9%) | 20 (5.1%) |
| 35 to 44 Years | 322 (72.7%) | 121 (27.3%) |
| 45 to 54 Years | 388 (86.2%) | 62 (13.8%) |
| 55 to 64 Years | 413 (89.8%) | 47 (10.2%) |
| 65 to 74 Years | 432 (100.0%) | 0 (0.0%) |
| 75 Years and older | 485 (100.0%) | 0 (0.0%) |
| Total | 3,617 (90.5%) | 378 (9.5%) |
Health Insurance Coverage by Citizenship Status in Park Rapids
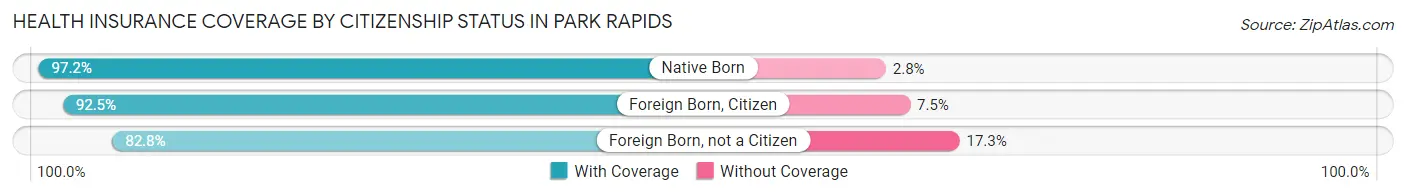
| Citizenship Status | With Coverage | Without Coverage |
| Native Born | 282 (97.2%) | 8 (2.8%) |
| Foreign Born, Citizen | 565 (92.5%) | 46 (7.5%) |
| Foreign Born, not a Citizen | 355 (82.8%) | 74 (17.2%) |
Health Insurance Coverage by Household Income in Park Rapids
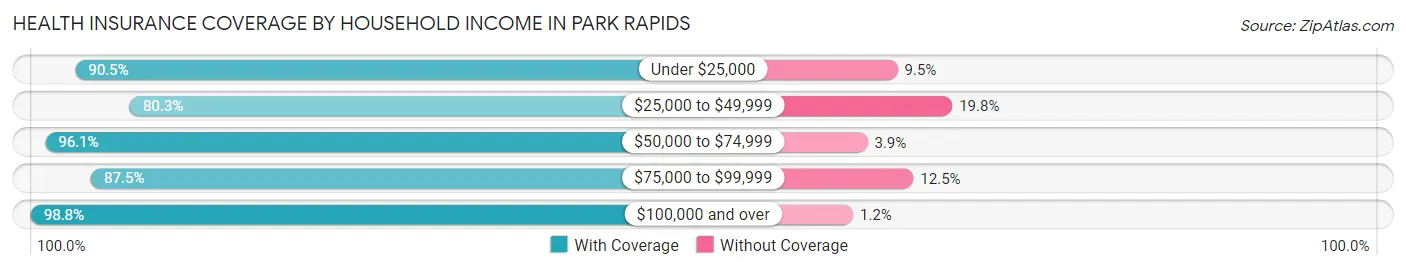
| Household Income | With Coverage | Without Coverage |
| Under $25,000 | 561 (90.5%) | 59 (9.5%) |
| $25,000 to $49,999 | 780 (80.2%) | 192 (19.8%) |
| $50,000 to $74,999 | 668 (96.1%) | 27 (3.9%) |
| $75,000 to $99,999 | 624 (87.5%) | 89 (12.5%) |
| $100,000 and over | 919 (98.8%) | 11 (1.2%) |
Public vs Private Health Insurance Coverage by Age in Park Rapids
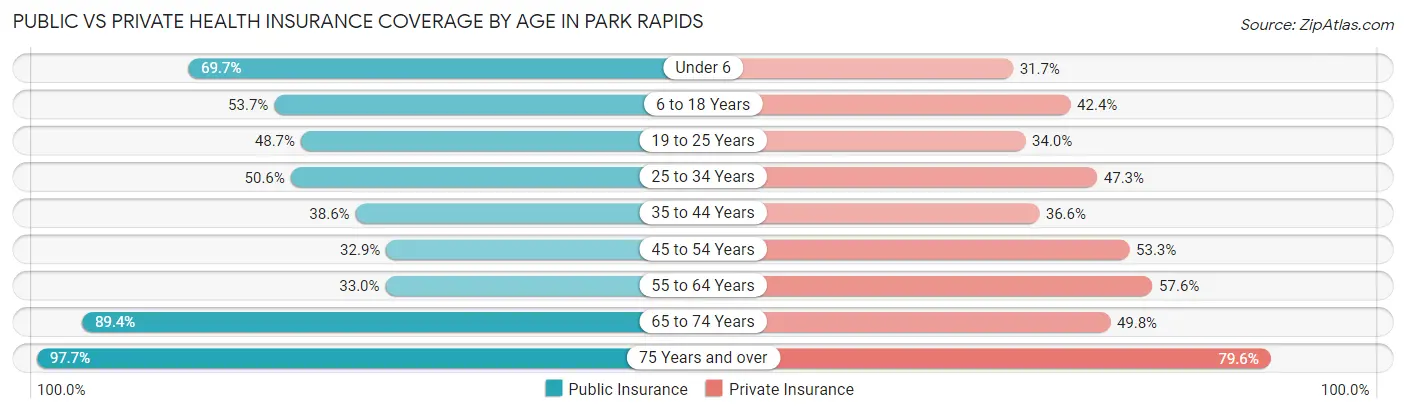
| Age Bracket | Public Insurance | Private Insurance |
| Under 6 | 202 (69.7%) | 92 (31.7%) |
| 6 to 18 Years | 328 (53.7%) | 259 (42.4%) |
| 19 to 25 Years | 209 (48.7%) | 146 (34.0%) |
| 25 to 34 Years | 200 (50.6%) | 187 (47.3%) |
| 35 to 44 Years | 171 (38.6%) | 162 (36.6%) |
| 45 to 54 Years | 148 (32.9%) | 240 (53.3%) |
| 55 to 64 Years | 152 (33.0%) | 265 (57.6%) |
| 65 to 74 Years | 386 (89.3%) | 215 (49.8%) |
| 75 Years and over | 474 (97.7%) | 386 (79.6%) |
| Total | 2,270 (56.8%) | 1,952 (48.9%) |
Disability Status by Sex by Age in Park Rapids
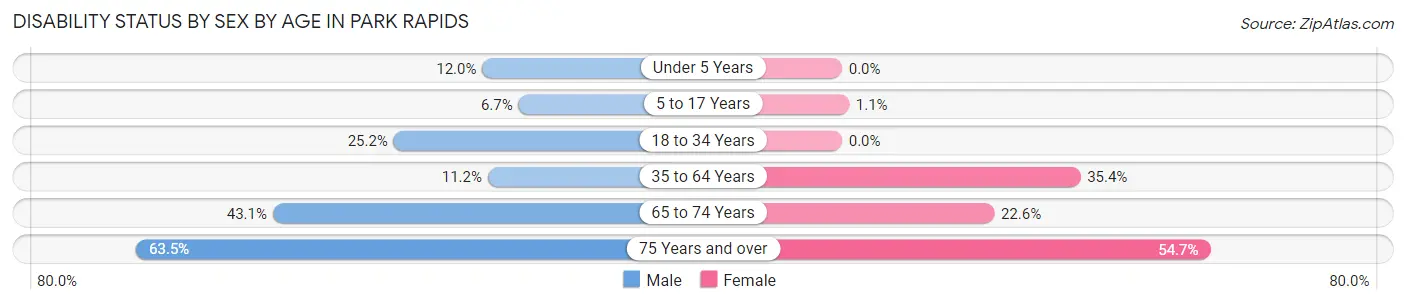
| Age Bracket | Male | Female |
| Under 5 Years | 13 (12.0%) | 0 (0.0%) |
| 5 to 17 Years | 22 (6.7%) | 3 (1.1%) |
| 18 to 34 Years | 97 (25.2%) | 0 (0.0%) |
| 35 to 64 Years | 83 (11.2%) | 217 (35.4%) |
| 65 to 74 Years | 110 (43.1%) | 40 (22.6%) |
| 75 Years and over | 99 (63.5%) | 180 (54.7%) |
Disability Class by Sex by Age in Park Rapids
Disability Class: Hearing Difficulty
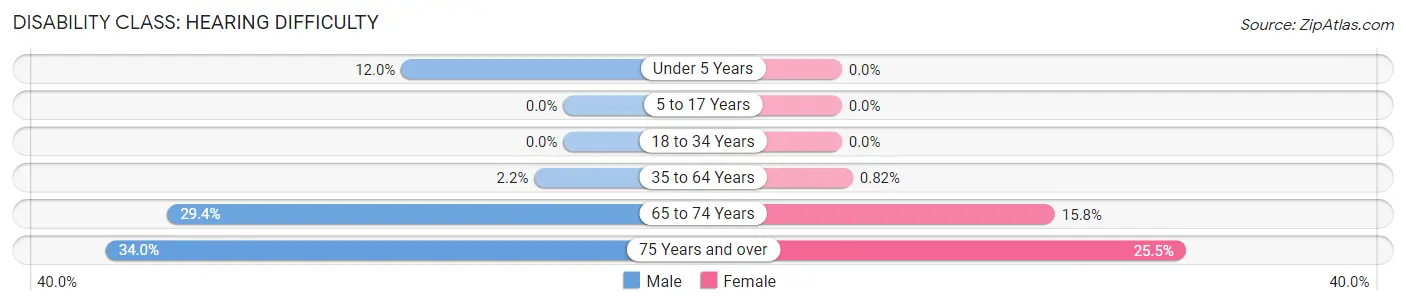
| Age Bracket | Male | Female |
| Under 5 Years | 13 (12.0%) | 0 (0.0%) |
| 5 to 17 Years | 0 (0.0%) | 0 (0.0%) |
| 18 to 34 Years | 0 (0.0%) | 0 (0.0%) |
| 35 to 64 Years | 16 (2.2%) | 5 (0.8%) |
| 65 to 74 Years | 75 (29.4%) | 28 (15.8%) |
| 75 Years and over | 53 (34.0%) | 84 (25.5%) |
Disability Class: Vision Difficulty
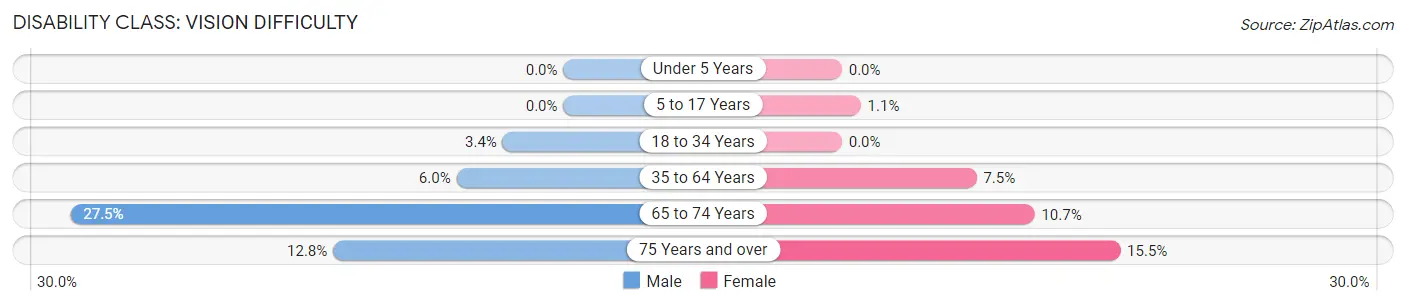
| Age Bracket | Male | Female |
| Under 5 Years | 0 (0.0%) | 0 (0.0%) |
| 5 to 17 Years | 0 (0.0%) | 3 (1.1%) |
| 18 to 34 Years | 13 (3.4%) | 0 (0.0%) |
| 35 to 64 Years | 44 (5.9%) | 46 (7.5%) |
| 65 to 74 Years | 70 (27.5%) | 19 (10.7%) |
| 75 Years and over | 20 (12.8%) | 51 (15.5%) |
Disability Class: Cognitive Difficulty
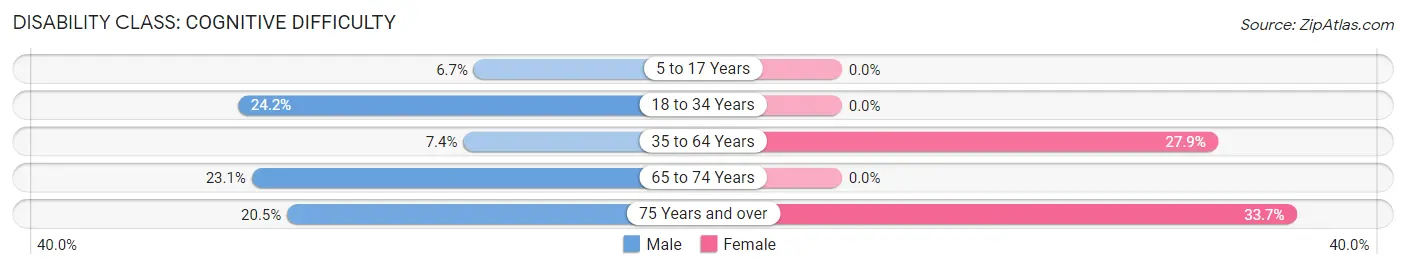
| Age Bracket | Male | Female |
| 5 to 17 Years | 22 (6.7%) | 0 (0.0%) |
| 18 to 34 Years | 93 (24.2%) | 0 (0.0%) |
| 35 to 64 Years | 55 (7.4%) | 171 (27.9%) |
| 65 to 74 Years | 59 (23.1%) | 0 (0.0%) |
| 75 Years and over | 32 (20.5%) | 111 (33.7%) |
Disability Class: Ambulatory Difficulty
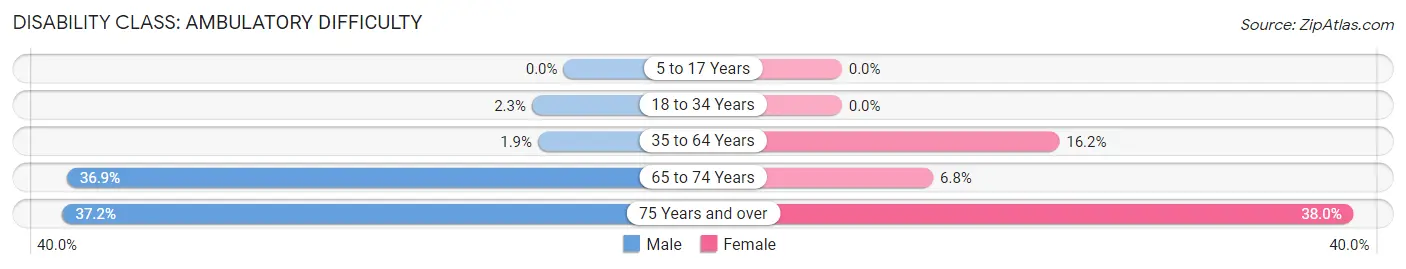
| Age Bracket | Male | Female |
| 5 to 17 Years | 0 (0.0%) | 0 (0.0%) |
| 18 to 34 Years | 9 (2.3%) | 0 (0.0%) |
| 35 to 64 Years | 14 (1.9%) | 99 (16.2%) |
| 65 to 74 Years | 94 (36.9%) | 12 (6.8%) |
| 75 Years and over | 58 (37.2%) | 125 (38.0%) |
Disability Class: Self-Care Difficulty
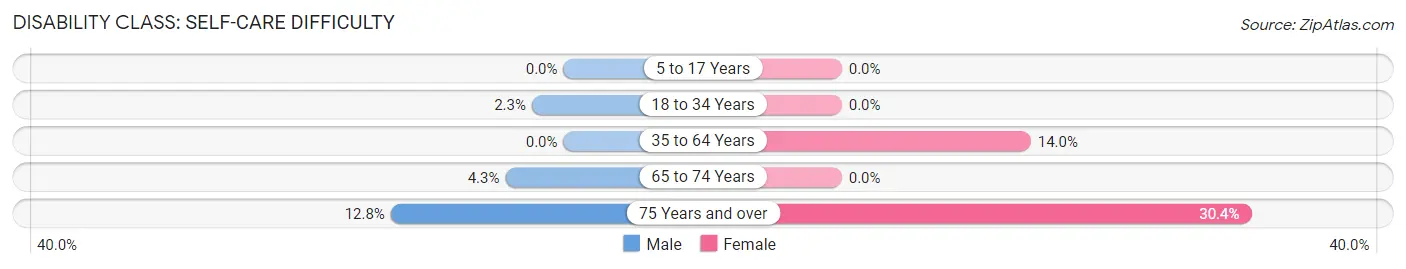
| Age Bracket | Male | Female |
| 5 to 17 Years | 0 (0.0%) | 0 (0.0%) |
| 18 to 34 Years | 9 (2.3%) | 0 (0.0%) |
| 35 to 64 Years | 0 (0.0%) | 86 (14.0%) |
| 65 to 74 Years | 11 (4.3%) | 0 (0.0%) |
| 75 Years and over | 20 (12.8%) | 100 (30.4%) |
Technology Access in Park Rapids
Computing Device Access in Park Rapids
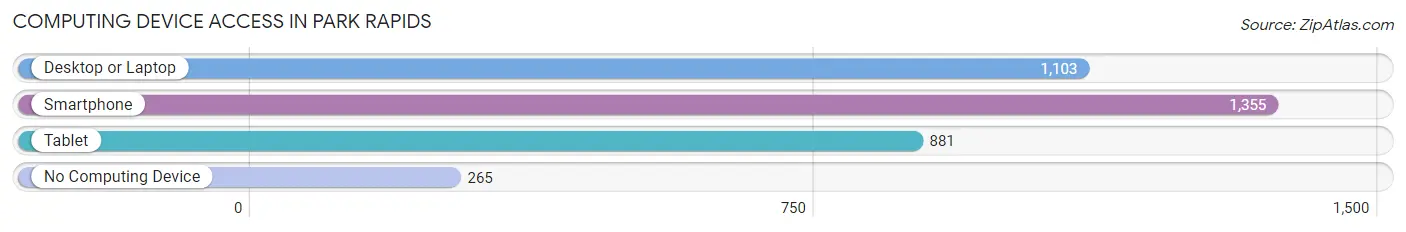
| Device Type | # Households | % Households |
| Desktop or Laptop | 1,103 | 59.4% |
| Smartphone | 1,355 | 73.0% |
| Tablet | 881 | 47.4% |
| No Computing Device | 265 | 14.3% |
| Total | 1,857 | 100.0% |
Internet Access in Park Rapids
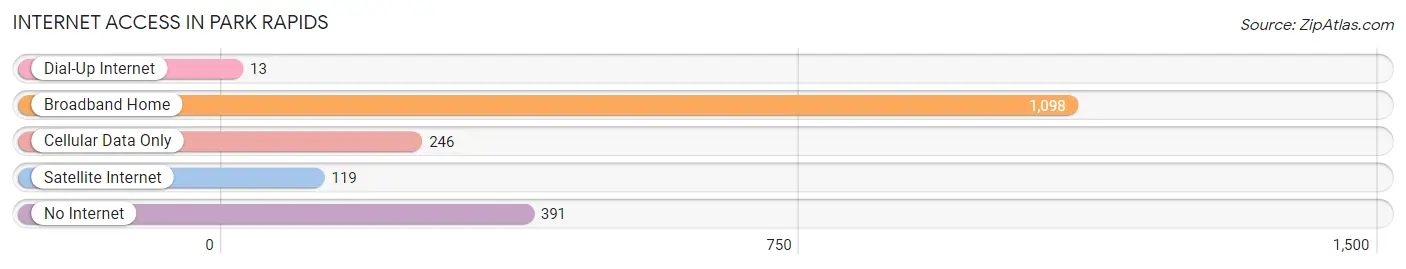
| Internet Type | # Households | % Households |
| Dial-Up Internet | 13 | 0.7% |
| Broadband Home | 1,098 | 59.1% |
| Cellular Data Only | 246 | 13.3% |
| Satellite Internet | 119 | 6.4% |
| No Internet | 391 | 21.1% |
| Total | 1,857 | 100.0% |
Park Rapids Summary
History
The area now known as Park Rapids, Minnesota was first inhabited by the Ojibwe people, who were the first to settle in the area. The Ojibwe were a nomadic people who moved around the area in search of food and resources. They were known for their fishing and hunting skills, and they were also known for their spiritual beliefs and ceremonies.
The first European settlers to the area were French fur traders, who arrived in the late 1700s. They established trading posts in the area and traded with the Ojibwe people for furs and other goods. The area was also home to a number of logging camps, which were established in the late 1800s. Logging was an important industry in the area, and it helped to shape the economy of the region.
In the late 1800s, the area was surveyed and platted for settlement. The town of Park Rapids was officially established in 1887, and it was named after the nearby rapids on the Mississippi River. The town quickly grew, and by the early 1900s it had become a bustling community with a variety of businesses and services.
The town continued to grow throughout the 20th century, and it became a popular tourist destination. The area is known for its lakes and rivers, and it is a popular destination for fishing, boating, and other outdoor activities.
Geography
Park Rapids is located in northern Minnesota, in the heart of Hubbard County. The town is situated on the banks of the Mississippi River, and it is surrounded by a number of lakes and rivers. The area is known for its natural beauty, and it is a popular destination for outdoor recreation.
The town is located in a region of rolling hills and forests, and it is home to a variety of wildlife. The area is known for its abundance of lakes and rivers, and it is a popular destination for fishing, boating, and other outdoor activities.
Economy
The economy of Park Rapids is largely based on tourism and outdoor recreation. The area is known for its natural beauty, and it is a popular destination for fishing, boating, and other outdoor activities. The town is also home to a number of businesses, including restaurants, retail stores, and other services.
The town is also home to a number of manufacturing companies, including a paper mill and a wood products company. The town is also home to a number of healthcare facilities, including a hospital and a number of clinics.
Demographics
As of the 2010 census, the population of Park Rapids was 2,919. The town has a median age of 44.7 years, and the median household income is $41,945. The town is predominantly white, with 91.3% of the population identifying as white. The town is also home to a small Hispanic population, with 4.2% of the population identifying as Hispanic or Latino. The town is also home to a small Native American population, with 1.2% of the population identifying as Native American.
Common Questions
What is Per Capita Income in Park Rapids?
Per Capita income in Park Rapids is $32,320.
What is the Median Family Income in Park Rapids?
Median Family Income in Park Rapids is $57,639.
What is the Median Household income in Park Rapids?
Median Household Income in Park Rapids is $42,892.
What is Income or Wage Gap in Park Rapids?
Income or Wage Gap in Park Rapids is 27.5%.
Women in Park Rapids earn 72.5 cents for every dollar earned by a man.
What is Inequality or Gini Index in Park Rapids?
Inequality or Gini Index in Park Rapids is 0.54.
What is the Total Population of Park Rapids?
Total Population of Park Rapids is 4,163.
What is the Total Male Population of Park Rapids?
Total Male Population of Park Rapids is 2,048.
What is the Total Female Population of Park Rapids?
Total Female Population of Park Rapids is 2,115.
What is the Ratio of Males per 100 Females in Park Rapids?
There are 96.83 Males per 100 Females in Park Rapids.
What is the Ratio of Females per 100 Males in Park Rapids?
There are 103.27 Females per 100 Males in Park Rapids.
What is the Median Population Age in Park Rapids?
Median Population Age in Park Rapids is 43.1 Years.
What is the Average Family Size in Park Rapids
Average Family Size in Park Rapids is 2.8 People.
What is the Average Household Size in Park Rapids
Average Household Size in Park Rapids is 2.1 People.
How Large is the Labor Force in Park Rapids?
There are 2,028 People in the Labor Forcein in Park Rapids.
What is the Percentage of People in the Labor Force in Park Rapids?
58.3% of People are in the Labor Force in Park Rapids.
What is the Unemployment Rate in Park Rapids?
Unemployment Rate in Park Rapids is 5.2%.