Brownton, MN Map & Demographics
Brownton Map
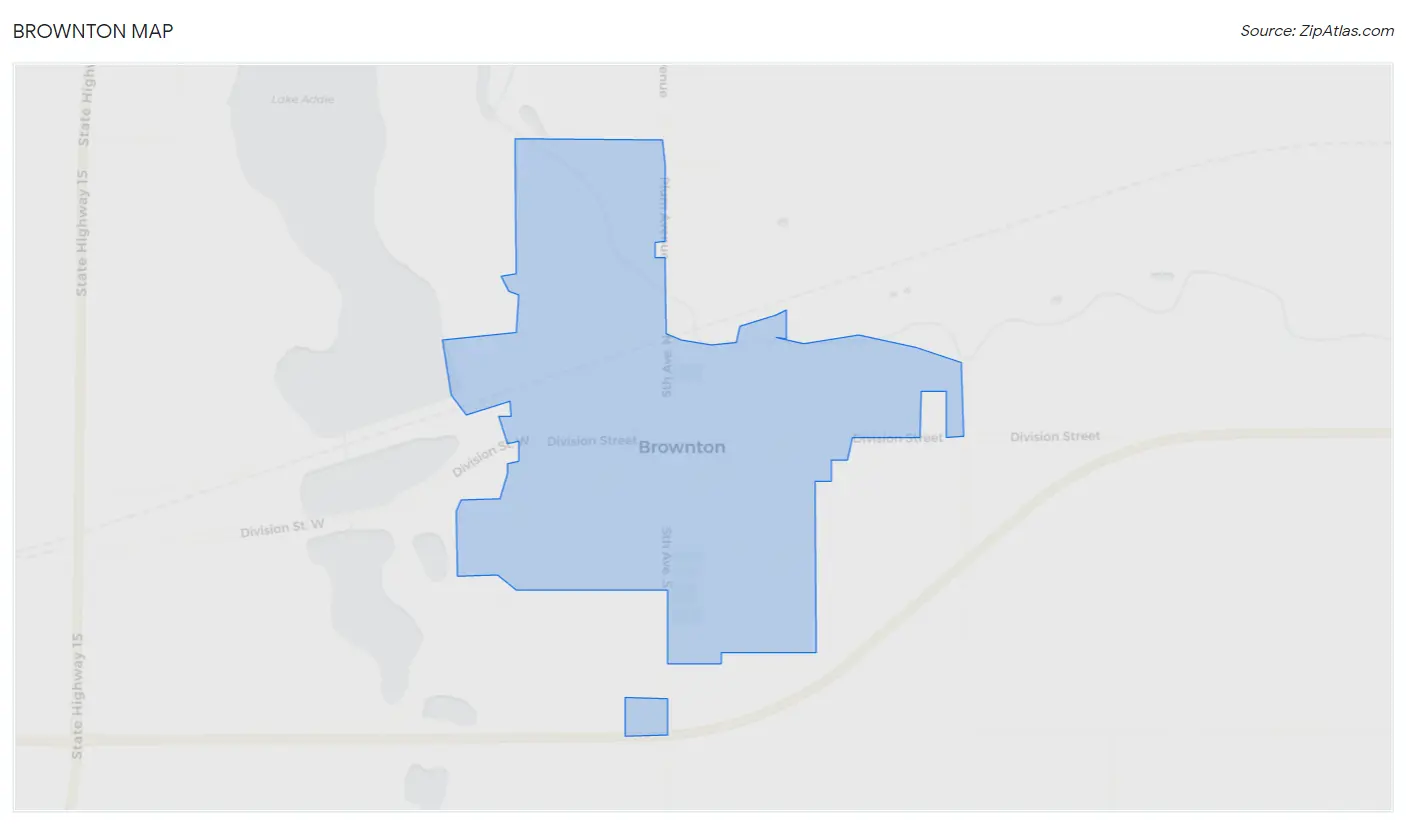
Brownton Overview
$33,647
PER CAPITA INCOME
$76,250
AVG FAMILY INCOME
$75,139
AVG HOUSEHOLD INCOME
39.8%
WAGE / INCOME GAP [ % ]
60.2¢/ $1
WAGE / INCOME GAP [ $ ]
0.34
INEQUALITY / GINI INDEX
544
TOTAL POPULATION
258
MALE POPULATION
286
FEMALE POPULATION
90.21
MALES / 100 FEMALES
110.85
FEMALES / 100 MALES
46.8
MEDIAN AGE
2.7
AVG FAMILY SIZE
2.3
AVG HOUSEHOLD SIZE
286
LABOR FORCE [ PEOPLE ]
60.9%
PERCENT IN LABOR FORCE
4.5%
UNEMPLOYMENT RATE
Brownton Zip Codes
Brownton Area Codes
Income in Brownton
Income Overview in Brownton
Per Capita Income in Brownton is $33,647, while median incomes of families and households are $76,250 and $75,139 respectively.
| Characteristic | Number | Measure |
| Per Capita Income | 544 | $33,647 |
| Median Family Income | 169 | $76,250 |
| Mean Family Income | 169 | $84,269 |
| Median Household Income | 239 | $75,139 |
| Mean Household Income | 239 | $75,302 |
| Income Deficit | 169 | $0 |
| Wage / Income Gap (%) | 544 | 39.83% |
| Wage / Income Gap ($) | 544 | 60.17¢ per $1 |
| Gini / Inequality Index | 544 | 0.34 |
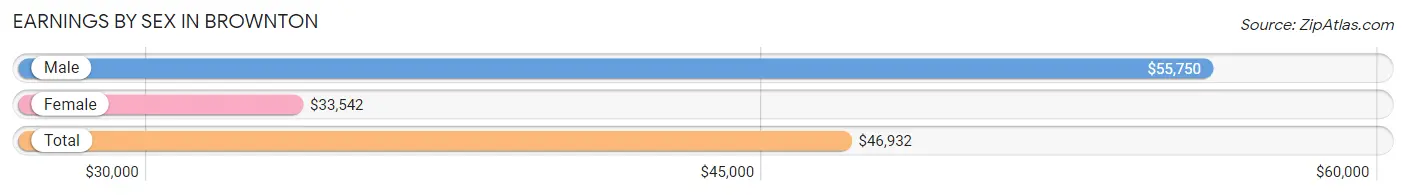
Earnings by Sex in Brownton
Average Earnings in Brownton are $46,932, $55,750 for men and $33,542 for women, a difference of 39.8%.
| Sex | Number | Average Earnings |
| Male | 162 (54.2%) | $55,750 |
| Female | 137 (45.8%) | $33,542 |
| Total | 299 (100.0%) | $46,932 |
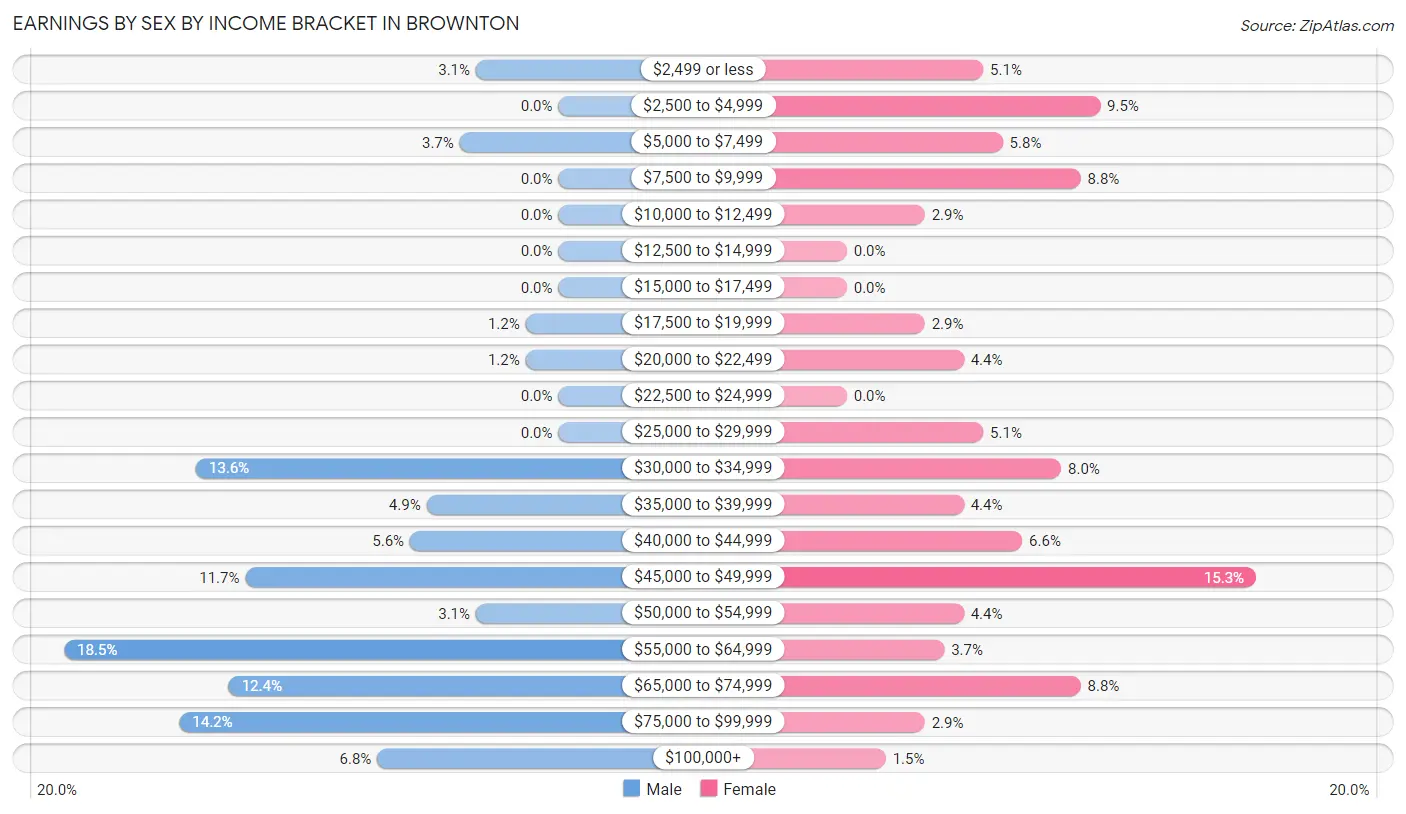
Earnings by Sex by Income Bracket in Brownton
The most common earnings brackets in Brownton are $55,000 to $64,999 for men (30 | 18.5%) and $45,000 to $49,999 for women (21 | 15.3%).
| Income | Male | Female |
| $2,499 or less | 5 (3.1%) | 7 (5.1%) |
| $2,500 to $4,999 | 0 (0.0%) | 13 (9.5%) |
| $5,000 to $7,499 | 6 (3.7%) | 8 (5.8%) |
| $7,500 to $9,999 | 0 (0.0%) | 12 (8.8%) |
| $10,000 to $12,499 | 0 (0.0%) | 4 (2.9%) |
| $12,500 to $14,999 | 0 (0.0%) | 0 (0.0%) |
| $15,000 to $17,499 | 0 (0.0%) | 0 (0.0%) |
| $17,500 to $19,999 | 2 (1.2%) | 4 (2.9%) |
| $20,000 to $22,499 | 2 (1.2%) | 6 (4.4%) |
| $22,500 to $24,999 | 0 (0.0%) | 0 (0.0%) |
| $25,000 to $29,999 | 0 (0.0%) | 7 (5.1%) |
| $30,000 to $34,999 | 22 (13.6%) | 11 (8.0%) |
| $35,000 to $39,999 | 8 (4.9%) | 6 (4.4%) |
| $40,000 to $44,999 | 9 (5.6%) | 9 (6.6%) |
| $45,000 to $49,999 | 19 (11.7%) | 21 (15.3%) |
| $50,000 to $54,999 | 5 (3.1%) | 6 (4.4%) |
| $55,000 to $64,999 | 30 (18.5%) | 5 (3.6%) |
| $65,000 to $74,999 | 20 (12.3%) | 12 (8.8%) |
| $75,000 to $99,999 | 23 (14.2%) | 4 (2.9%) |
| $100,000+ | 11 (6.8%) | 2 (1.5%) |
| Total | 162 (100.0%) | 137 (100.0%) |
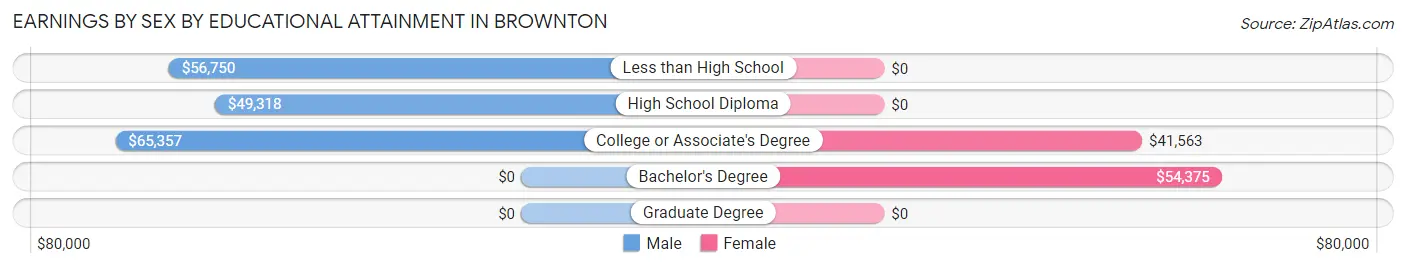
Earnings by Sex by Educational Attainment in Brownton
Average earnings in Brownton are $55,750 for men and $38,750 for women, a difference of 30.5%. Men with an educational attainment of college or associate's degree enjoy the highest average annual earnings of $65,357, while those with high school diploma education earn the least with $49,318. Women with an educational attainment of bachelor's degree earn the most with the average annual earnings of $54,375, while those with college or associate's degree education have the smallest earnings of $41,563.
| Educational Attainment | Male Income | Female Income |
| Less than High School | $56,750 | $0 |
| High School Diploma | $49,318 | $0 |
| College or Associate's Degree | $65,357 | $41,563 |
| Bachelor's Degree | - | - |
| Graduate Degree | - | - |
| Total | $55,750 | $38,750 |
Family Income in Brownton
Family Income Brackets in Brownton
According to the Brownton family income data, there are 60 families falling into the $100,000 to $149,999 income range, which is the most common income bracket and makes up 35.5% of all families.
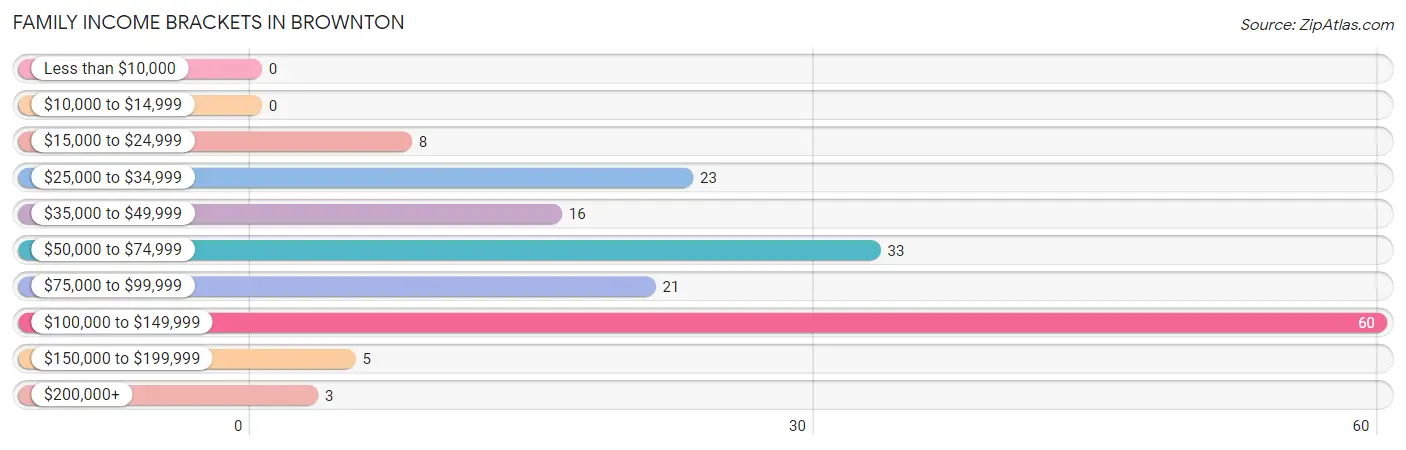
| Income Bracket | # Families | % Families |
| Less than $10,000 | 0 | 0.0% |
| $10,000 to $14,999 | 0 | 0.0% |
| $15,000 to $24,999 | 8 | 4.7% |
| $25,000 to $34,999 | 23 | 13.6% |
| $35,000 to $49,999 | 16 | 9.5% |
| $50,000 to $74,999 | 33 | 19.5% |
| $75,000 to $99,999 | 21 | 12.4% |
| $100,000 to $149,999 | 60 | 35.5% |
| $150,000 to $199,999 | 5 | 3.0% |
| $200,000+ | 3 | 1.8% |
Family Income by Famaliy Size in Brownton
4-person families (13 | 7.7%) account for the highest median family income in Brownton with $127,031 per family, while 2-person families (96 | 56.8%) have the highest median income of $32,292 per family member.
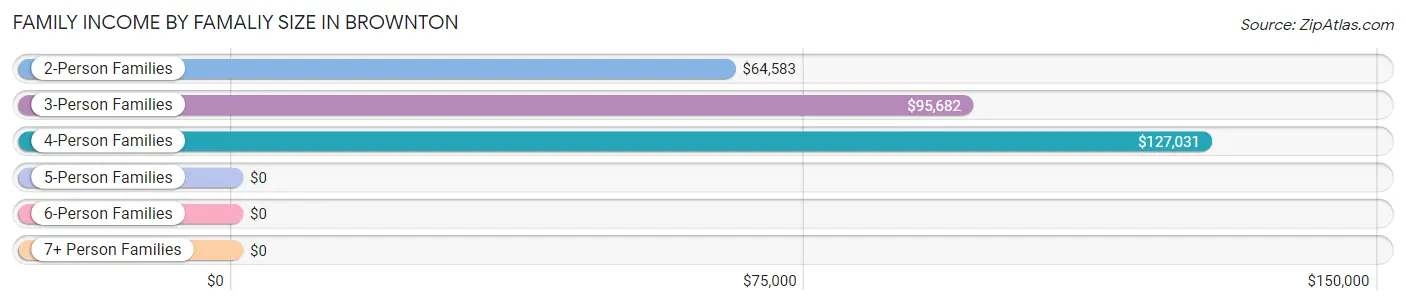
| Income Bracket | # Families | Median Income |
| 2-Person Families | 96 (56.8%) | $64,583 |
| 3-Person Families | 54 (32.0%) | $95,682 |
| 4-Person Families | 13 (7.7%) | $127,031 |
| 5-Person Families | 6 (3.5%) | $0 |
| 6-Person Families | 0 (0.0%) | $0 |
| 7+ Person Families | 0 (0.0%) | $0 |
| Total | 169 (100.0%) | $76,250 |
Family Income by Number of Earners in Brownton
The median family income in Brownton is $76,250, with families comprising 3+ earners (16) having the highest median family income of $128,125, while families with no earners (28) have the lowest median family income of $31,875, accounting for 9.5% and 16.6% of families, respectively.
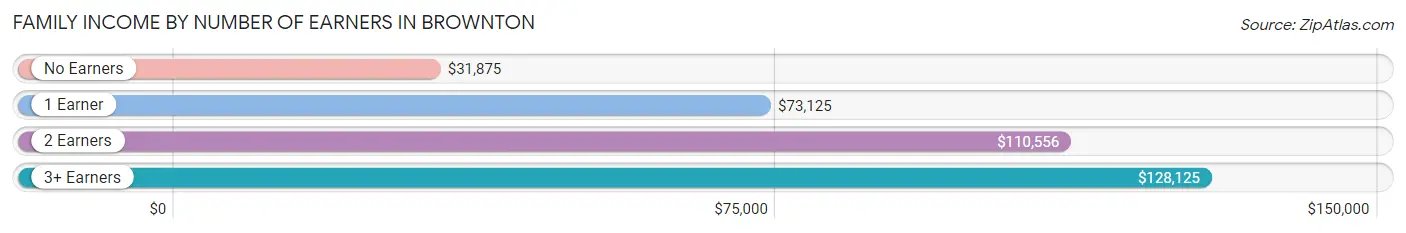
| Number of Earners | # Families | Median Income |
| No Earners | 28 (16.6%) | $31,875 |
| 1 Earner | 55 (32.5%) | $73,125 |
| 2 Earners | 70 (41.4%) | $110,556 |
| 3+ Earners | 16 (9.5%) | $128,125 |
| Total | 169 (100.0%) | $76,250 |
Household Income in Brownton
Household Income Brackets in Brownton
With 66 households falling in the category, the $100,000 to $149,999 income range is the most frequent in Brownton, accounting for 27.6% of all households. In contrast, only 3 households (1.3%) fall into the $200,000+ income bracket, making it the least populous group.
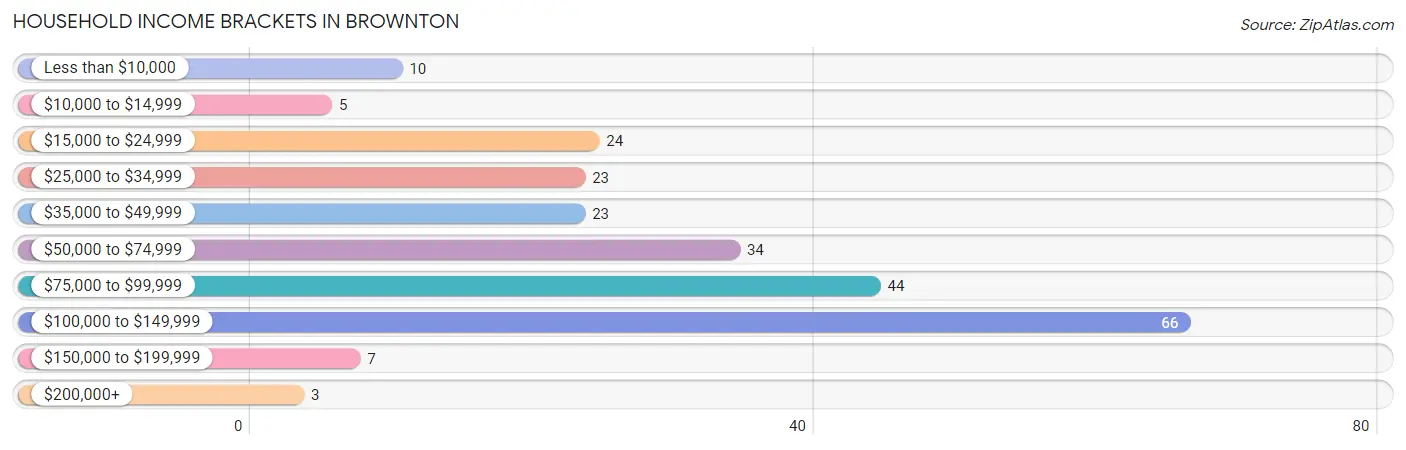
| Income Bracket | # Households | % Households |
| Less than $10,000 | 10 | 4.2% |
| $10,000 to $14,999 | 5 | 2.1% |
| $15,000 to $24,999 | 24 | 10.0% |
| $25,000 to $34,999 | 23 | 9.6% |
| $35,000 to $49,999 | 23 | 9.6% |
| $50,000 to $74,999 | 34 | 14.2% |
| $75,000 to $99,999 | 44 | 18.4% |
| $100,000 to $149,999 | 66 | 27.6% |
| $150,000 to $199,999 | 7 | 2.9% |
| $200,000+ | 3 | 1.3% |
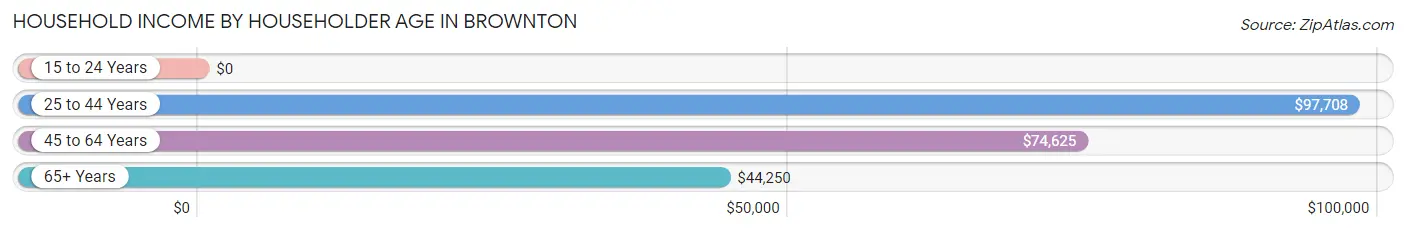
Household Income by Householder Age in Brownton
The median household income in Brownton is $75,139, with the highest median household income of $97,708 found in the 25 to 44 years age bracket for the primary householder. A total of 71 households (29.7%) fall into this category.
| Income Bracket | # Households | Median Income |
| 15 to 24 Years | 0 (0.0%) | $0 |
| 25 to 44 Years | 71 (29.7%) | $97,708 |
| 45 to 64 Years | 97 (40.6%) | $74,625 |
| 65+ Years | 71 (29.7%) | $44,250 |
| Total | 239 (100.0%) | $75,139 |
Poverty in Brownton
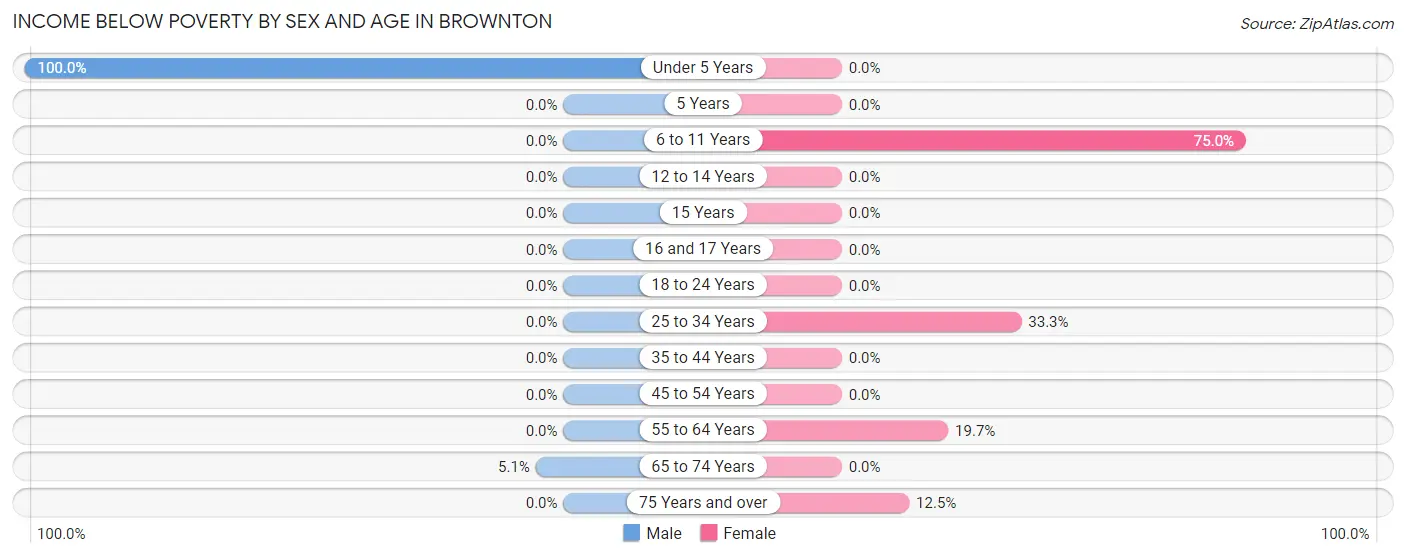
Income Below Poverty by Sex and Age in Brownton
With 3.5% poverty level for males and 11.9% for females among the residents of Brownton, under 5 year old males and 6 to 11 year old females are the most vulnerable to poverty, with 7 males (100.0%) and 9 females (75.0%) in their respective age groups living below the poverty level.
| Age Bracket | Male | Female |
| Under 5 Years | 7 (100.0%) | 0 (0.0%) |
| 5 Years | 0 (0.0%) | 0 (0.0%) |
| 6 to 11 Years | 0 (0.0%) | 9 (75.0%) |
| 12 to 14 Years | 0 (0.0%) | 0 (0.0%) |
| 15 Years | 0 (0.0%) | 0 (0.0%) |
| 16 and 17 Years | 0 (0.0%) | 0 (0.0%) |
| 18 to 24 Years | 0 (0.0%) | 0 (0.0%) |
| 25 to 34 Years | 0 (0.0%) | 6 (33.3%) |
| 35 to 44 Years | 0 (0.0%) | 0 (0.0%) |
| 45 to 54 Years | 0 (0.0%) | 0 (0.0%) |
| 55 to 64 Years | 0 (0.0%) | 15 (19.7%) |
| 65 to 74 Years | 2 (5.1%) | 0 (0.0%) |
| 75 Years and over | 0 (0.0%) | 4 (12.5%) |
| Total | 9 (3.5%) | 34 (11.9%) |
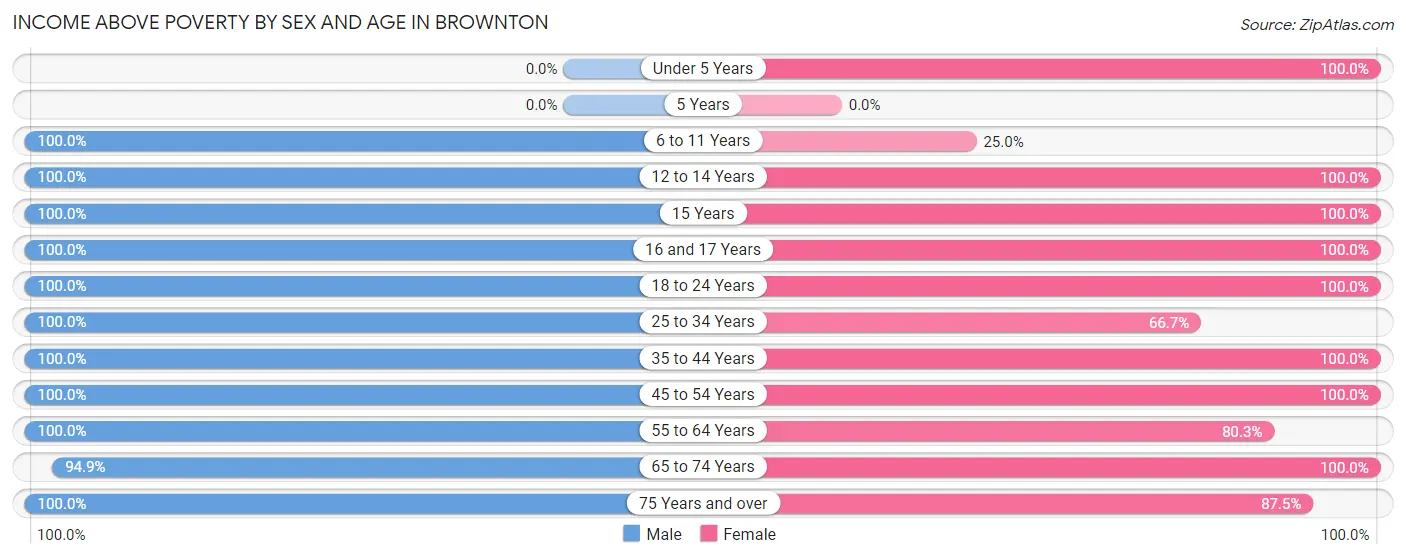
Income Above Poverty by Sex and Age in Brownton
According to the poverty statistics in Brownton, males aged 6 to 11 years and females aged under 5 years are the age groups that are most secure financially, with 100.0% of males and 100.0% of females in these age groups living above the poverty line.
| Age Bracket | Male | Female |
| Under 5 Years | 0 (0.0%) | 7 (100.0%) |
| 5 Years | 0 (0.0%) | 0 (0.0%) |
| 6 to 11 Years | 15 (100.0%) | 3 (25.0%) |
| 12 to 14 Years | 5 (100.0%) | 12 (100.0%) |
| 15 Years | 7 (100.0%) | 9 (100.0%) |
| 16 and 17 Years | 2 (100.0%) | 24 (100.0%) |
| 18 to 24 Years | 2 (100.0%) | 12 (100.0%) |
| 25 to 34 Years | 45 (100.0%) | 12 (66.7%) |
| 35 to 44 Years | 45 (100.0%) | 35 (100.0%) |
| 45 to 54 Years | 32 (100.0%) | 24 (100.0%) |
| 55 to 64 Years | 48 (100.0%) | 61 (80.3%) |
| 65 to 74 Years | 37 (94.9%) | 24 (100.0%) |
| 75 Years and over | 11 (100.0%) | 28 (87.5%) |
| Total | 249 (96.5%) | 251 (88.1%) |
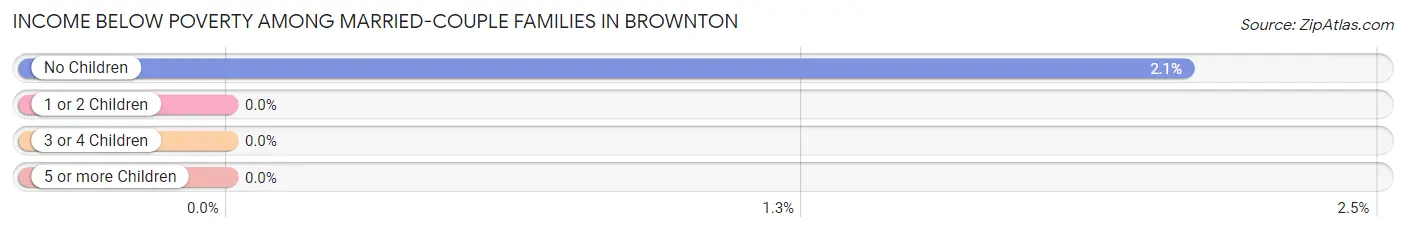
Income Below Poverty Among Married-Couple Families in Brownton
The poverty statistics for married-couple families in Brownton show that 1.5% or 2 of the total 134 families live below the poverty line. Families with no children have the highest poverty rate of 2.1%, comprising of 2 families. On the other hand, families with 1 or 2 children have the lowest poverty rate of 0.0%, which includes 0 families.
| Children | Above Poverty | Below Poverty |
| No Children | 94 (97.9%) | 2 (2.1%) |
| 1 or 2 Children | 32 (100.0%) | 0 (0.0%) |
| 3 or 4 Children | 6 (100.0%) | 0 (0.0%) |
| 5 or more Children | 0 (0.0%) | 0 (0.0%) |
| Total | 132 (98.5%) | 2 (1.5%) |
Income Below Poverty Among Single-Parent Households in Brownton
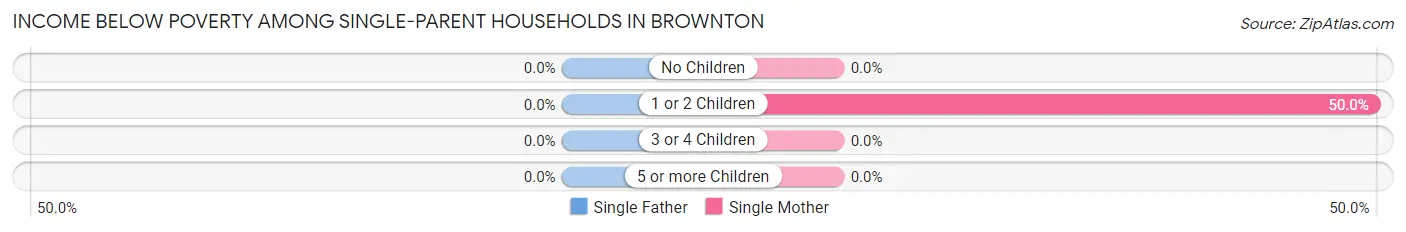
| Children | Single Father | Single Mother |
| No Children | 0 (0.0%) | 0 (0.0%) |
| 1 or 2 Children | 0 (0.0%) | 6 (50.0%) |
| 3 or 4 Children | 0 (0.0%) | 0 (0.0%) |
| 5 or more Children | 0 (0.0%) | 0 (0.0%) |
| Total | 0 (0.0%) | 6 (33.3%) |
Income Below Poverty Among Married-Couple vs Single-Parent Households in Brownton
The poverty data for Brownton shows that 2 of the married-couple family households (1.5%) and 6 of the single-parent households (17.1%) are living below the poverty level. Within the married-couple family households, those with no children have the highest poverty rate, with 2 households (2.1%) falling below the poverty line. Among the single-parent households, those with 1 or 2 children have the highest poverty rate, with 6 household (31.6%) living below poverty.
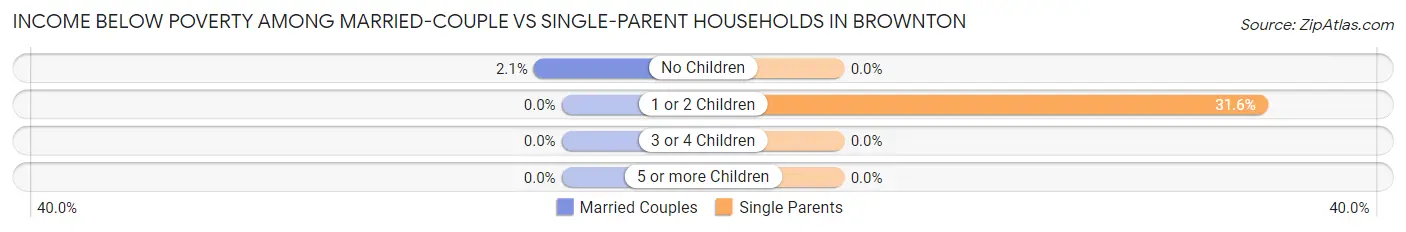
| Children | Married-Couple Families | Single-Parent Households |
| No Children | 2 (2.1%) | 0 (0.0%) |
| 1 or 2 Children | 0 (0.0%) | 6 (31.6%) |
| 3 or 4 Children | 0 (0.0%) | 0 (0.0%) |
| 5 or more Children | 0 (0.0%) | 0 (0.0%) |
| Total | 2 (1.5%) | 6 (17.1%) |
Race in Brownton
The most populous races in Brownton are White / Caucasian (539 | 99.1%), and Two or more Races (5 | 0.9%).
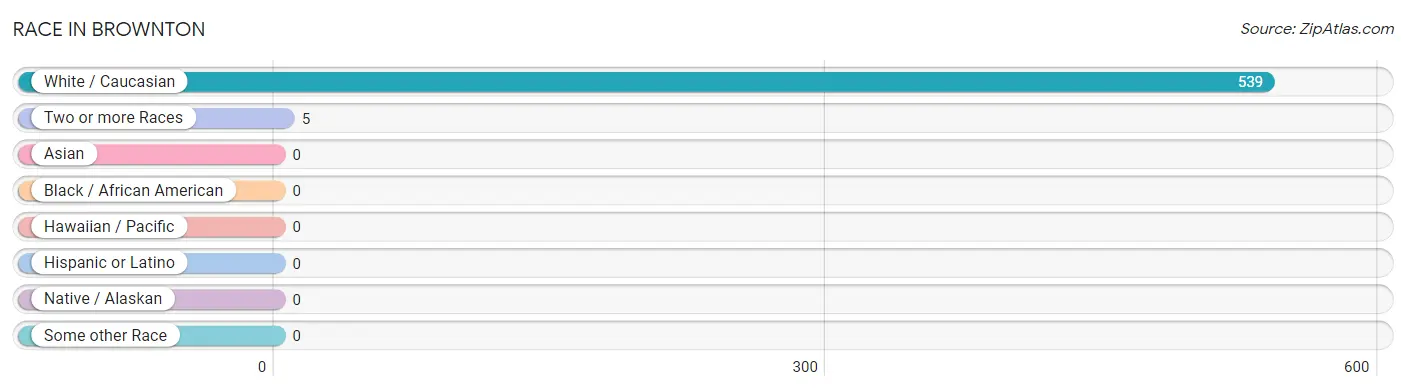
| Race | # Population | % Population |
| Asian | 0 | 0.0% |
| Black / African American | 0 | 0.0% |
| Hawaiian / Pacific | 0 | 0.0% |
| Hispanic or Latino | 0 | 0.0% |
| Native / Alaskan | 0 | 0.0% |
| White / Caucasian | 539 | 99.1% |
| Two or more Races | 5 | 0.9% |
| Some other Race | 0 | 0.0% |
| Total | 544 | 100.0% |
Ancestry in Brownton
The most populous ancestries reported in Brownton are German (362 | 66.5%), Norwegian (95 | 17.5%), Irish (70 | 12.9%), Swedish (46 | 8.5%), and English (31 | 5.7%), together accounting for 111.0% of all Brownton residents.
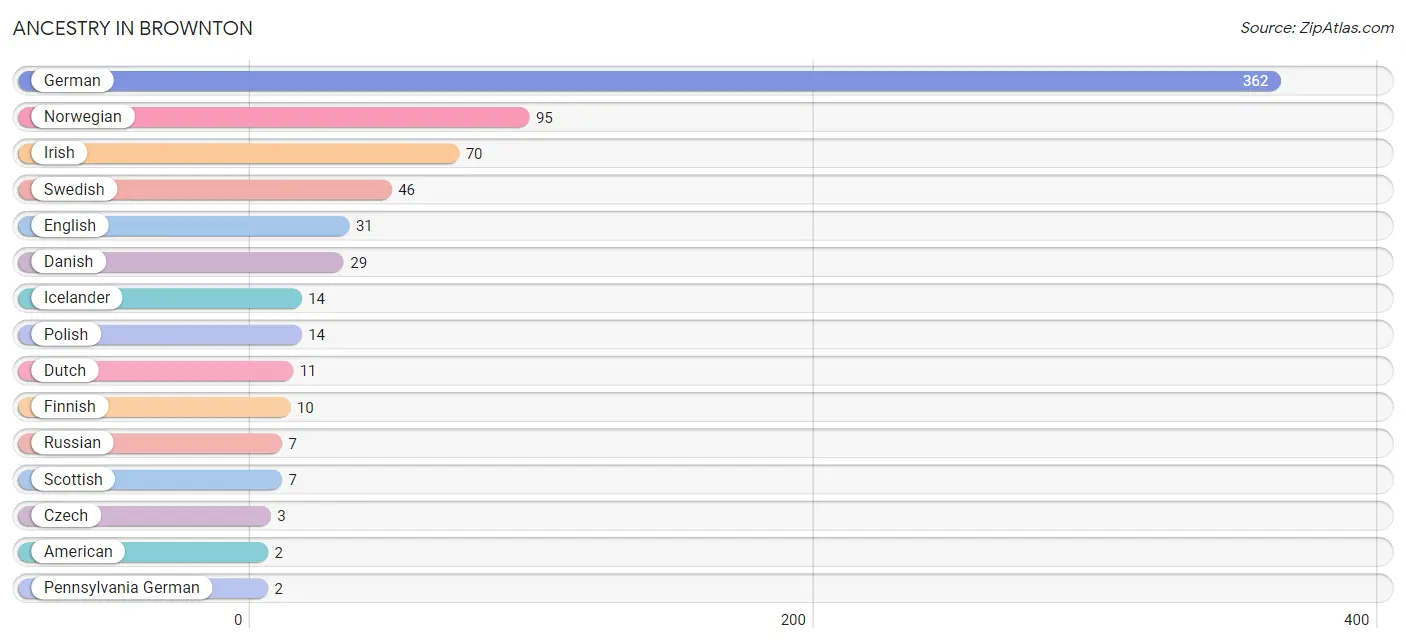
| Ancestry | # Population | % Population |
| American | 2 | 0.4% |
| Czech | 3 | 0.5% |
| Danish | 29 | 5.3% |
| Dutch | 11 | 2.0% |
| English | 31 | 5.7% |
| Finnish | 10 | 1.8% |
| German | 362 | 66.5% |
| Icelander | 14 | 2.6% |
| Irish | 70 | 12.9% |
| Norwegian | 95 | 17.5% |
| Pennsylvania German | 2 | 0.4% |
| Polish | 14 | 2.6% |
| Romanian | 1 | 0.2% |
| Russian | 7 | 1.3% |
| Scottish | 7 | 1.3% |
| Swedish | 46 | 8.5% | View All 16 Rows |
Immigrants in Brownton
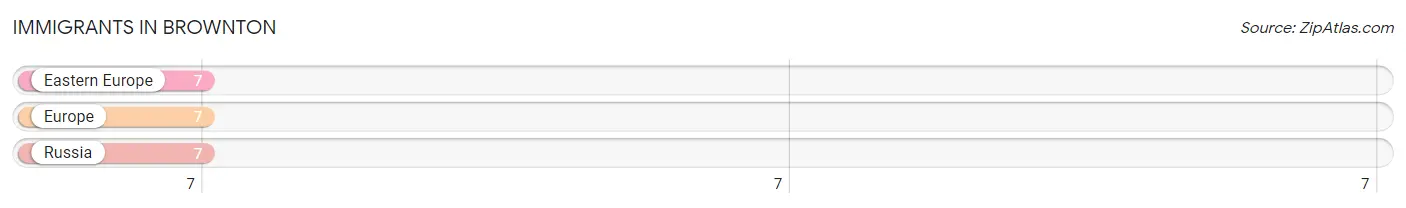
The most numerous immigrant groups reported in Brownton came from Eastern Europe (7 | 1.3%), Europe (7 | 1.3%), and Russia (7 | 1.3%), together accounting for 3.9% of all Brownton residents.
| Immigration Origin | # Population | % Population |
| Eastern Europe | 7 | 1.3% |
| Europe | 7 | 1.3% |
| Russia | 7 | 1.3% | View All 3 Rows |
Sex and Age in Brownton
Sex and Age in Brownton
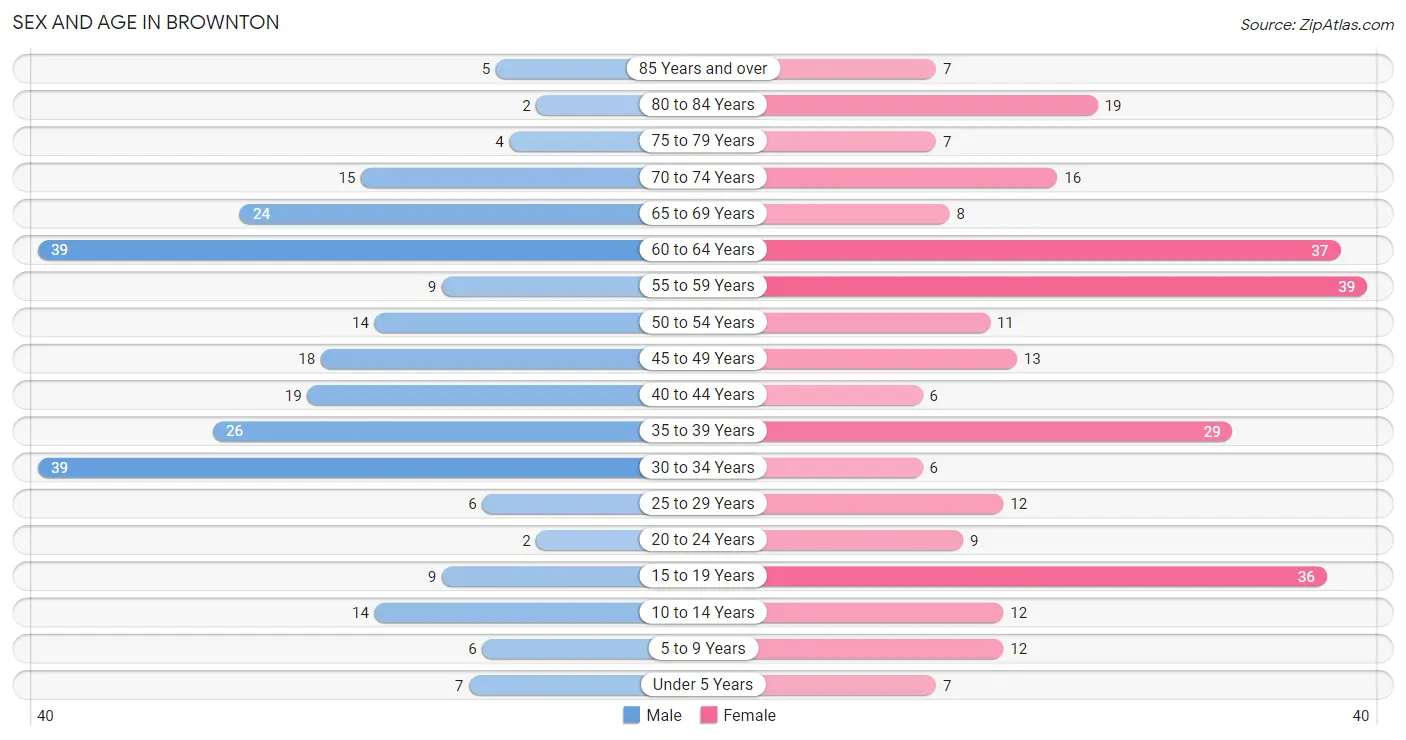
The most populous age groups in Brownton are 30 to 34 Years (39 | 15.1%) for men and 55 to 59 Years (39 | 13.6%) for women.
| Age Bracket | Male | Female |
| Under 5 Years | 7 (2.7%) | 7 (2.5%) |
| 5 to 9 Years | 6 (2.3%) | 12 (4.2%) |
| 10 to 14 Years | 14 (5.4%) | 12 (4.2%) |
| 15 to 19 Years | 9 (3.5%) | 36 (12.6%) |
| 20 to 24 Years | 2 (0.8%) | 9 (3.2%) |
| 25 to 29 Years | 6 (2.3%) | 12 (4.2%) |
| 30 to 34 Years | 39 (15.1%) | 6 (2.1%) |
| 35 to 39 Years | 26 (10.1%) | 29 (10.1%) |
| 40 to 44 Years | 19 (7.4%) | 6 (2.1%) |
| 45 to 49 Years | 18 (7.0%) | 13 (4.5%) |
| 50 to 54 Years | 14 (5.4%) | 11 (3.8%) |
| 55 to 59 Years | 9 (3.5%) | 39 (13.6%) |
| 60 to 64 Years | 39 (15.1%) | 37 (12.9%) |
| 65 to 69 Years | 24 (9.3%) | 8 (2.8%) |
| 70 to 74 Years | 15 (5.8%) | 16 (5.6%) |
| 75 to 79 Years | 4 (1.5%) | 7 (2.5%) |
| 80 to 84 Years | 2 (0.8%) | 19 (6.6%) |
| 85 Years and over | 5 (1.9%) | 7 (2.5%) |
| Total | 258 (100.0%) | 286 (100.0%) |
Families and Households in Brownton
Median Family Size in Brownton
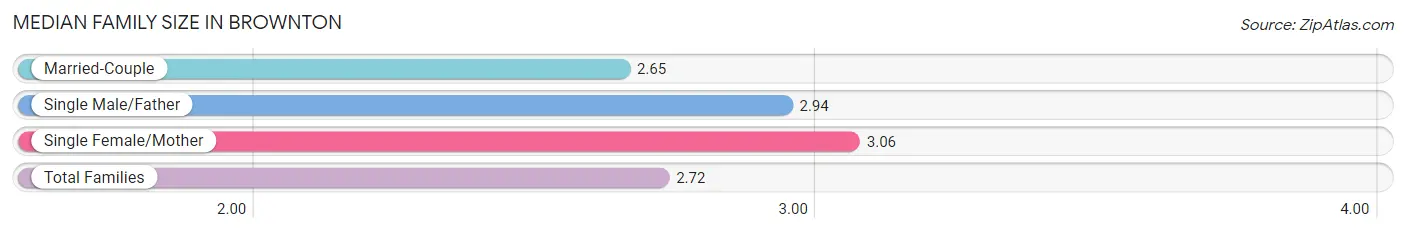
The median family size in Brownton is 2.72 persons per family, with single female/mother families (18 | 10.6%) accounting for the largest median family size of 3.06 persons per family. On the other hand, married-couple families (134 | 79.3%) represent the smallest median family size with 2.65 persons per family.
| Family Type | # Families | Family Size |
| Married-Couple | 134 (79.3%) | 2.65 |
| Single Male/Father | 17 (10.1%) | 2.94 |
| Single Female/Mother | 18 (10.6%) | 3.06 |
| Total Families | 169 (100.0%) | 2.72 |
Median Household Size in Brownton
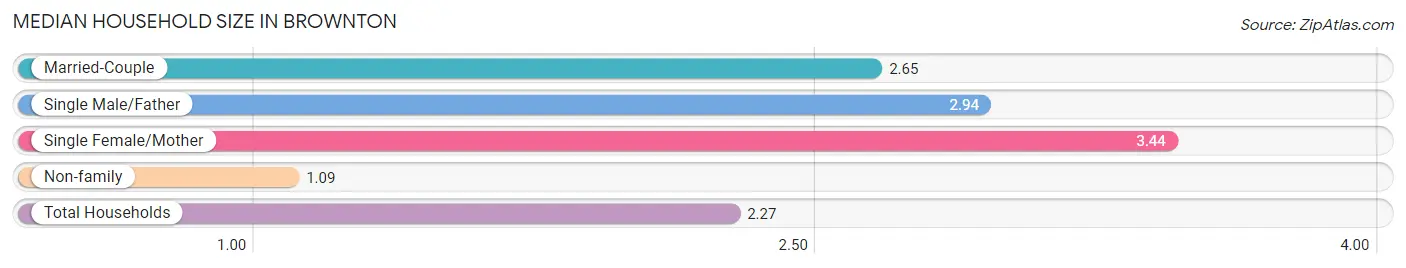
The median household size in Brownton is 2.27 persons per household, with single female/mother households (18 | 7.5%) accounting for the largest median household size of 3.44 persons per household. non-family households (70 | 29.3%) represent the smallest median household size with 1.09 persons per household.
| Household Type | # Households | Household Size |
| Married-Couple | 134 (56.1%) | 2.65 |
| Single Male/Father | 17 (7.1%) | 2.94 |
| Single Female/Mother | 18 (7.5%) | 3.44 |
| Non-family | 70 (29.3%) | 1.09 |
| Total Households | 239 (100.0%) | 2.27 |
Household Size by Marriage Status in Brownton
Out of a total of 239 households in Brownton, 169 (70.7%) are family households, while 70 (29.3%) are nonfamily households. The most numerous type of family households are 2-person households, comprising 96, and the most common type of nonfamily households are 1-person households, comprising 64.
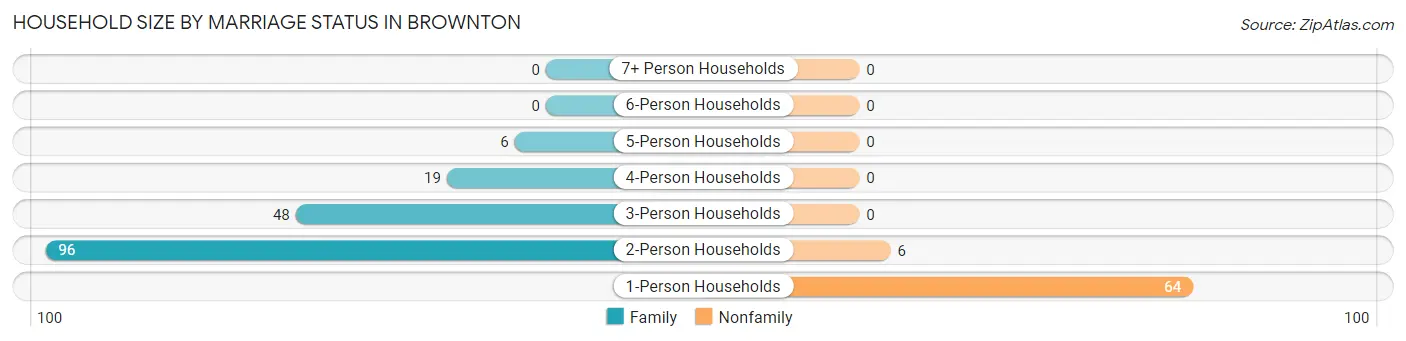
| Household Size | Family Households | Nonfamily Households |
| 1-Person Households | - | 64 (26.8%) |
| 2-Person Households | 96 (40.2%) | 6 (2.5%) |
| 3-Person Households | 48 (20.1%) | 0 (0.0%) |
| 4-Person Households | 19 (8.0%) | 0 (0.0%) |
| 5-Person Households | 6 (2.5%) | 0 (0.0%) |
| 6-Person Households | 0 (0.0%) | 0 (0.0%) |
| 7+ Person Households | 0 (0.0%) | 0 (0.0%) |
| Total | 169 (70.7%) | 70 (29.3%) |
Female Fertility in Brownton
Fertility by Age in Brownton
| Age Bracket | Women with Births | Births / 1,000 Women |
| 15 to 19 years | 0 (0.0%) | 0.0 |
| 20 to 34 years | 0 (0.0%) | 0.0 |
| 35 to 50 years | 0 (0.0%) | 0.0 |
| Total | 0 (0.0%) | 0.0 |
Fertility by Age by Marriage Status in Brownton
| Age Bracket | Married | Unmarried |
| 15 to 19 years | 0 (0.0%) | 0 (0.0%) |
| 20 to 34 years | 0 (0.0%) | 0 (0.0%) |
| 35 to 50 years | 0 (0.0%) | 0 (0.0%) |
| Total | 0 (0.0%) | 0 (0.0%) |
Fertility by Education in Brownton
| Educational Attainment | Women with Births | Births / 1,000 Women |
| Less than High School | 0 (0.0%) | 0.0 |
| High School Diploma | 0 (0.0%) | 0.0 |
| College or Associate's Degree | 0 (0.0%) | 0.0 |
| Bachelor's Degree | 0 (0.0%) | 0.0 |
| Graduate Degree | 0 (0.0%) | 0.0 |
| Total | 0 (0.0%) | 0.0 |
Fertility by Education by Marriage Status in Brownton
| Educational Attainment | Married | Unmarried |
| Less than High School | 0 (0.0%) | 0 (0.0%) |
| High School Diploma | 0 (0.0%) | 0 (0.0%) |
| College or Associate's Degree | 0 (0.0%) | 0 (0.0%) |
| Bachelor's Degree | 0 (0.0%) | 0 (0.0%) |
| Graduate Degree | 0 (0.0%) | 0 (0.0%) |
| Total | 0 (0.0%) | 0 (0.0%) |
Employment Characteristics in Brownton
Employment by Class of Employer in Brownton
Among the 273 employed individuals in Brownton, private company employees (196 | 71.8%), state government employees (24 | 8.8%), and local government employees (23 | 8.4%) make up the most common classes of employment.
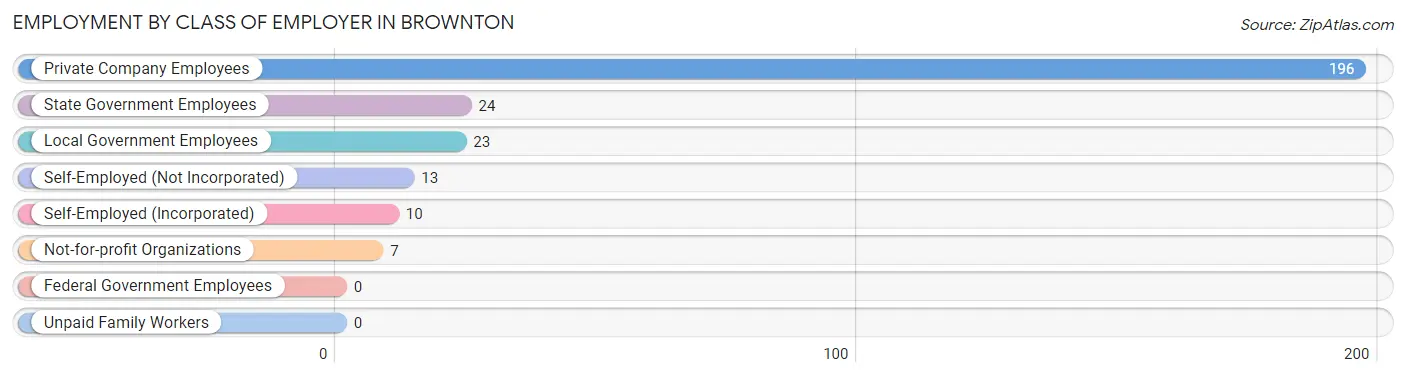
| Employer Class | # Employees | % Employees |
| Private Company Employees | 196 | 71.8% |
| Self-Employed (Incorporated) | 10 | 3.7% |
| Self-Employed (Not Incorporated) | 13 | 4.8% |
| Not-for-profit Organizations | 7 | 2.6% |
| Local Government Employees | 23 | 8.4% |
| State Government Employees | 24 | 8.8% |
| Federal Government Employees | 0 | 0.0% |
| Unpaid Family Workers | 0 | 0.0% |
| Total | 273 | 100.0% |
Employment Status by Age in Brownton
According to the labor force statistics for Brownton, out of the total population over 16 years of age (470), 60.9% or 286 individuals are in the labor force, with 4.5% or 13 of them unemployed. The age group with the highest labor force participation rate is 25 to 29 years, with 100.0% or 18 individuals in the labor force. Within the labor force, the 55 to 59 years age range has the highest percentage of unemployed individuals, with 17.6% or 6 of them being unemployed.
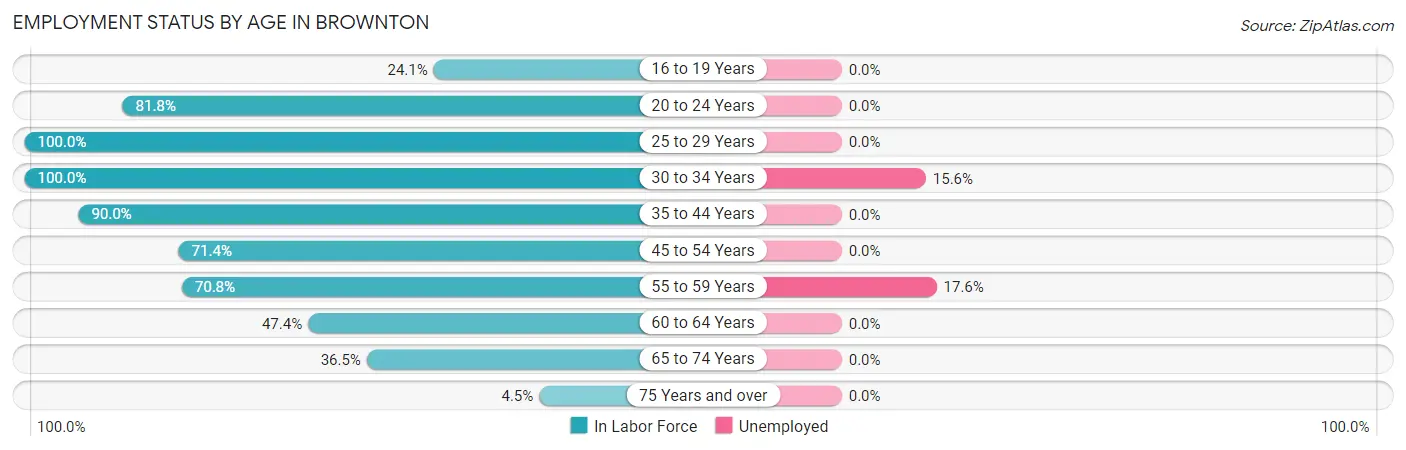
| Age Bracket | In Labor Force | Unemployed |
| 16 to 19 Years | 7 (24.1%) | 0 (0.0%) |
| 20 to 24 Years | 9 (81.8%) | 0 (0.0%) |
| 25 to 29 Years | 18 (100.0%) | 0 (0.0%) |
| 30 to 34 Years | 45 (100.0%) | 7 (15.6%) |
| 35 to 44 Years | 72 (90.0%) | 0 (0.0%) |
| 45 to 54 Years | 40 (71.4%) | 0 (0.0%) |
| 55 to 59 Years | 34 (70.8%) | 6 (17.6%) |
| 60 to 64 Years | 36 (47.4%) | 0 (0.0%) |
| 65 to 74 Years | 23 (36.5%) | 0 (0.0%) |
| 75 Years and over | 2 (4.5%) | 0 (0.0%) |
| Total | 286 (60.9%) | 13 (4.5%) |
Employment Status by Educational Attainment in Brownton
According to labor force statistics for Brownton, 75.9% of individuals (245) out of the total population between 25 and 64 years of age (323) are in the labor force, with 5.3% or 13 of them being unemployed. The group with the highest labor force participation rate are those with the educational attainment of high school diploma, with 79.2% or 80 individuals in the labor force. Within the labor force, individuals with high school diploma education have the highest percentage of unemployment, with 7.5% or 6 of them being unemployed.
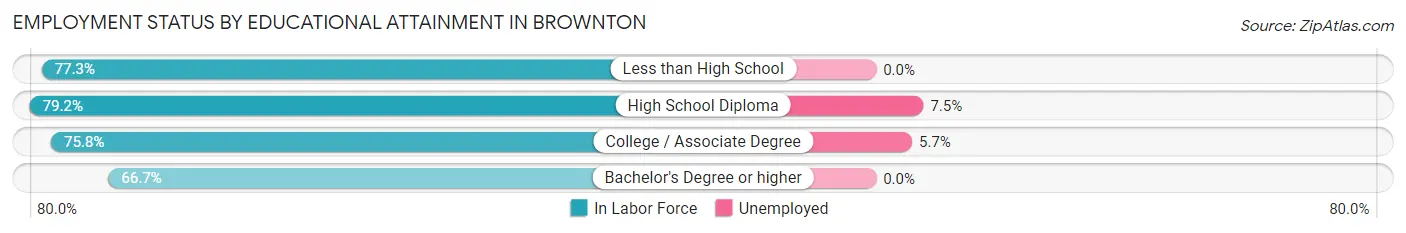
| Educational Attainment | In Labor Force | Unemployed |
| Less than High School | 17 (77.3%) | 0 (0.0%) |
| High School Diploma | 80 (79.2%) | 8 (7.5%) |
| College / Associate Degree | 122 (75.8%) | 9 (5.7%) |
| Bachelor's Degree or higher | 26 (66.7%) | 0 (0.0%) |
| Total | 245 (75.9%) | 17 (5.3%) |
Employment Occupations by Sex in Brownton
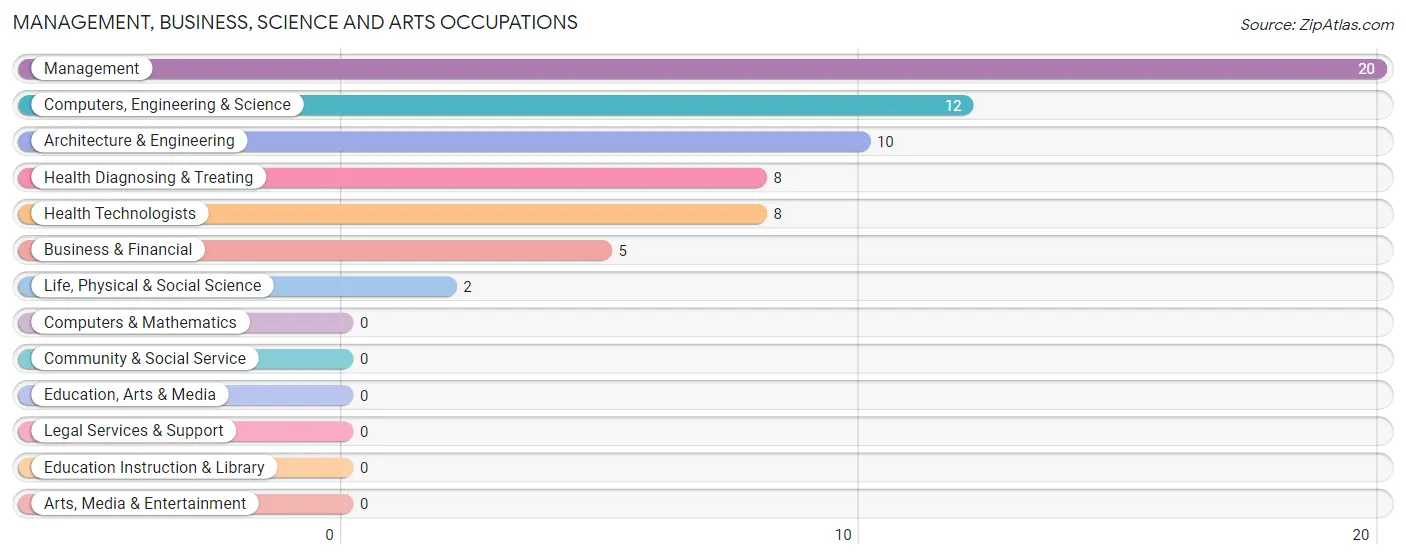
Management, Business, Science and Arts Occupations
The most common Management, Business, Science and Arts occupations in Brownton are Management (20 | 7.3%), Computers, Engineering & Science (12 | 4.4%), Architecture & Engineering (10 | 3.7%), Health Diagnosing & Treating (8 | 2.9%), and Health Technologists (8 | 2.9%).
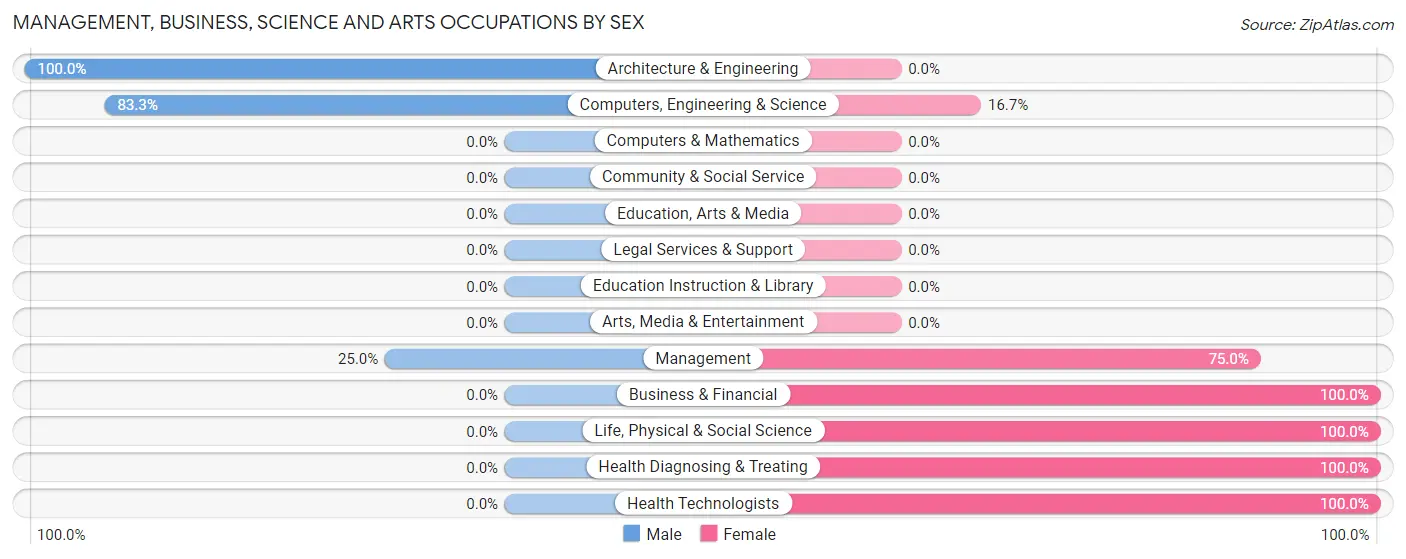
Management, Business, Science and Arts Occupations by Sex
Within the Management, Business, Science and Arts occupations in Brownton, the most male-oriented occupations are Architecture & Engineering (100.0%), Computers, Engineering & Science (83.3%), and Management (25.0%), while the most female-oriented occupations are Business & Financial (100.0%), Life, Physical & Social Science (100.0%), and Health Diagnosing & Treating (100.0%).
| Occupation | Male | Female |
| Management | 5 (25.0%) | 15 (75.0%) |
| Business & Financial | 0 (0.0%) | 5 (100.0%) |
| Computers, Engineering & Science | 10 (83.3%) | 2 (16.7%) |
| Computers & Mathematics | 0 (0.0%) | 0 (0.0%) |
| Architecture & Engineering | 10 (100.0%) | 0 (0.0%) |
| Life, Physical & Social Science | 0 (0.0%) | 2 (100.0%) |
| Community & Social Service | 0 (0.0%) | 0 (0.0%) |
| Education, Arts & Media | 0 (0.0%) | 0 (0.0%) |
| Legal Services & Support | 0 (0.0%) | 0 (0.0%) |
| Education Instruction & Library | 0 (0.0%) | 0 (0.0%) |
| Arts, Media & Entertainment | 0 (0.0%) | 0 (0.0%) |
| Health Diagnosing & Treating | 0 (0.0%) | 8 (100.0%) |
| Health Technologists | 0 (0.0%) | 8 (100.0%) |
| Total (Category) | 15 (33.3%) | 30 (66.7%) |
| Total (Overall) | 153 (56.0%) | 120 (44.0%) |
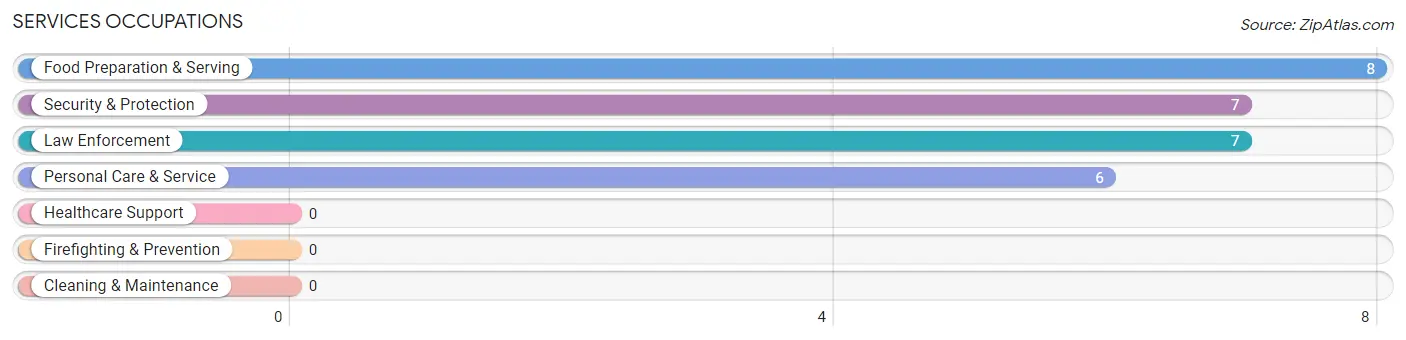
Services Occupations
The most common Services occupations in Brownton are Food Preparation & Serving (8 | 2.9%), Security & Protection (7 | 2.6%), Law Enforcement (7 | 2.6%), and Personal Care & Service (6 | 2.2%).
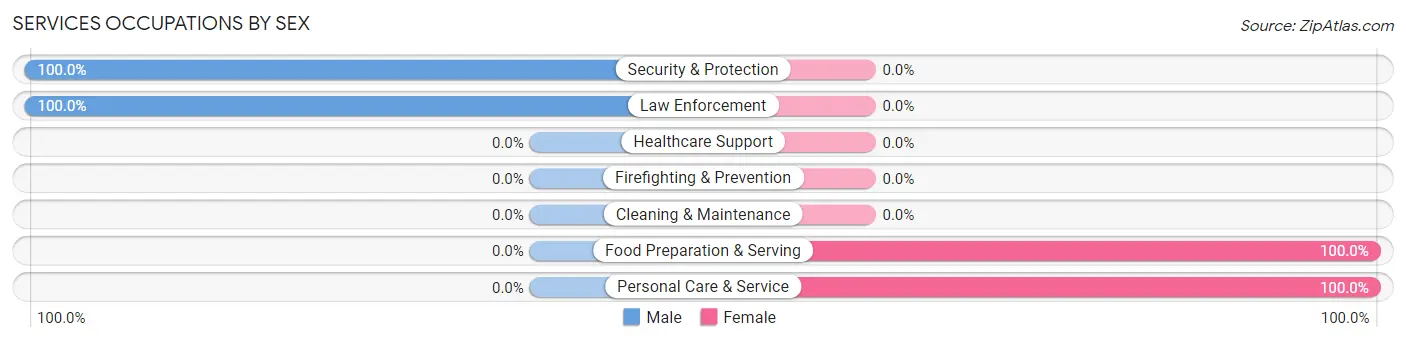
Services Occupations by Sex
Within the Services occupations in Brownton, the most male-oriented occupations are Security & Protection (100.0%), and Law Enforcement (100.0%), while the most female-oriented occupations are Food Preparation & Serving (100.0%), and Personal Care & Service (100.0%).
| Occupation | Male | Female |
| Healthcare Support | 0 (0.0%) | 0 (0.0%) |
| Security & Protection | 7 (100.0%) | 0 (0.0%) |
| Firefighting & Prevention | 0 (0.0%) | 0 (0.0%) |
| Law Enforcement | 7 (100.0%) | 0 (0.0%) |
| Food Preparation & Serving | 0 (0.0%) | 8 (100.0%) |
| Cleaning & Maintenance | 0 (0.0%) | 0 (0.0%) |
| Personal Care & Service | 0 (0.0%) | 6 (100.0%) |
| Total (Category) | 7 (33.3%) | 14 (66.7%) |
| Total (Overall) | 153 (56.0%) | 120 (44.0%) |
Sales and Office Occupations
The most common Sales and Office occupations in Brownton are Office & Administration (34 | 12.4%), and Sales & Related (29 | 10.6%).
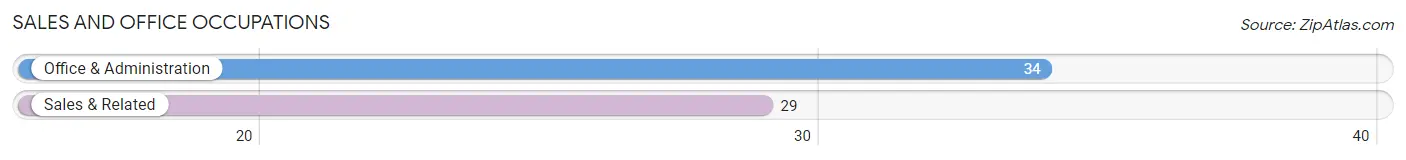
Sales and Office Occupations by Sex
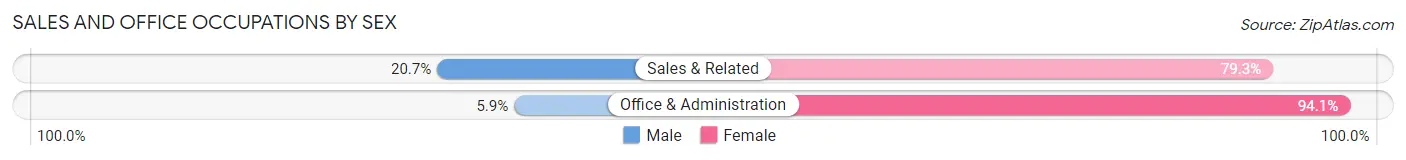
| Occupation | Male | Female |
| Sales & Related | 6 (20.7%) | 23 (79.3%) |
| Office & Administration | 2 (5.9%) | 32 (94.1%) |
| Total (Category) | 8 (12.7%) | 55 (87.3%) |
| Total (Overall) | 153 (56.0%) | 120 (44.0%) |
Natural Resources, Construction and Maintenance Occupations
The most common Natural Resources, Construction and Maintenance occupations in Brownton are Installation, Maintenance & Repair (29 | 10.6%), and Construction & Extraction (12 | 4.4%).
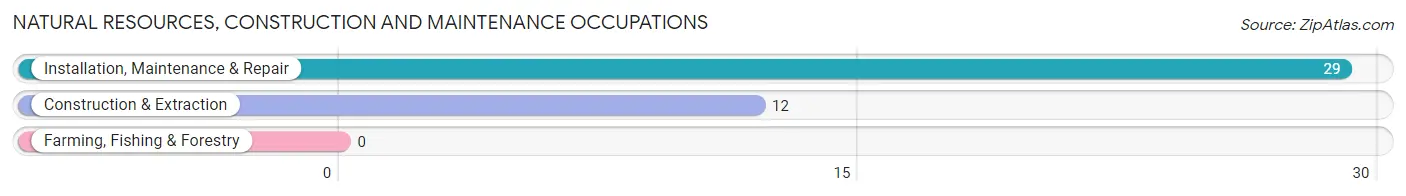
Natural Resources, Construction and Maintenance Occupations by Sex
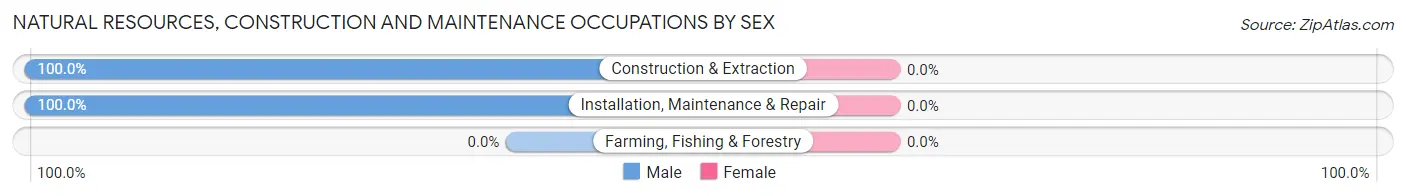
| Occupation | Male | Female |
| Farming, Fishing & Forestry | 0 (0.0%) | 0 (0.0%) |
| Construction & Extraction | 12 (100.0%) | 0 (0.0%) |
| Installation, Maintenance & Repair | 29 (100.0%) | 0 (0.0%) |
| Total (Category) | 41 (100.0%) | 0 (0.0%) |
| Total (Overall) | 153 (56.0%) | 120 (44.0%) |
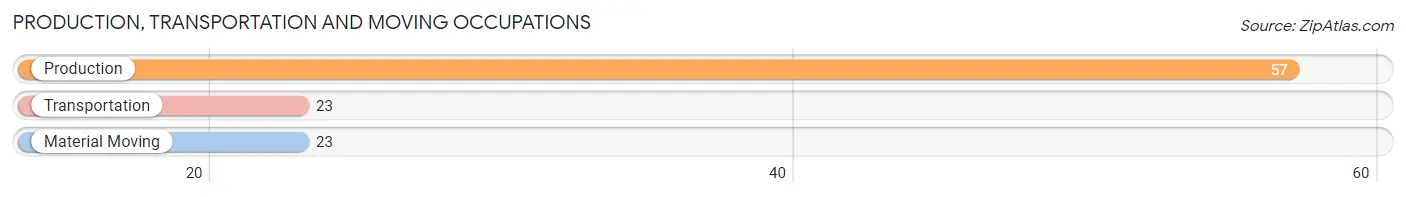
Production, Transportation and Moving Occupations
The most common Production, Transportation and Moving occupations in Brownton are Production (57 | 20.9%), Transportation (23 | 8.4%), and Material Moving (23 | 8.4%).
Production, Transportation and Moving Occupations by Sex
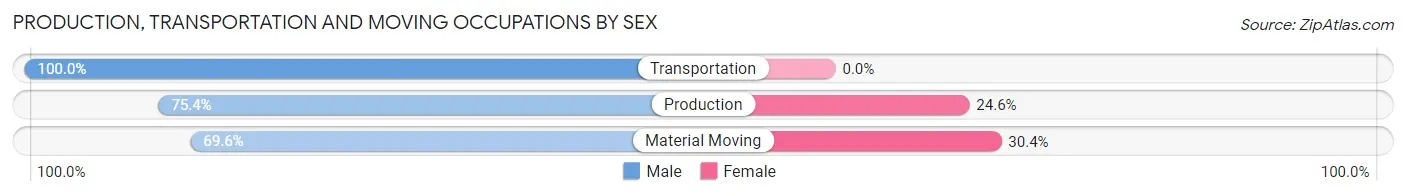
| Occupation | Male | Female |
| Production | 43 (75.4%) | 14 (24.6%) |
| Transportation | 23 (100.0%) | 0 (0.0%) |
| Material Moving | 16 (69.6%) | 7 (30.4%) |
| Total (Category) | 82 (79.6%) | 21 (20.4%) |
| Total (Overall) | 153 (56.0%) | 120 (44.0%) |
Employment Industries by Sex in Brownton
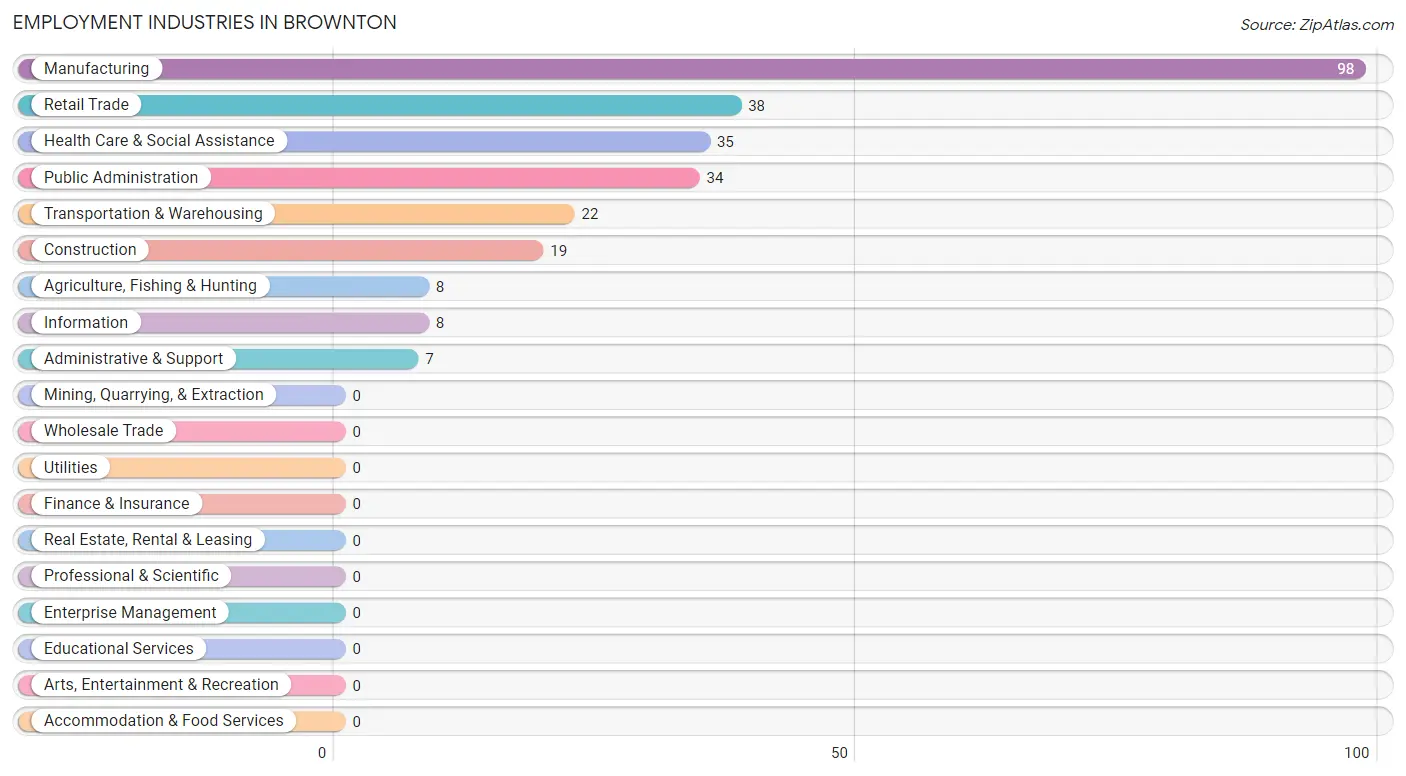
Employment Industries in Brownton
The major employment industries in Brownton include Manufacturing (98 | 35.9%), Retail Trade (38 | 13.9%), Health Care & Social Assistance (35 | 12.8%), Public Administration (34 | 12.4%), and Transportation & Warehousing (22 | 8.1%).
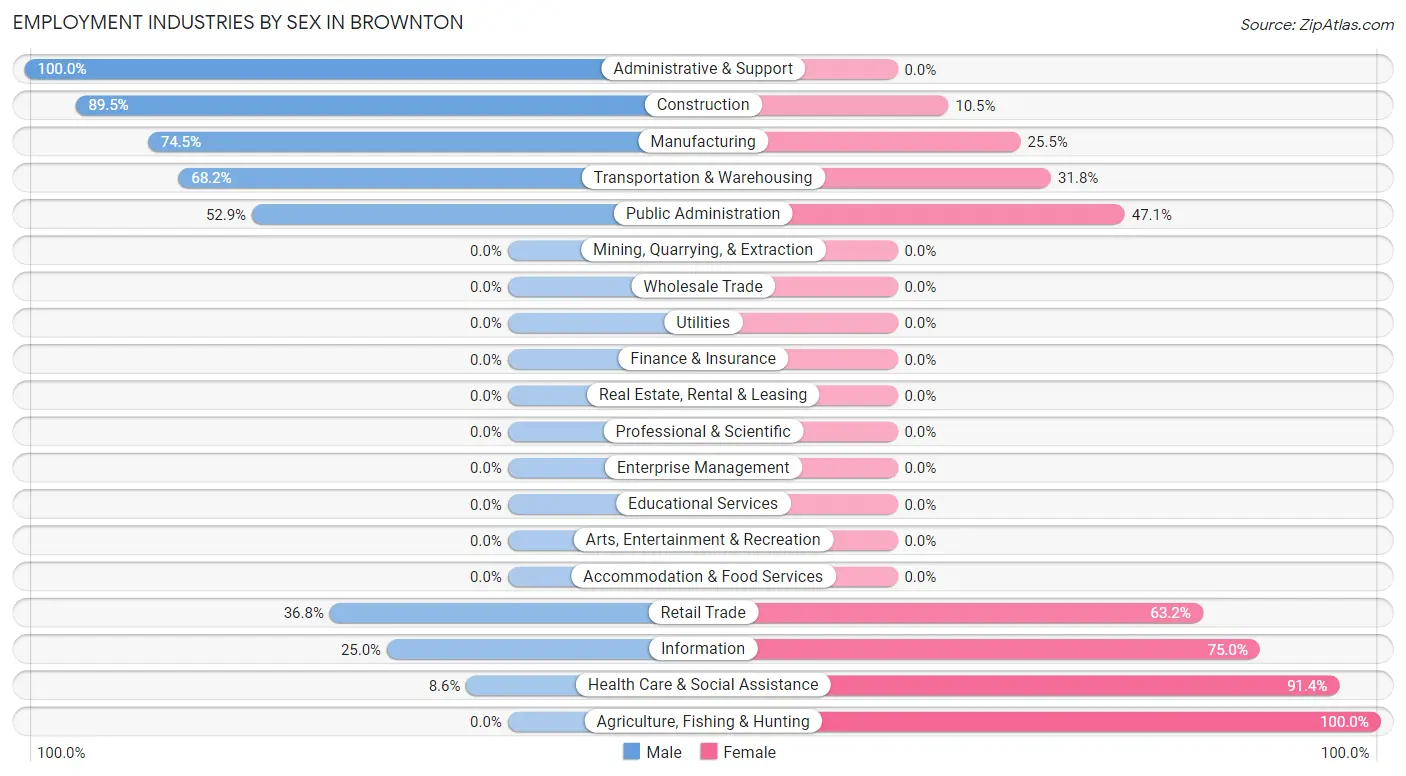
Employment Industries by Sex in Brownton
The Brownton industries that see more men than women are Administrative & Support (100.0%), Construction (89.5%), and Manufacturing (74.5%), whereas the industries that tend to have a higher number of women are Agriculture, Fishing & Hunting (100.0%), Health Care & Social Assistance (91.4%), and Information (75.0%).
| Industry | Male | Female |
| Agriculture, Fishing & Hunting | 0 (0.0%) | 8 (100.0%) |
| Mining, Quarrying, & Extraction | 0 (0.0%) | 0 (0.0%) |
| Construction | 17 (89.5%) | 2 (10.5%) |
| Manufacturing | 73 (74.5%) | 25 (25.5%) |
| Wholesale Trade | 0 (0.0%) | 0 (0.0%) |
| Retail Trade | 14 (36.8%) | 24 (63.2%) |
| Transportation & Warehousing | 15 (68.2%) | 7 (31.8%) |
| Utilities | 0 (0.0%) | 0 (0.0%) |
| Information | 2 (25.0%) | 6 (75.0%) |
| Finance & Insurance | 0 (0.0%) | 0 (0.0%) |
| Real Estate, Rental & Leasing | 0 (0.0%) | 0 (0.0%) |
| Professional & Scientific | 0 (0.0%) | 0 (0.0%) |
| Enterprise Management | 0 (0.0%) | 0 (0.0%) |
| Administrative & Support | 7 (100.0%) | 0 (0.0%) |
| Educational Services | 0 (0.0%) | 0 (0.0%) |
| Health Care & Social Assistance | 3 (8.6%) | 32 (91.4%) |
| Arts, Entertainment & Recreation | 0 (0.0%) | 0 (0.0%) |
| Accommodation & Food Services | 0 (0.0%) | 0 (0.0%) |
| Public Administration | 18 (52.9%) | 16 (47.1%) |
| Total | 153 (56.0%) | 120 (44.0%) |
Education in Brownton
School Enrollment in Brownton
The most common levels of schooling among the 105 students in Brownton are high school (45 | 42.9%), elementary school (22 | 20.9%), and middle school (16 | 15.2%).
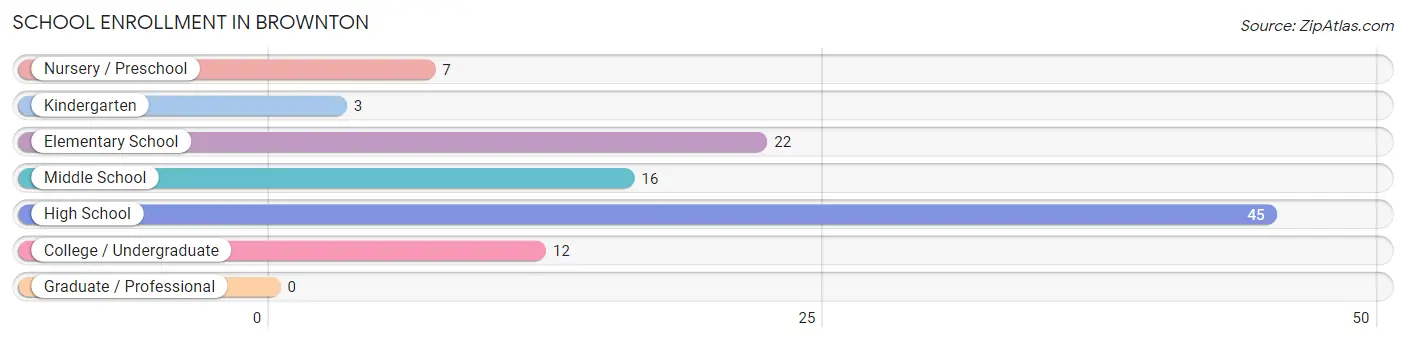
| School Level | # Students | % Students |
| Nursery / Preschool | 7 | 6.7% |
| Kindergarten | 3 | 2.9% |
| Elementary School | 22 | 20.9% |
| Middle School | 16 | 15.2% |
| High School | 45 | 42.9% |
| College / Undergraduate | 12 | 11.4% |
| Graduate / Professional | 0 | 0.0% |
| Total | 105 | 100.0% |
School Enrollment by Age by Funding Source in Brownton
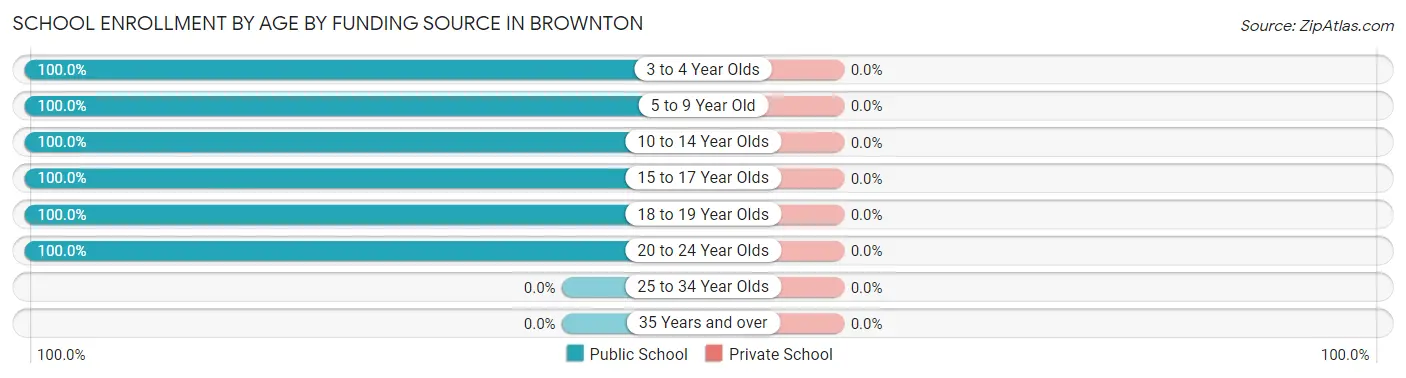
| Age Bracket | Public School | Private School |
| 3 to 4 Year Olds | 7 (100.0%) | 0 (0.0%) |
| 5 to 9 Year Old | 18 (100.0%) | 0 (0.0%) |
| 10 to 14 Year Olds | 26 (100.0%) | 0 (0.0%) |
| 15 to 17 Year Olds | 42 (100.0%) | 0 (0.0%) |
| 18 to 19 Year Olds | 3 (100.0%) | 0 (0.0%) |
| 20 to 24 Year Olds | 9 (100.0%) | 0 (0.0%) |
| 25 to 34 Year Olds | 0 (0.0%) | 0 (0.0%) |
| 35 Years and over | 0 (0.0%) | 0 (0.0%) |
| Total | 105 (100.0%) | 0 (0.0%) |
Educational Attainment by Field of Study in Brownton
Education (18 | 29.5%), business (12 | 19.7%), social sciences (8 | 13.1%), psychology (7 | 11.5%), and science & technology (7 | 11.5%) are the most common fields of study among 61 individuals in Brownton who have obtained a bachelor's degree or higher.
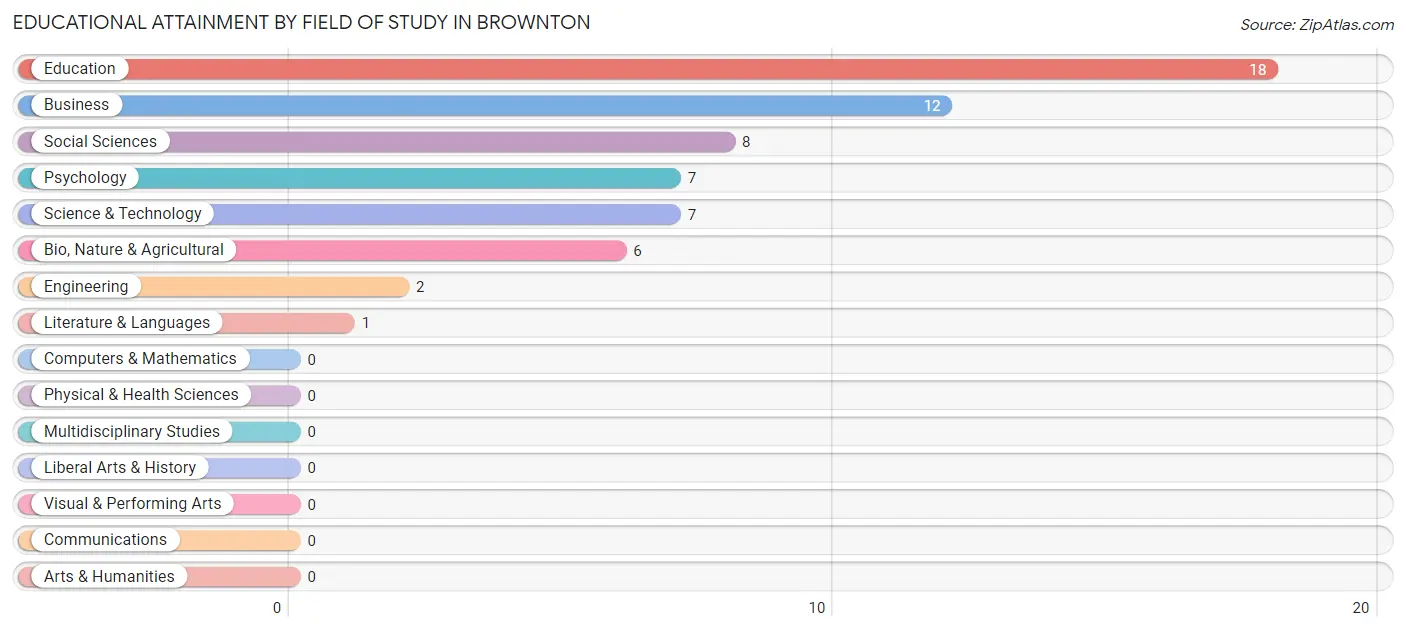
| Field of Study | # Graduates | % Graduates |
| Computers & Mathematics | 0 | 0.0% |
| Bio, Nature & Agricultural | 6 | 9.8% |
| Physical & Health Sciences | 0 | 0.0% |
| Psychology | 7 | 11.5% |
| Social Sciences | 8 | 13.1% |
| Engineering | 2 | 3.3% |
| Multidisciplinary Studies | 0 | 0.0% |
| Science & Technology | 7 | 11.5% |
| Business | 12 | 19.7% |
| Education | 18 | 29.5% |
| Literature & Languages | 1 | 1.6% |
| Liberal Arts & History | 0 | 0.0% |
| Visual & Performing Arts | 0 | 0.0% |
| Communications | 0 | 0.0% |
| Arts & Humanities | 0 | 0.0% |
| Total | 61 | 100.0% |
Transportation & Commute in Brownton
Vehicle Availability by Sex in Brownton
The most prevalent vehicle ownership categories in Brownton are males with 3 vehicles (66, accounting for 43.1%) and females with 3 vehicles (39, making up 55.0%).
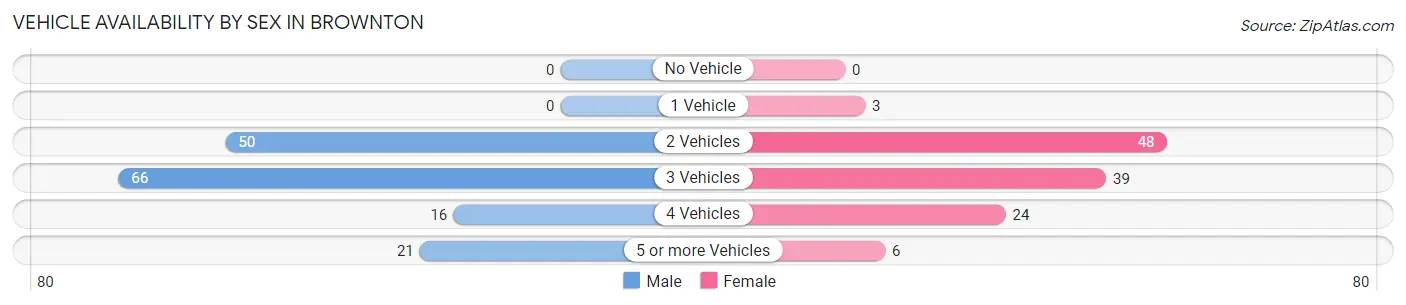
| Vehicles Available | Male | Female |
| No Vehicle | 0 (0.0%) | 0 (0.0%) |
| 1 Vehicle | 0 (0.0%) | 3 (2.5%) |
| 2 Vehicles | 50 (32.7%) | 48 (40.0%) |
| 3 Vehicles | 66 (43.1%) | 39 (32.5%) |
| 4 Vehicles | 16 (10.5%) | 24 (20.0%) |
| 5 or more Vehicles | 21 (13.7%) | 6 (5.0%) |
| Total | 153 (100.0%) | 120 (100.0%) |
Commute Time in Brownton
The most frequently occuring commute durations in Brownton are 15 to 19 minutes (93 commuters, 37.5%), 20 to 24 minutes (57 commuters, 23.0%), and 60 to 89 minutes (24 commuters, 9.7%).
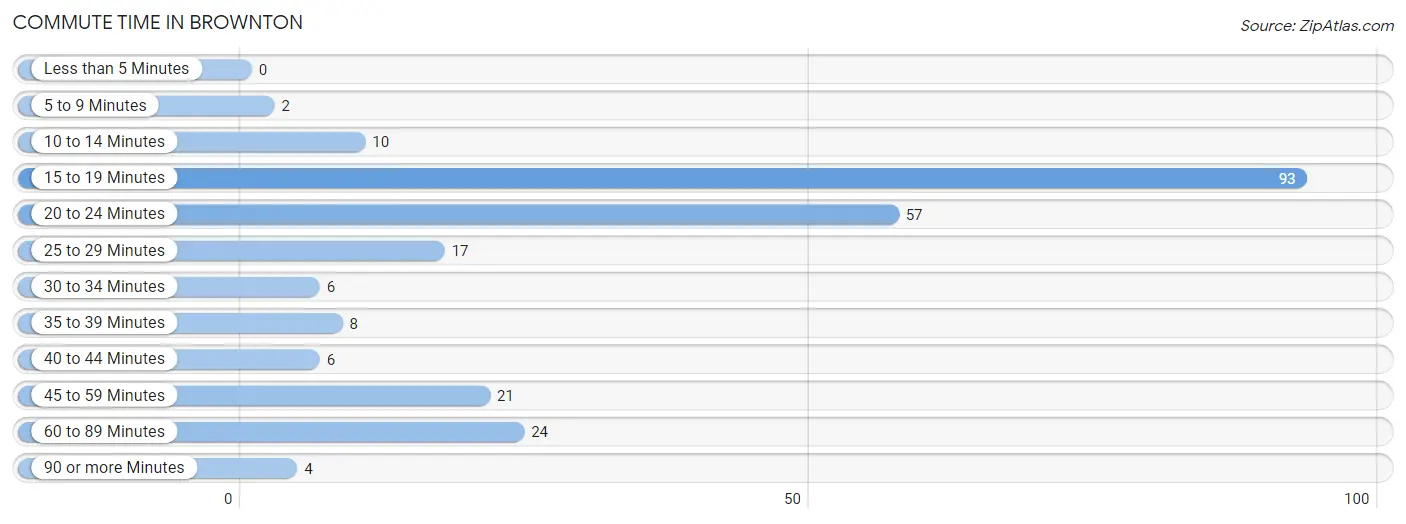
| Commute Time | # Commuters | % Commuters |
| Less than 5 Minutes | 0 | 0.0% |
| 5 to 9 Minutes | 2 | 0.8% |
| 10 to 14 Minutes | 10 | 4.0% |
| 15 to 19 Minutes | 93 | 37.5% |
| 20 to 24 Minutes | 57 | 23.0% |
| 25 to 29 Minutes | 17 | 6.9% |
| 30 to 34 Minutes | 6 | 2.4% |
| 35 to 39 Minutes | 8 | 3.2% |
| 40 to 44 Minutes | 6 | 2.4% |
| 45 to 59 Minutes | 21 | 8.5% |
| 60 to 89 Minutes | 24 | 9.7% |
| 90 or more Minutes | 4 | 1.6% |
Commute Time by Sex in Brownton
The most common commute times in Brownton are 15 to 19 minutes (49 commuters, 33.6%) for males and 15 to 19 minutes (44 commuters, 43.1%) for females.
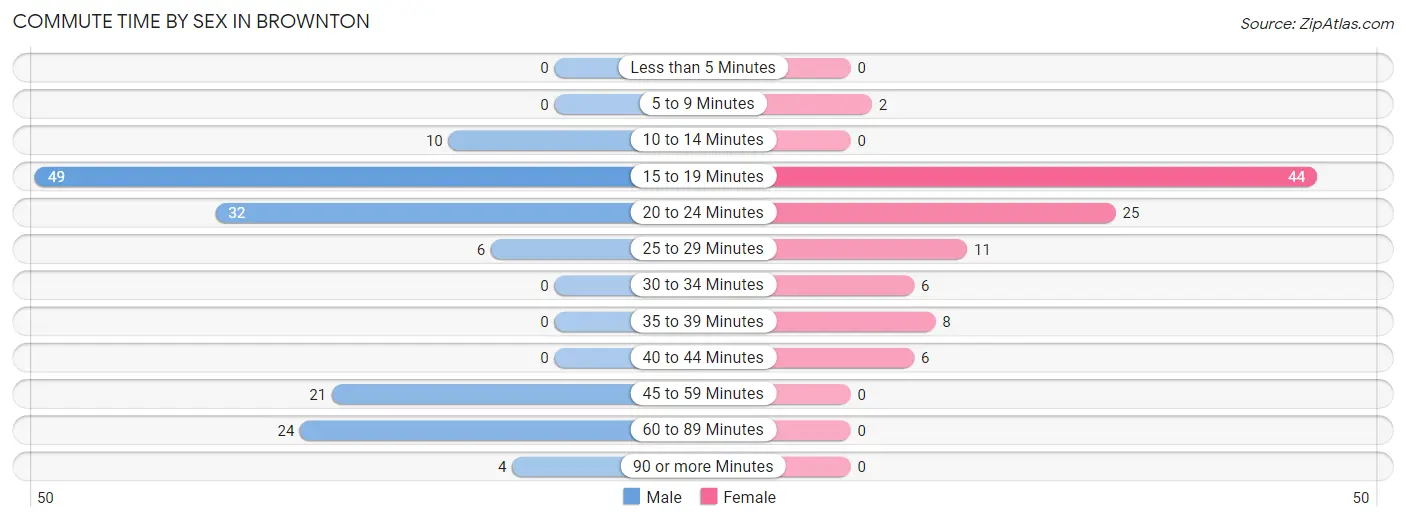
| Commute Time | Male | Female |
| Less than 5 Minutes | 0 (0.0%) | 0 (0.0%) |
| 5 to 9 Minutes | 0 (0.0%) | 2 (2.0%) |
| 10 to 14 Minutes | 10 (6.9%) | 0 (0.0%) |
| 15 to 19 Minutes | 49 (33.6%) | 44 (43.1%) |
| 20 to 24 Minutes | 32 (21.9%) | 25 (24.5%) |
| 25 to 29 Minutes | 6 (4.1%) | 11 (10.8%) |
| 30 to 34 Minutes | 0 (0.0%) | 6 (5.9%) |
| 35 to 39 Minutes | 0 (0.0%) | 8 (7.8%) |
| 40 to 44 Minutes | 0 (0.0%) | 6 (5.9%) |
| 45 to 59 Minutes | 21 (14.4%) | 0 (0.0%) |
| 60 to 89 Minutes | 24 (16.4%) | 0 (0.0%) |
| 90 or more Minutes | 4 (2.7%) | 0 (0.0%) |
Time of Departure to Work by Sex in Brownton
The most frequent times of departure to work in Brownton are 6:00 AM to 6:29 AM (38, 26.0%) for males and 6:00 AM to 6:29 AM (16, 15.7%) for females.
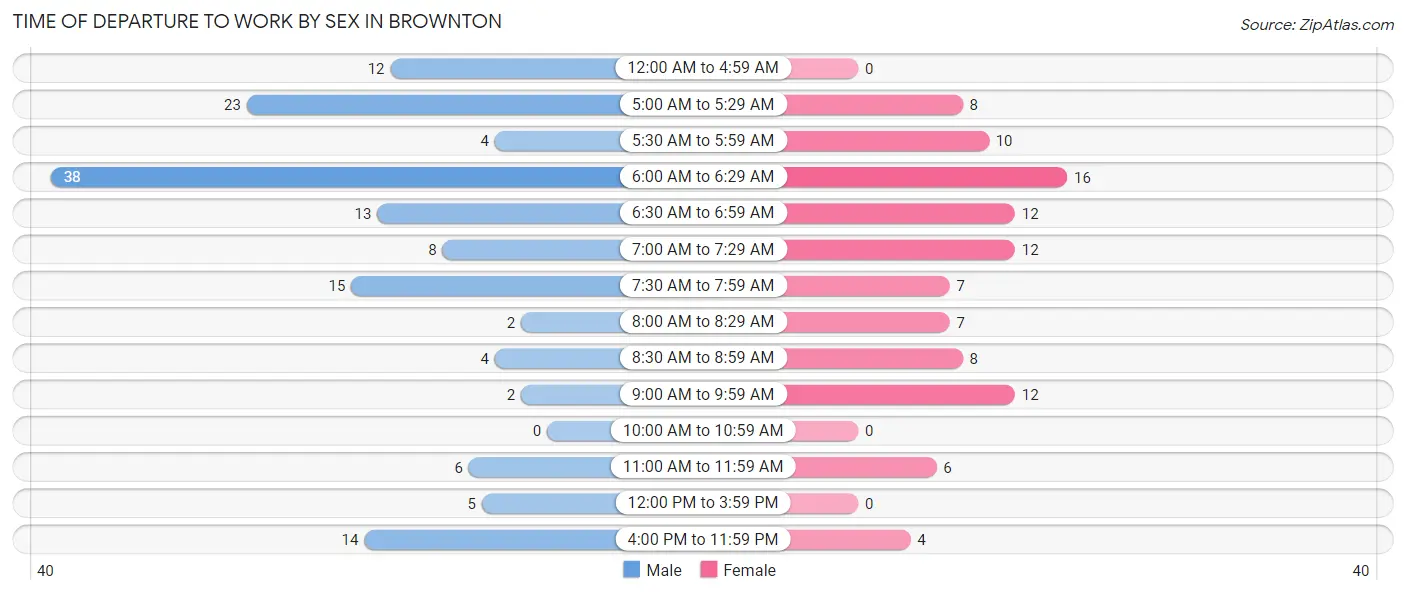
| Time of Departure | Male | Female |
| 12:00 AM to 4:59 AM | 12 (8.2%) | 0 (0.0%) |
| 5:00 AM to 5:29 AM | 23 (15.8%) | 8 (7.8%) |
| 5:30 AM to 5:59 AM | 4 (2.7%) | 10 (9.8%) |
| 6:00 AM to 6:29 AM | 38 (26.0%) | 16 (15.7%) |
| 6:30 AM to 6:59 AM | 13 (8.9%) | 12 (11.8%) |
| 7:00 AM to 7:29 AM | 8 (5.5%) | 12 (11.8%) |
| 7:30 AM to 7:59 AM | 15 (10.3%) | 7 (6.9%) |
| 8:00 AM to 8:29 AM | 2 (1.4%) | 7 (6.9%) |
| 8:30 AM to 8:59 AM | 4 (2.7%) | 8 (7.8%) |
| 9:00 AM to 9:59 AM | 2 (1.4%) | 12 (11.8%) |
| 10:00 AM to 10:59 AM | 0 (0.0%) | 0 (0.0%) |
| 11:00 AM to 11:59 AM | 6 (4.1%) | 6 (5.9%) |
| 12:00 PM to 3:59 PM | 5 (3.4%) | 0 (0.0%) |
| 4:00 PM to 11:59 PM | 14 (9.6%) | 4 (3.9%) |
| Total | 146 (100.0%) | 102 (100.0%) |
Housing Occupancy in Brownton
Occupancy by Ownership in Brownton
Of the total 239 dwellings in Brownton, owner-occupied units account for 203 (84.9%), while renter-occupied units make up 36 (15.1%).
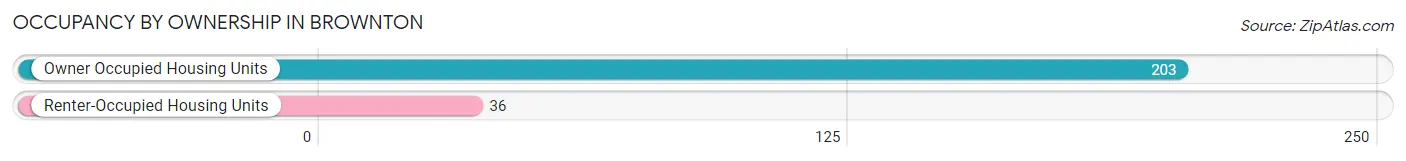
| Occupancy | # Housing Units | % Housing Units |
| Owner Occupied Housing Units | 203 | 84.9% |
| Renter-Occupied Housing Units | 36 | 15.1% |
| Total Occupied Housing Units | 239 | 100.0% |
Occupancy by Household Size in Brownton
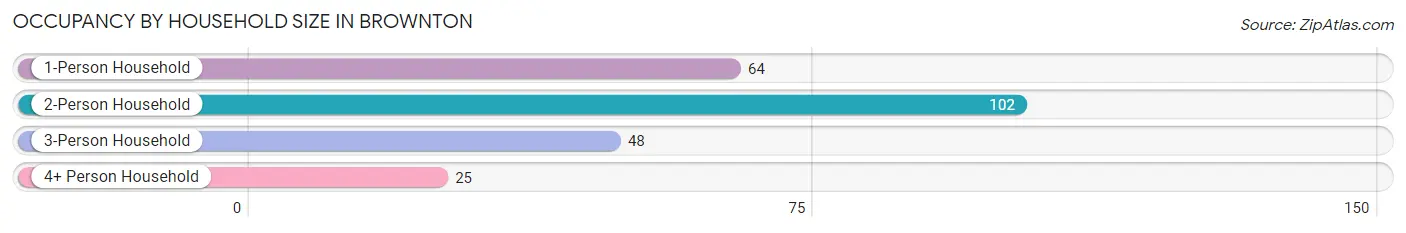
| Household Size | # Housing Units | % Housing Units |
| 1-Person Household | 64 | 26.8% |
| 2-Person Household | 102 | 42.7% |
| 3-Person Household | 48 | 20.1% |
| 4+ Person Household | 25 | 10.5% |
| Total Housing Units | 239 | 100.0% |
Occupancy by Ownership by Household Size in Brownton
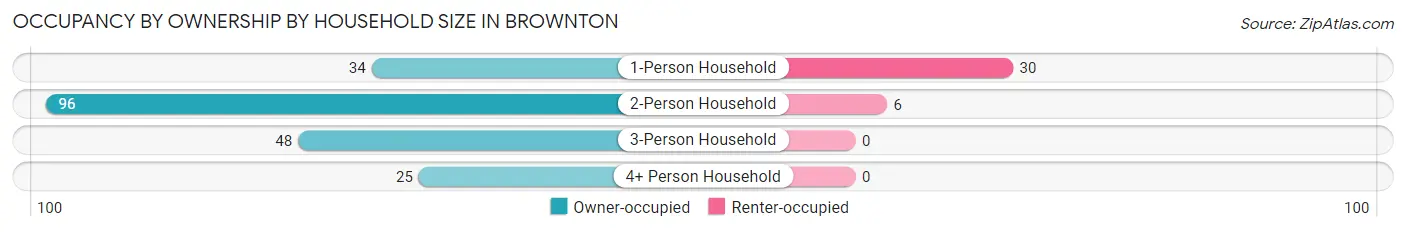
| Household Size | Owner-occupied | Renter-occupied |
| 1-Person Household | 34 (53.1%) | 30 (46.9%) |
| 2-Person Household | 96 (94.1%) | 6 (5.9%) |
| 3-Person Household | 48 (100.0%) | 0 (0.0%) |
| 4+ Person Household | 25 (100.0%) | 0 (0.0%) |
| Total Housing Units | 203 (84.9%) | 36 (15.1%) |
Occupancy by Educational Attainment in Brownton
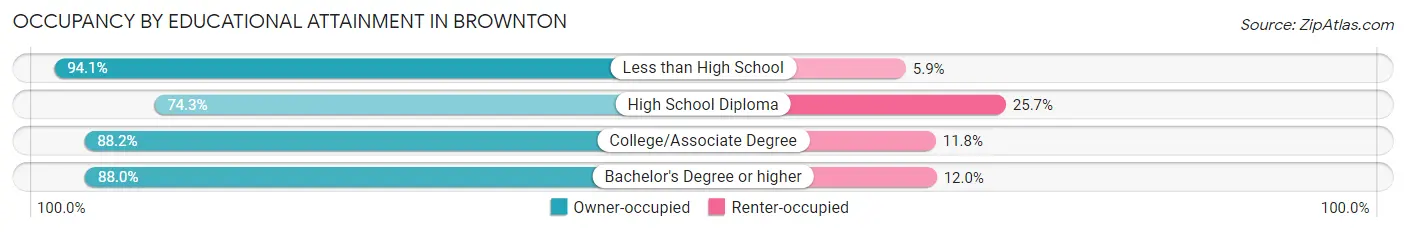
| Household Size | Owner-occupied | Renter-occupied |
| Less than High School | 32 (94.1%) | 2 (5.9%) |
| High School Diploma | 52 (74.3%) | 18 (25.7%) |
| College/Associate Degree | 97 (88.2%) | 13 (11.8%) |
| Bachelor's Degree or higher | 22 (88.0%) | 3 (12.0%) |
Occupancy by Age of Householder in Brownton
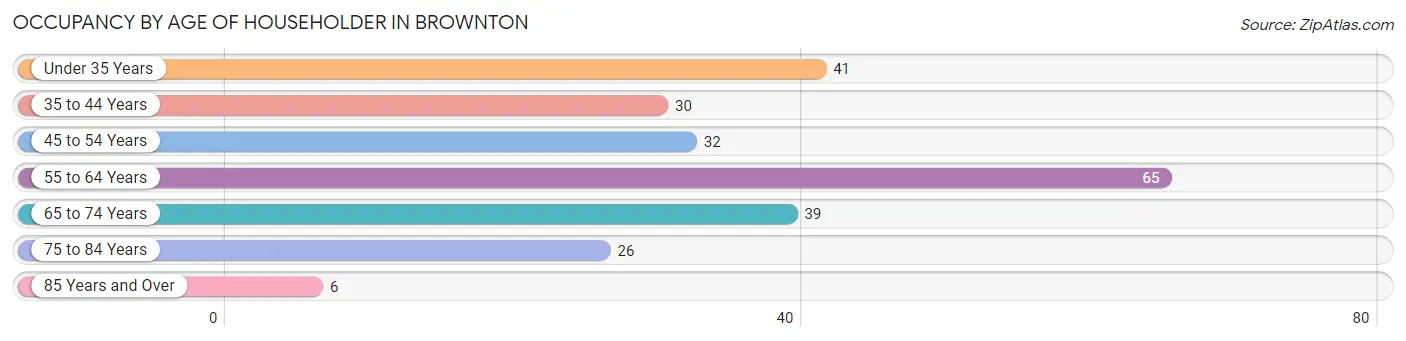
| Age Bracket | # Households | % Households |
| Under 35 Years | 41 | 17.2% |
| 35 to 44 Years | 30 | 12.6% |
| 45 to 54 Years | 32 | 13.4% |
| 55 to 64 Years | 65 | 27.2% |
| 65 to 74 Years | 39 | 16.3% |
| 75 to 84 Years | 26 | 10.9% |
| 85 Years and Over | 6 | 2.5% |
| Total | 239 | 100.0% |
Housing Finances in Brownton
Median Income by Occupancy in Brownton
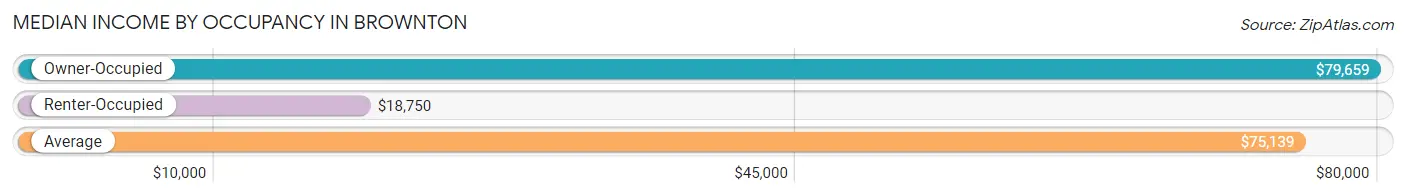
| Occupancy Type | # Households | Median Income |
| Owner-Occupied | 203 (84.9%) | $79,659 |
| Renter-Occupied | 36 (15.1%) | $18,750 |
| Average | 239 (100.0%) | $75,139 |
Occupancy by Householder Income Bracket in Brownton
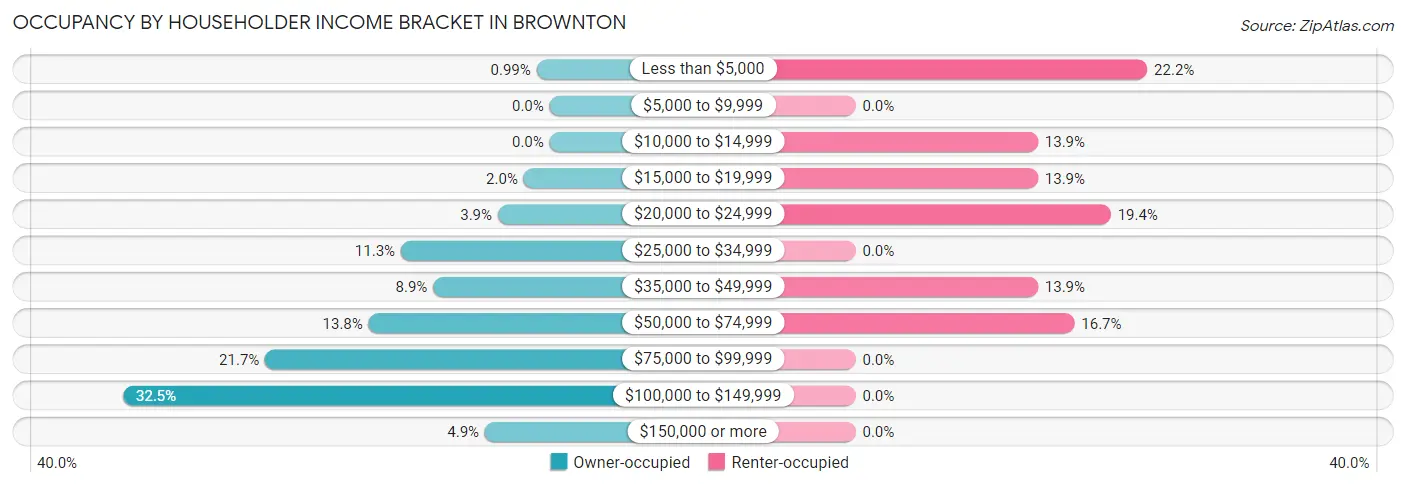
| Income Bracket | Owner-occupied | Renter-occupied |
| Less than $5,000 | 2 (1.0%) | 8 (22.2%) |
| $5,000 to $9,999 | 0 (0.0%) | 0 (0.0%) |
| $10,000 to $14,999 | 0 (0.0%) | 5 (13.9%) |
| $15,000 to $19,999 | 4 (2.0%) | 5 (13.9%) |
| $20,000 to $24,999 | 8 (3.9%) | 7 (19.4%) |
| $25,000 to $34,999 | 23 (11.3%) | 0 (0.0%) |
| $35,000 to $49,999 | 18 (8.9%) | 5 (13.9%) |
| $50,000 to $74,999 | 28 (13.8%) | 6 (16.7%) |
| $75,000 to $99,999 | 44 (21.7%) | 0 (0.0%) |
| $100,000 to $149,999 | 66 (32.5%) | 0 (0.0%) |
| $150,000 or more | 10 (4.9%) | 0 (0.0%) |
| Total | 203 (100.0%) | 36 (100.0%) |
Monthly Housing Cost Tiers in Brownton
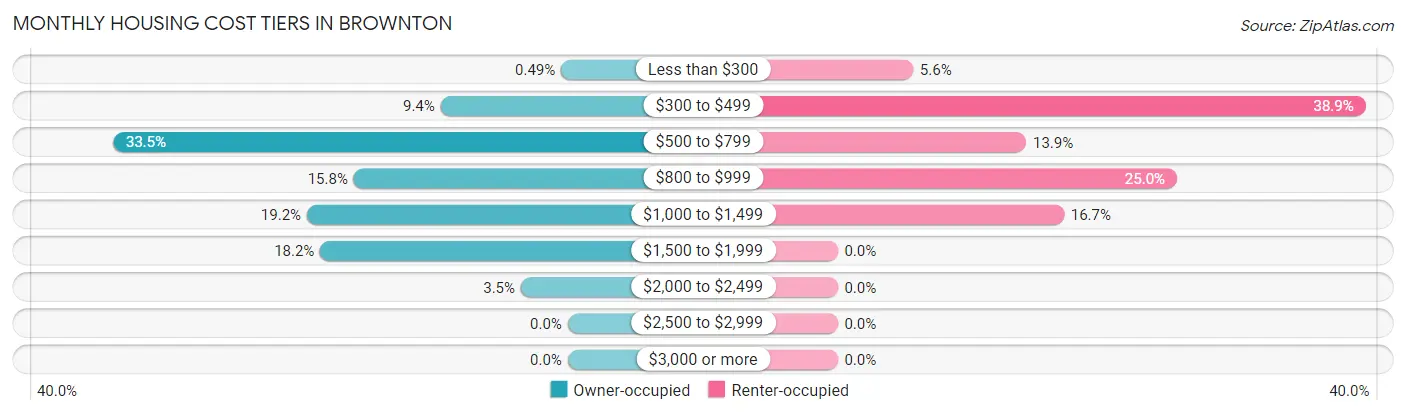
| Monthly Cost | Owner-occupied | Renter-occupied |
| Less than $300 | 1 (0.5%) | 2 (5.6%) |
| $300 to $499 | 19 (9.4%) | 14 (38.9%) |
| $500 to $799 | 68 (33.5%) | 5 (13.9%) |
| $800 to $999 | 32 (15.8%) | 9 (25.0%) |
| $1,000 to $1,499 | 39 (19.2%) | 6 (16.7%) |
| $1,500 to $1,999 | 37 (18.2%) | 0 (0.0%) |
| $2,000 to $2,499 | 7 (3.5%) | 0 (0.0%) |
| $2,500 to $2,999 | 0 (0.0%) | 0 (0.0%) |
| $3,000 or more | 0 (0.0%) | 0 (0.0%) |
| Total | 203 (100.0%) | 36 (100.0%) |
Physical Housing Characteristics in Brownton
Housing Structures in Brownton
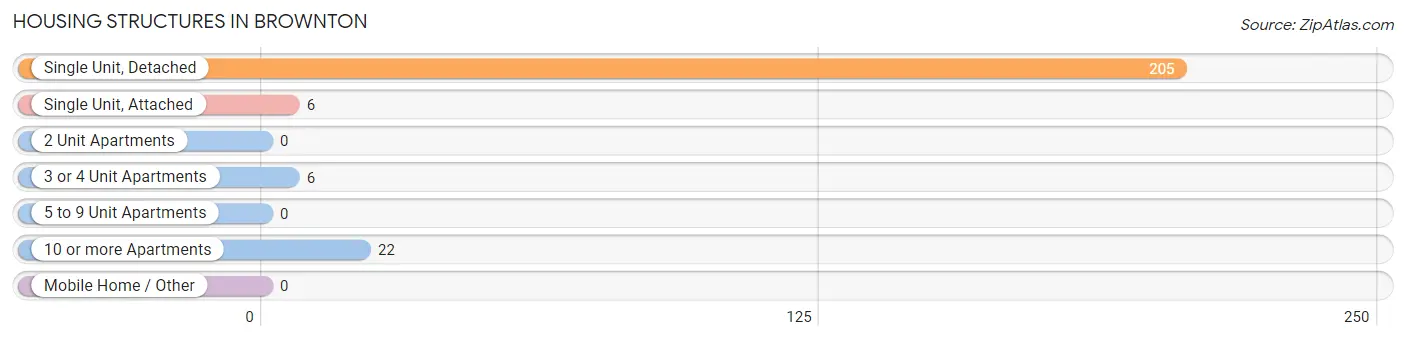
| Structure Type | # Housing Units | % Housing Units |
| Single Unit, Detached | 205 | 85.8% |
| Single Unit, Attached | 6 | 2.5% |
| 2 Unit Apartments | 0 | 0.0% |
| 3 or 4 Unit Apartments | 6 | 2.5% |
| 5 to 9 Unit Apartments | 0 | 0.0% |
| 10 or more Apartments | 22 | 9.2% |
| Mobile Home / Other | 0 | 0.0% |
| Total | 239 | 100.0% |
Housing Structures by Occupancy in Brownton
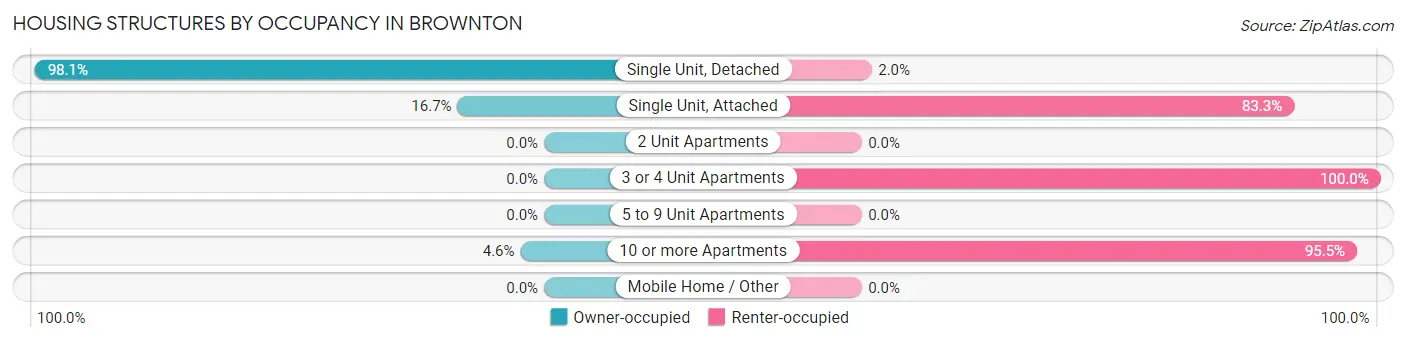
| Structure Type | Owner-occupied | Renter-occupied |
| Single Unit, Detached | 201 (98.1%) | 4 (1.9%) |
| Single Unit, Attached | 1 (16.7%) | 5 (83.3%) |
| 2 Unit Apartments | 0 (0.0%) | 0 (0.0%) |
| 3 or 4 Unit Apartments | 0 (0.0%) | 6 (100.0%) |
| 5 to 9 Unit Apartments | 0 (0.0%) | 0 (0.0%) |
| 10 or more Apartments | 1 (4.5%) | 21 (95.5%) |
| Mobile Home / Other | 0 (0.0%) | 0 (0.0%) |
| Total | 203 (84.9%) | 36 (15.1%) |
Housing Structures by Number of Rooms in Brownton
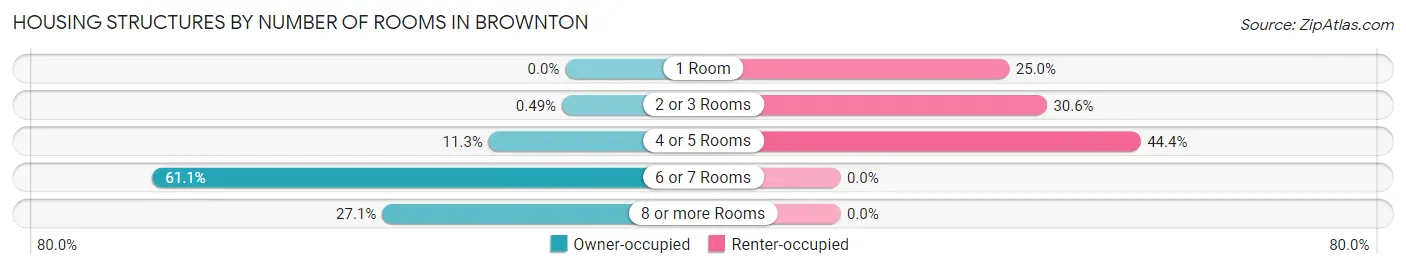
| Number of Rooms | Owner-occupied | Renter-occupied |
| 1 Room | 0 (0.0%) | 9 (25.0%) |
| 2 or 3 Rooms | 1 (0.5%) | 11 (30.6%) |
| 4 or 5 Rooms | 23 (11.3%) | 16 (44.4%) |
| 6 or 7 Rooms | 124 (61.1%) | 0 (0.0%) |
| 8 or more Rooms | 55 (27.1%) | 0 (0.0%) |
| Total | 203 (100.0%) | 36 (100.0%) |
Housing Structure by Heating Type in Brownton
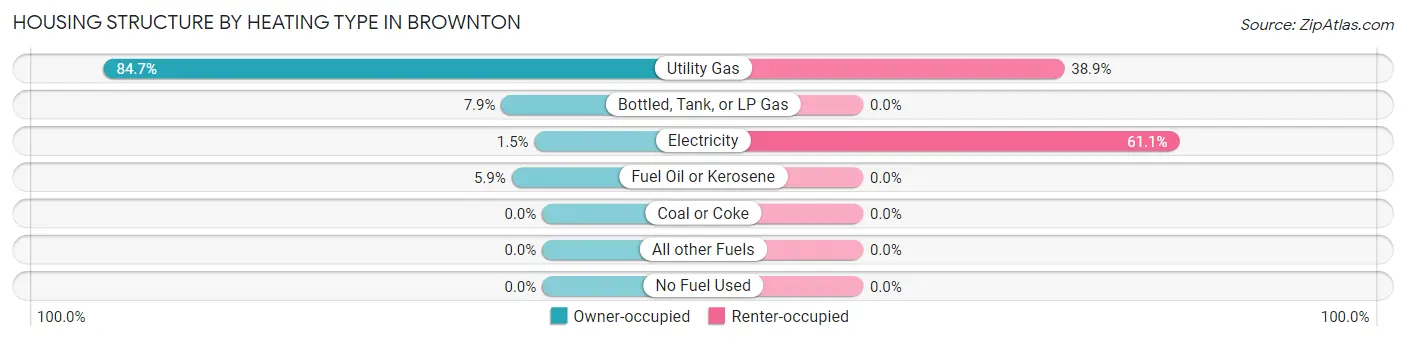
| Heating Type | Owner-occupied | Renter-occupied |
| Utility Gas | 172 (84.7%) | 14 (38.9%) |
| Bottled, Tank, or LP Gas | 16 (7.9%) | 0 (0.0%) |
| Electricity | 3 (1.5%) | 22 (61.1%) |
| Fuel Oil or Kerosene | 12 (5.9%) | 0 (0.0%) |
| Coal or Coke | 0 (0.0%) | 0 (0.0%) |
| All other Fuels | 0 (0.0%) | 0 (0.0%) |
| No Fuel Used | 0 (0.0%) | 0 (0.0%) |
| Total | 203 (100.0%) | 36 (100.0%) |
Household Vehicle Usage in Brownton
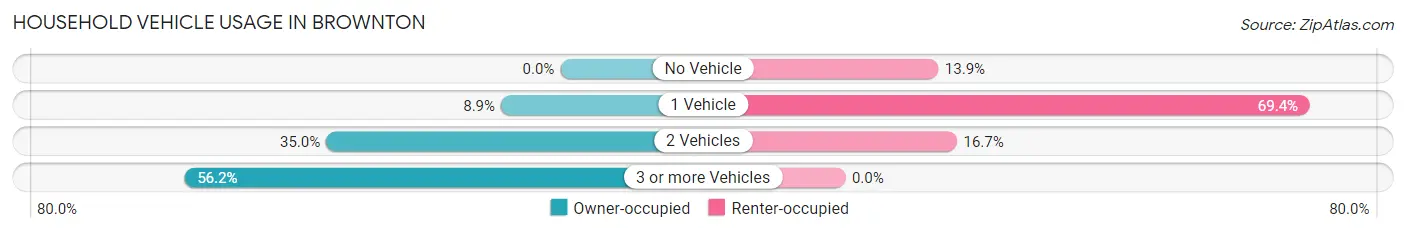
| Vehicles per Household | Owner-occupied | Renter-occupied |
| No Vehicle | 0 (0.0%) | 5 (13.9%) |
| 1 Vehicle | 18 (8.9%) | 25 (69.4%) |
| 2 Vehicles | 71 (35.0%) | 6 (16.7%) |
| 3 or more Vehicles | 114 (56.2%) | 0 (0.0%) |
| Total | 203 (100.0%) | 36 (100.0%) |
Real Estate & Mortgages in Brownton
Real Estate and Mortgage Overview in Brownton
| Characteristic | Without Mortgage | With Mortgage |
| Housing Units | 82 | 121 |
| Median Property Value | $127,100 | $155,100 |
| Median Household Income | $57,500 | $8 |
| Monthly Housing Costs | $618 | $0 |
| Real Estate Taxes | $2,486 | $0 |
Property Value by Mortgage Status in Brownton
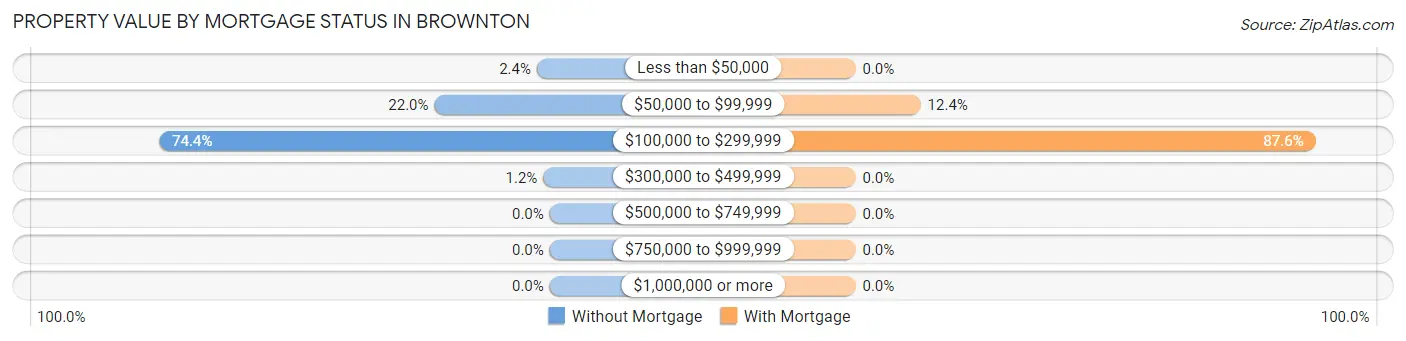
| Property Value | Without Mortgage | With Mortgage |
| Less than $50,000 | 2 (2.4%) | 0 (0.0%) |
| $50,000 to $99,999 | 18 (22.0%) | 15 (12.4%) |
| $100,000 to $299,999 | 61 (74.4%) | 106 (87.6%) |
| $300,000 to $499,999 | 1 (1.2%) | 0 (0.0%) |
| $500,000 to $749,999 | 0 (0.0%) | 0 (0.0%) |
| $750,000 to $999,999 | 0 (0.0%) | 0 (0.0%) |
| $1,000,000 or more | 0 (0.0%) | 0 (0.0%) |
| Total | 82 (100.0%) | 121 (100.0%) |
Household Income by Mortgage Status in Brownton
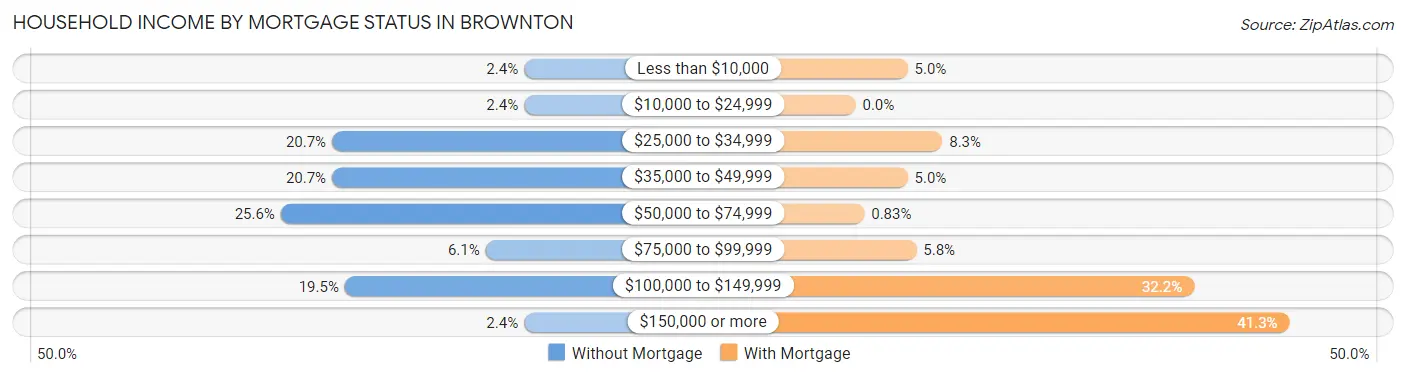
| Household Income | Without Mortgage | With Mortgage |
| Less than $10,000 | 2 (2.4%) | 6 (5.0%) |
| $10,000 to $24,999 | 2 (2.4%) | 0 (0.0%) |
| $25,000 to $34,999 | 17 (20.7%) | 10 (8.3%) |
| $35,000 to $49,999 | 17 (20.7%) | 6 (5.0%) |
| $50,000 to $74,999 | 21 (25.6%) | 1 (0.8%) |
| $75,000 to $99,999 | 5 (6.1%) | 7 (5.8%) |
| $100,000 to $149,999 | 16 (19.5%) | 39 (32.2%) |
| $150,000 or more | 2 (2.4%) | 50 (41.3%) |
| Total | 82 (100.0%) | 121 (100.0%) |
Property Value to Household Income Ratio in Brownton
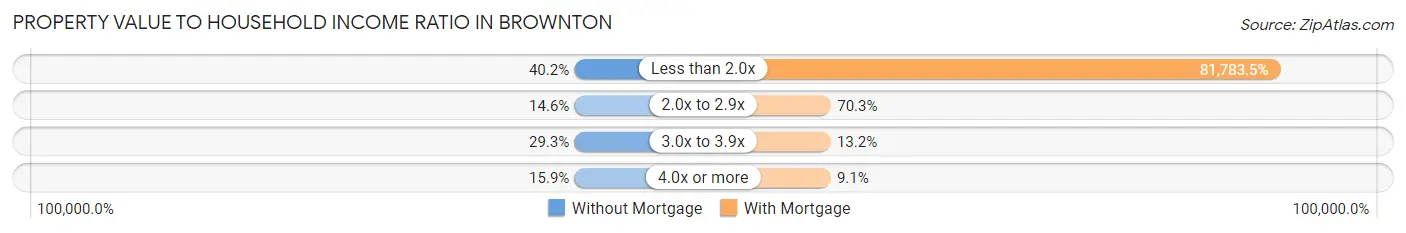
| Value-to-Income Ratio | Without Mortgage | With Mortgage |
| Less than 2.0x | 33 (40.2%) | 98,958 (81,783.5%) |
| 2.0x to 2.9x | 12 (14.6%) | 85 (70.3%) |
| 3.0x to 3.9x | 24 (29.3%) | 16 (13.2%) |
| 4.0x or more | 13 (15.9%) | 11 (9.1%) |
| Total | 82 (100.0%) | 121 (100.0%) |
Real Estate Taxes by Mortgage Status in Brownton
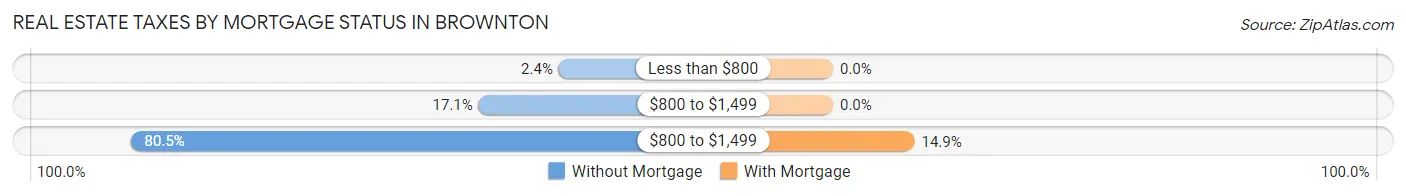
| Property Taxes | Without Mortgage | With Mortgage |
| Less than $800 | 2 (2.4%) | 0 (0.0%) |
| $800 to $1,499 | 14 (17.1%) | 0 (0.0%) |
| $800 to $1,499 | 66 (80.5%) | 18 (14.9%) |
| Total | 82 (100.0%) | 121 (100.0%) |
Health & Disability in Brownton
Health Insurance Coverage by Age in Brownton
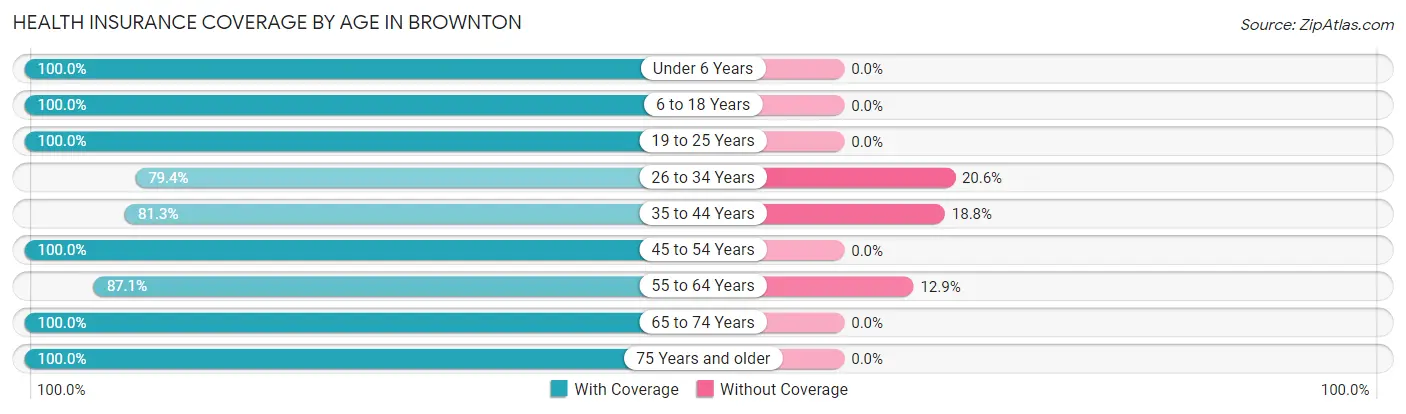
| Age Bracket | With Coverage | Without Coverage |
| Under 6 Years | 14 (100.0%) | 0 (0.0%) |
| 6 to 18 Years | 89 (100.0%) | 0 (0.0%) |
| 19 to 25 Years | 11 (100.0%) | 0 (0.0%) |
| 26 to 34 Years | 50 (79.4%) | 13 (20.6%) |
| 35 to 44 Years | 65 (81.2%) | 15 (18.8%) |
| 45 to 54 Years | 56 (100.0%) | 0 (0.0%) |
| 55 to 64 Years | 108 (87.1%) | 16 (12.9%) |
| 65 to 74 Years | 63 (100.0%) | 0 (0.0%) |
| 75 Years and older | 43 (100.0%) | 0 (0.0%) |
| Total | 499 (91.9%) | 44 (8.1%) |
Health Insurance Coverage by Citizenship Status in Brownton
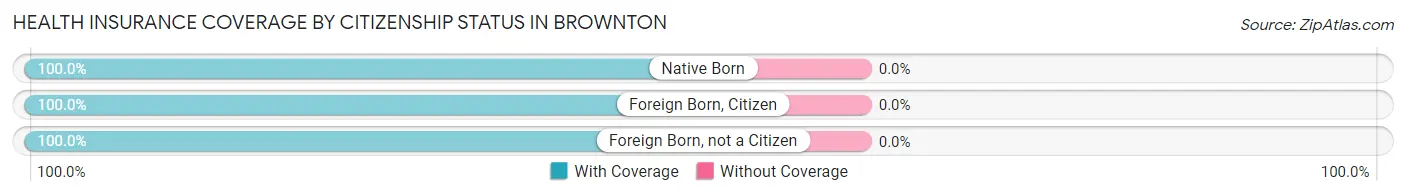
| Citizenship Status | With Coverage | Without Coverage |
| Native Born | 14 (100.0%) | 0 (0.0%) |
| Foreign Born, Citizen | 89 (100.0%) | 0 (0.0%) |
| Foreign Born, not a Citizen | 11 (100.0%) | 0 (0.0%) |
Health Insurance Coverage by Household Income in Brownton
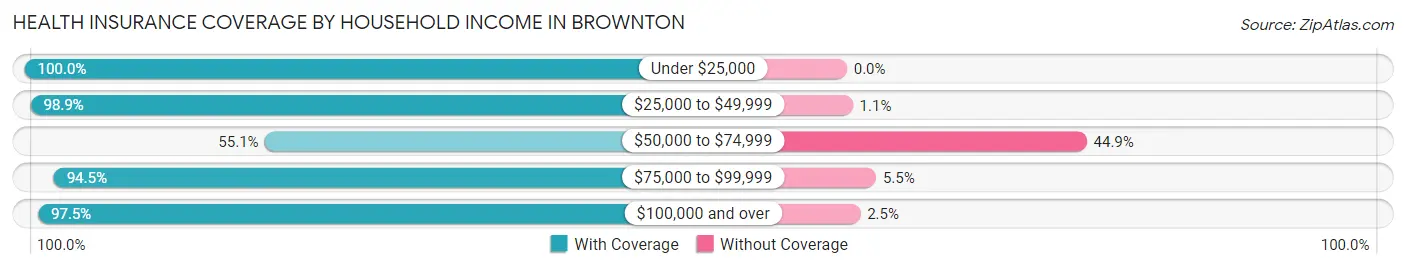
| Household Income | With Coverage | Without Coverage |
| Under $25,000 | 56 (100.0%) | 0 (0.0%) |
| $25,000 to $49,999 | 90 (98.9%) | 1 (1.1%) |
| $50,000 to $74,999 | 38 (55.1%) | 31 (44.9%) |
| $75,000 to $99,999 | 121 (94.5%) | 7 (5.5%) |
| $100,000 and over | 194 (97.5%) | 5 (2.5%) |
Public vs Private Health Insurance Coverage by Age in Brownton
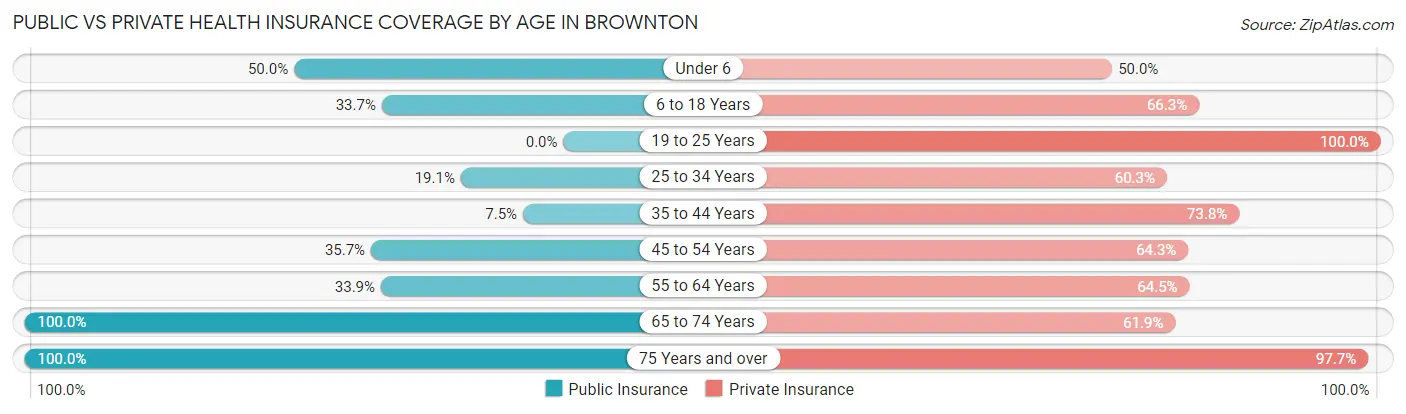
| Age Bracket | Public Insurance | Private Insurance |
| Under 6 | 7 (50.0%) | 7 (50.0%) |
| 6 to 18 Years | 30 (33.7%) | 59 (66.3%) |
| 19 to 25 Years | 0 (0.0%) | 11 (100.0%) |
| 25 to 34 Years | 12 (19.1%) | 38 (60.3%) |
| 35 to 44 Years | 6 (7.5%) | 59 (73.8%) |
| 45 to 54 Years | 20 (35.7%) | 36 (64.3%) |
| 55 to 64 Years | 42 (33.9%) | 80 (64.5%) |
| 65 to 74 Years | 63 (100.0%) | 39 (61.9%) |
| 75 Years and over | 43 (100.0%) | 42 (97.7%) |
| Total | 223 (41.1%) | 371 (68.3%) |
Disability Status by Sex by Age in Brownton
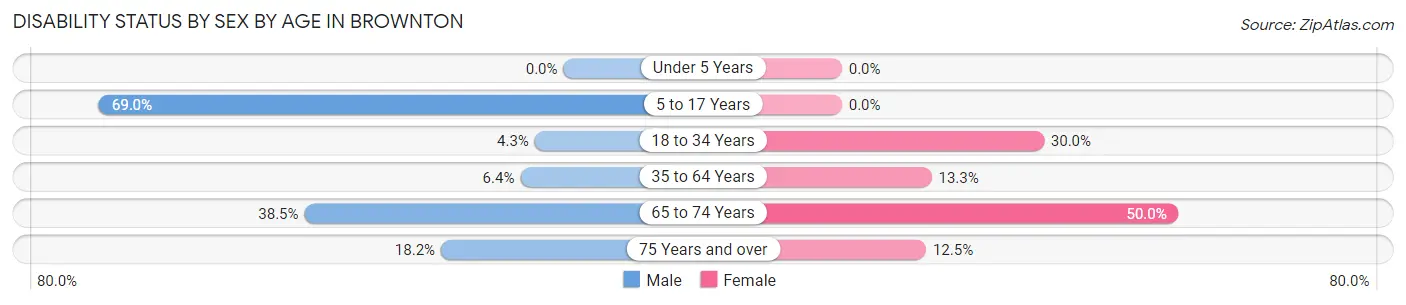
| Age Bracket | Male | Female |
| Under 5 Years | 0 (0.0%) | 0 (0.0%) |
| 5 to 17 Years | 20 (69.0%) | 0 (0.0%) |
| 18 to 34 Years | 2 (4.3%) | 9 (30.0%) |
| 35 to 64 Years | 8 (6.4%) | 18 (13.3%) |
| 65 to 74 Years | 15 (38.5%) | 12 (50.0%) |
| 75 Years and over | 2 (18.2%) | 4 (12.5%) |
Disability Class by Sex by Age in Brownton
Disability Class: Hearing Difficulty
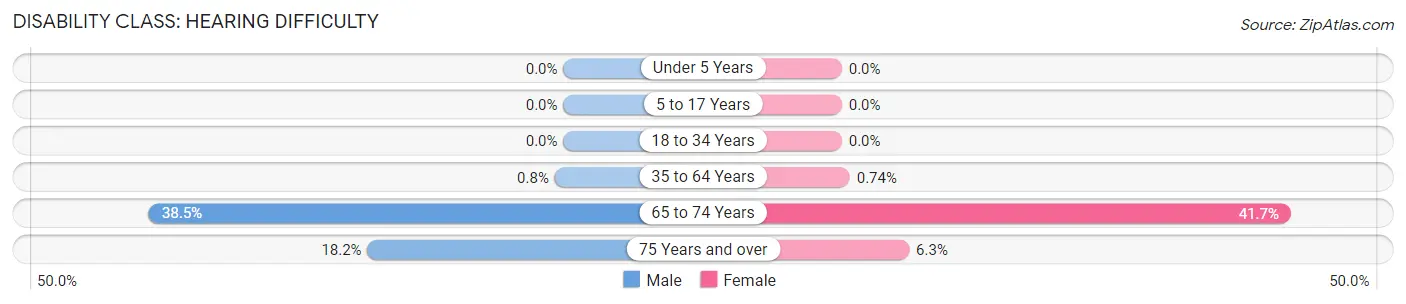
| Age Bracket | Male | Female |
| Under 5 Years | 0 (0.0%) | 0 (0.0%) |
| 5 to 17 Years | 0 (0.0%) | 0 (0.0%) |
| 18 to 34 Years | 0 (0.0%) | 0 (0.0%) |
| 35 to 64 Years | 1 (0.8%) | 1 (0.7%) |
| 65 to 74 Years | 15 (38.5%) | 10 (41.7%) |
| 75 Years and over | 2 (18.2%) | 2 (6.2%) |
Disability Class: Vision Difficulty
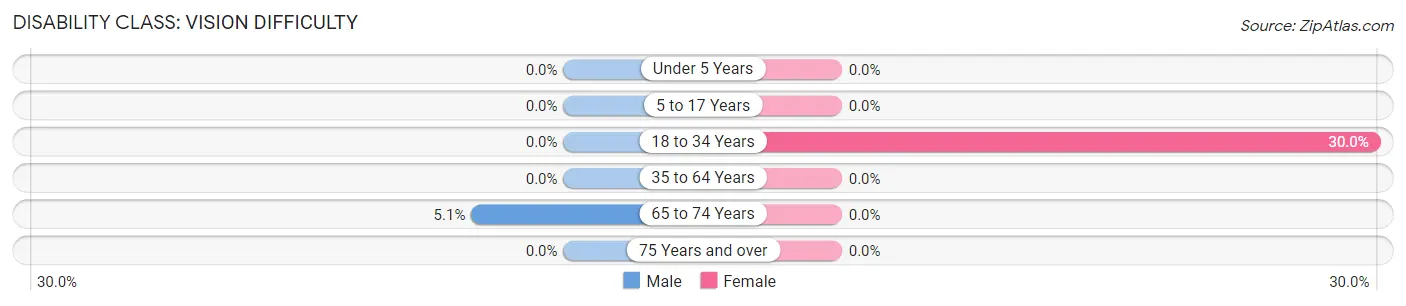
| Age Bracket | Male | Female |
| Under 5 Years | 0 (0.0%) | 0 (0.0%) |
| 5 to 17 Years | 0 (0.0%) | 0 (0.0%) |
| 18 to 34 Years | 0 (0.0%) | 9 (30.0%) |
| 35 to 64 Years | 0 (0.0%) | 0 (0.0%) |
| 65 to 74 Years | 2 (5.1%) | 0 (0.0%) |
| 75 Years and over | 0 (0.0%) | 0 (0.0%) |
Disability Class: Cognitive Difficulty
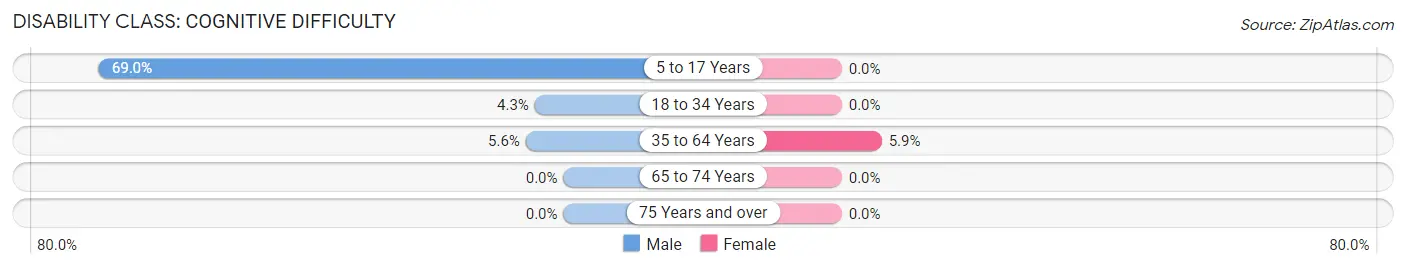
| Age Bracket | Male | Female |
| 5 to 17 Years | 20 (69.0%) | 0 (0.0%) |
| 18 to 34 Years | 2 (4.3%) | 0 (0.0%) |
| 35 to 64 Years | 7 (5.6%) | 8 (5.9%) |
| 65 to 74 Years | 0 (0.0%) | 0 (0.0%) |
| 75 Years and over | 0 (0.0%) | 0 (0.0%) |
Disability Class: Ambulatory Difficulty
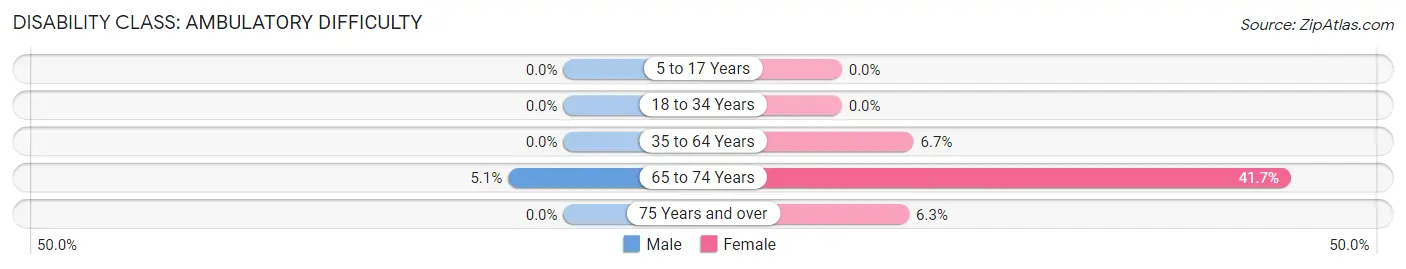
| Age Bracket | Male | Female |
| 5 to 17 Years | 0 (0.0%) | 0 (0.0%) |
| 18 to 34 Years | 0 (0.0%) | 0 (0.0%) |
| 35 to 64 Years | 0 (0.0%) | 9 (6.7%) |
| 65 to 74 Years | 2 (5.1%) | 10 (41.7%) |
| 75 Years and over | 0 (0.0%) | 2 (6.2%) |
Disability Class: Self-Care Difficulty
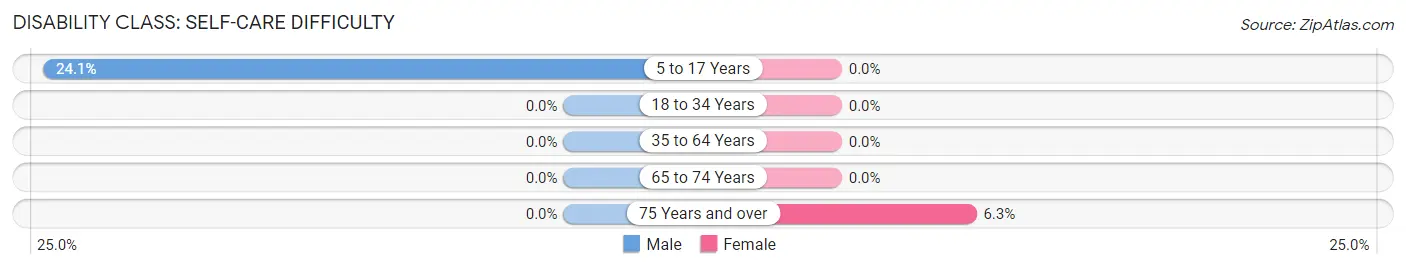
| Age Bracket | Male | Female |
| 5 to 17 Years | 7 (24.1%) | 0 (0.0%) |
| 18 to 34 Years | 0 (0.0%) | 0 (0.0%) |
| 35 to 64 Years | 0 (0.0%) | 0 (0.0%) |
| 65 to 74 Years | 0 (0.0%) | 0 (0.0%) |
| 75 Years and over | 0 (0.0%) | 2 (6.2%) |
Technology Access in Brownton
Computing Device Access in Brownton
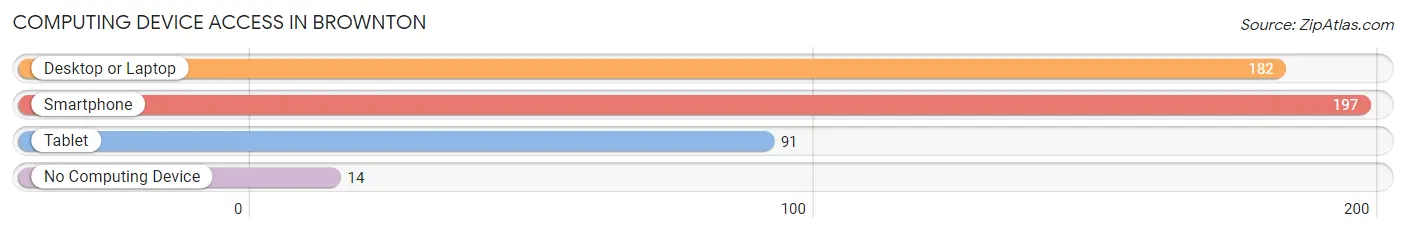
| Device Type | # Households | % Households |
| Desktop or Laptop | 182 | 76.1% |
| Smartphone | 197 | 82.4% |
| Tablet | 91 | 38.1% |
| No Computing Device | 14 | 5.9% |
| Total | 239 | 100.0% |
Internet Access in Brownton
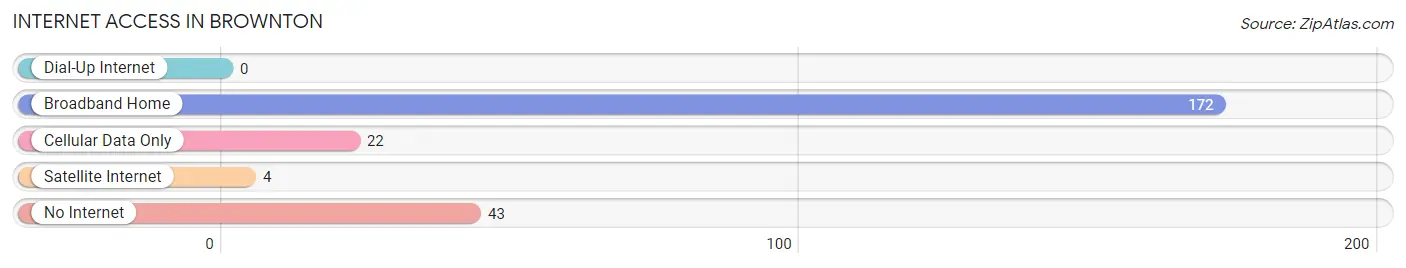
| Internet Type | # Households | % Households |
| Dial-Up Internet | 0 | 0.0% |
| Broadband Home | 172 | 72.0% |
| Cellular Data Only | 22 | 9.2% |
| Satellite Internet | 4 | 1.7% |
| No Internet | 43 | 18.0% |
| Total | 239 | 100.0% |
Brownton Summary
Brownston is a small city located in McLeod County, Minnesota. It is situated on the banks of the Crow River, about 25 miles west of Minneapolis. The city has a population of 1,845 people, according to the 2010 census.
History
Brownston was founded in 1856 by a group of settlers from New York. The town was named after the Brown family, who were among the first settlers. The town was originally a farming community, but it soon became a center for the lumber industry. The first sawmill was built in 1858, and the town quickly grew. By the late 1800s, Brownston had become a thriving community with a population of over 1,000 people.
In the early 1900s, the town began to decline as the lumber industry moved away. The population dropped to just over 500 by the 1950s. However, the town has since seen a resurgence in recent years. The population has grown to 1,845 people, according to the 2010 census.
Geography
Brownston is located in McLeod County, Minnesota. It is situated on the banks of the Crow River, about 25 miles west of Minneapolis. The city has a total area of 1.2 square miles, all of which is land. The terrain is mostly flat, with some rolling hills.
The climate in Brownston is classified as humid continental. Summers are warm and humid, with temperatures reaching into the 80s. Winters are cold and snowy, with temperatures dropping into the single digits.
Economy
The economy of Brownston is largely based on agriculture and manufacturing. The town is home to several small businesses, including a lumber mill, a grain elevator, and a feed mill. The town also has a few retail stores, including a grocery store and a hardware store.
The town is also home to several small farms, which produce a variety of crops, including corn, soybeans, and wheat. The town also has a few small wineries, which produce a variety of wines.
Demographics
According to the 2010 census, the population of Brownston is 1,845 people. The racial makeup of the town is 97.3% White, 0.7% African American, 0.2% Native American, 0.2% Asian, 0.1% Pacific Islander, and 1.5% from other races. The median household income is $45,000, and the median age is 39.
Conclusion
Brownston is a small city located in McLeod County, Minnesota. It is situated on the banks of the Crow River, about 25 miles west of Minneapolis. The city has a population of 1,845 people, according to the 2010 census. The economy of Brownston is largely based on agriculture and manufacturing, and the town is home to several small businesses. The racial makeup of the town is 97.3% White, 0.7% African American, 0.2% Native American, 0.2% Asian, 0.1% Pacific Islander, and 1.5% from other races. The median household income is $45,000, and the median age is 39. Brownston is a small but vibrant community, and it is a great place to live and work.
Common Questions
What is Per Capita Income in Brownton?
Per Capita income in Brownton is $33,647.
What is the Median Family Income in Brownton?
Median Family Income in Brownton is $76,250.
What is the Median Household income in Brownton?
Median Household Income in Brownton is $75,139.
What is Income or Wage Gap in Brownton?
Income or Wage Gap in Brownton is 39.8%.
Women in Brownton earn 60.2 cents for every dollar earned by a man.
What is Inequality or Gini Index in Brownton?
Inequality or Gini Index in Brownton is 0.34.
What is the Total Population of Brownton?
Total Population of Brownton is 544.
What is the Total Male Population of Brownton?
Total Male Population of Brownton is 258.
What is the Total Female Population of Brownton?
Total Female Population of Brownton is 286.
What is the Ratio of Males per 100 Females in Brownton?
There are 90.21 Males per 100 Females in Brownton.
What is the Ratio of Females per 100 Males in Brownton?
There are 110.85 Females per 100 Males in Brownton.
What is the Median Population Age in Brownton?
Median Population Age in Brownton is 46.8 Years.
What is the Average Family Size in Brownton
Average Family Size in Brownton is 2.7 People.
What is the Average Household Size in Brownton
Average Household Size in Brownton is 2.3 People.
How Large is the Labor Force in Brownton?
There are 286 People in the Labor Forcein in Brownton.
What is the Percentage of People in the Labor Force in Brownton?
60.9% of People are in the Labor Force in Brownton.
What is the Unemployment Rate in Brownton?
Unemployment Rate in Brownton is 4.5%.