Granite Falls, MN Map & Demographics
Granite Falls Map
Granite Falls Overview
$35,526
PER CAPITA INCOME
$91,250
AVG FAMILY INCOME
$58,350
AVG HOUSEHOLD INCOME
36.8%
WAGE / INCOME GAP [ % ]
63.2¢/ $1
WAGE / INCOME GAP [ $ ]
0.44
INEQUALITY / GINI INDEX
2,423
TOTAL POPULATION
1,232
MALE POPULATION
1,191
FEMALE POPULATION
103.44
MALES / 100 FEMALES
96.67
FEMALES / 100 MALES
42.1
MEDIAN AGE
3.0
AVG FAMILY SIZE
2.1
AVG HOUSEHOLD SIZE
1,179
LABOR FORCE [ PEOPLE ]
60.1%
PERCENT IN LABOR FORCE
2.6%
UNEMPLOYMENT RATE
Granite Falls Zip Codes
Income in Granite Falls
Income Overview in Granite Falls
Per Capita Income in Granite Falls is $35,526, while median incomes of families and households are $91,250 and $58,350 respectively.
| Characteristic | Number | Measure |
| Per Capita Income | 2,423 | $35,526 |
| Median Family Income | 538 | $91,250 |
| Mean Family Income | 538 | $105,683 |
| Median Household Income | 1,104 | $58,350 |
| Mean Household Income | 1,104 | $77,961 |
| Income Deficit | 538 | $0 |
| Wage / Income Gap (%) | 2,423 | 36.84% |
| Wage / Income Gap ($) | 2,423 | 63.16¢ per $1 |
| Gini / Inequality Index | 2,423 | 0.44 |
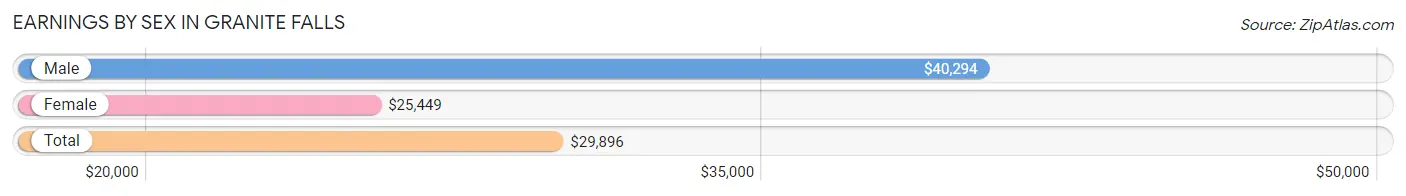
Earnings by Sex in Granite Falls
Average Earnings in Granite Falls are $29,896, $40,294 for men and $25,449 for women, a difference of 36.8%.
| Sex | Number | Average Earnings |
| Male | 722 (56.5%) | $40,294 |
| Female | 557 (43.5%) | $25,449 |
| Total | 1,279 (100.0%) | $29,896 |
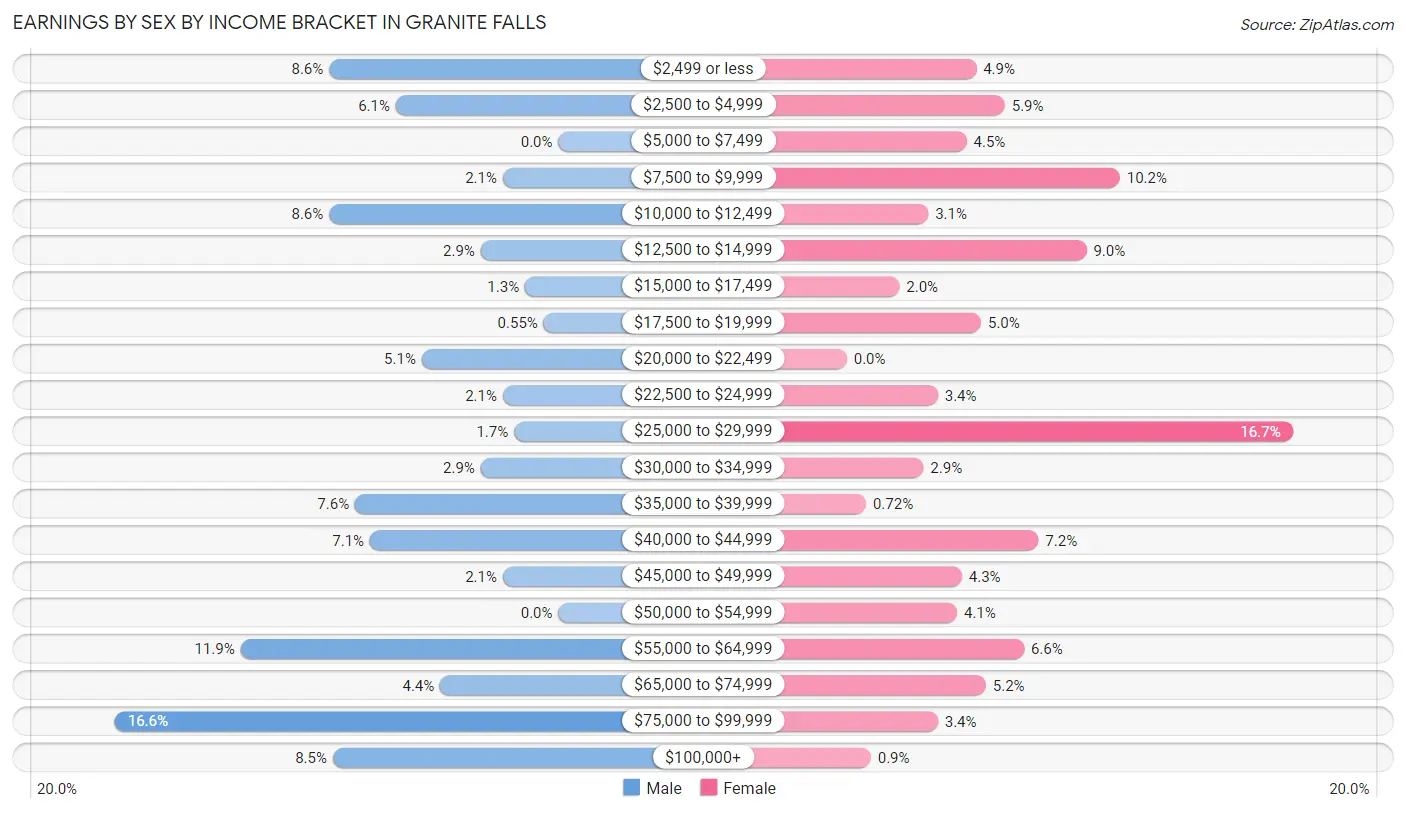
Earnings by Sex by Income Bracket in Granite Falls
The most common earnings brackets in Granite Falls are $75,000 to $99,999 for men (120 | 16.6%) and $25,000 to $29,999 for women (93 | 16.7%).
| Income | Male | Female |
| $2,499 or less | 62 (8.6%) | 27 (4.9%) |
| $2,500 to $4,999 | 44 (6.1%) | 33 (5.9%) |
| $5,000 to $7,499 | 0 (0.0%) | 25 (4.5%) |
| $7,500 to $9,999 | 15 (2.1%) | 57 (10.2%) |
| $10,000 to $12,499 | 62 (8.6%) | 17 (3.0%) |
| $12,500 to $14,999 | 21 (2.9%) | 50 (9.0%) |
| $15,000 to $17,499 | 9 (1.3%) | 11 (2.0%) |
| $17,500 to $19,999 | 4 (0.5%) | 28 (5.0%) |
| $20,000 to $22,499 | 37 (5.1%) | 0 (0.0%) |
| $22,500 to $24,999 | 15 (2.1%) | 19 (3.4%) |
| $25,000 to $29,999 | 12 (1.7%) | 93 (16.7%) |
| $30,000 to $34,999 | 21 (2.9%) | 16 (2.9%) |
| $35,000 to $39,999 | 55 (7.6%) | 4 (0.7%) |
| $40,000 to $44,999 | 51 (7.1%) | 40 (7.2%) |
| $45,000 to $49,999 | 15 (2.1%) | 24 (4.3%) |
| $50,000 to $54,999 | 0 (0.0%) | 23 (4.1%) |
| $55,000 to $64,999 | 86 (11.9%) | 37 (6.6%) |
| $65,000 to $74,999 | 32 (4.4%) | 29 (5.2%) |
| $75,000 to $99,999 | 120 (16.6%) | 19 (3.4%) |
| $100,000+ | 61 (8.5%) | 5 (0.9%) |
| Total | 722 (100.0%) | 557 (100.0%) |
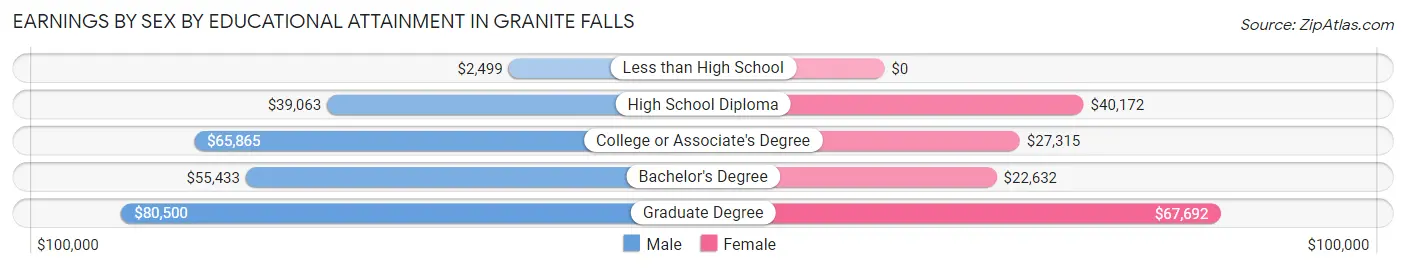
Earnings by Sex by Educational Attainment in Granite Falls
Average earnings in Granite Falls are $47,375 for men and $28,664 for women, a difference of 39.5%. Men with an educational attainment of graduate degree enjoy the highest average annual earnings of $80,500, while those with less than high school education earn the least with $2,499. Women with an educational attainment of graduate degree earn the most with the average annual earnings of $67,692, while those with bachelor's degree education have the smallest earnings of $22,632.
| Educational Attainment | Male Income | Female Income |
| Less than High School | $2,499 | $0 |
| High School Diploma | $39,063 | $40,172 |
| College or Associate's Degree | $65,865 | $27,315 |
| Bachelor's Degree | $55,433 | $22,632 |
| Graduate Degree | $80,500 | $67,692 |
| Total | $47,375 | $28,664 |
Family Income in Granite Falls
Family Income Brackets in Granite Falls
According to the Granite Falls family income data, there are 163 families falling into the $100,000 to $149,999 income range, which is the most common income bracket and makes up 30.3% of all families.
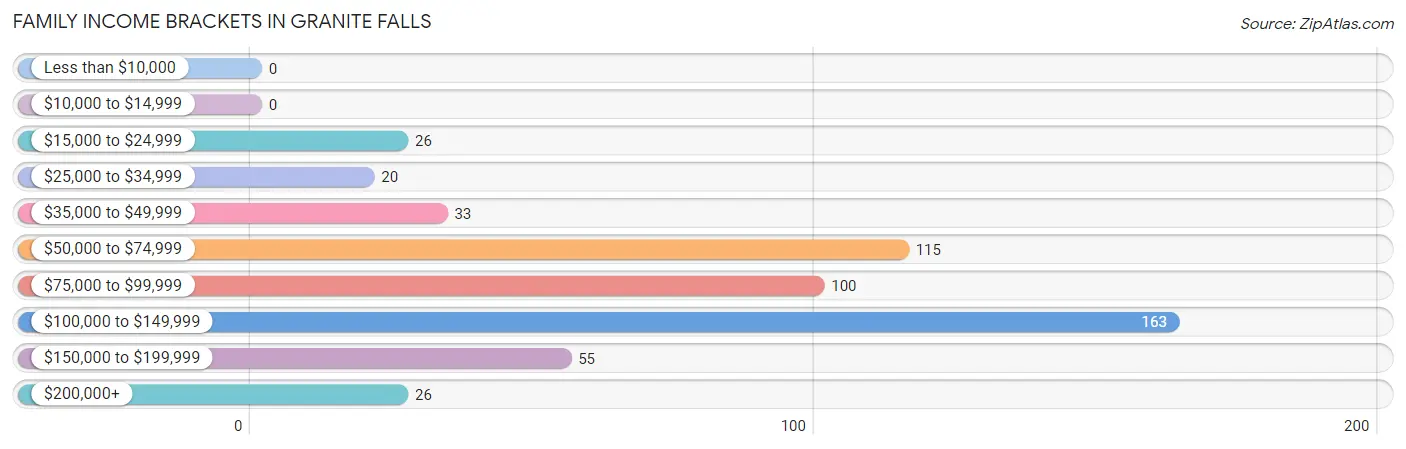
| Income Bracket | # Families | % Families |
| Less than $10,000 | 0 | 0.0% |
| $10,000 to $14,999 | 0 | 0.0% |
| $15,000 to $24,999 | 26 | 4.8% |
| $25,000 to $34,999 | 20 | 3.7% |
| $35,000 to $49,999 | 33 | 6.1% |
| $50,000 to $74,999 | 115 | 21.4% |
| $75,000 to $99,999 | 100 | 18.6% |
| $100,000 to $149,999 | 163 | 30.3% |
| $150,000 to $199,999 | 55 | 10.2% |
| $200,000+ | 26 | 4.8% |
Family Income by Famaliy Size in Granite Falls
3-person families (62 | 11.5%) account for the highest median family income in Granite Falls with $124,615 per family, while 2-person families (301 | 55.9%) have the highest median income of $42,292 per family member.
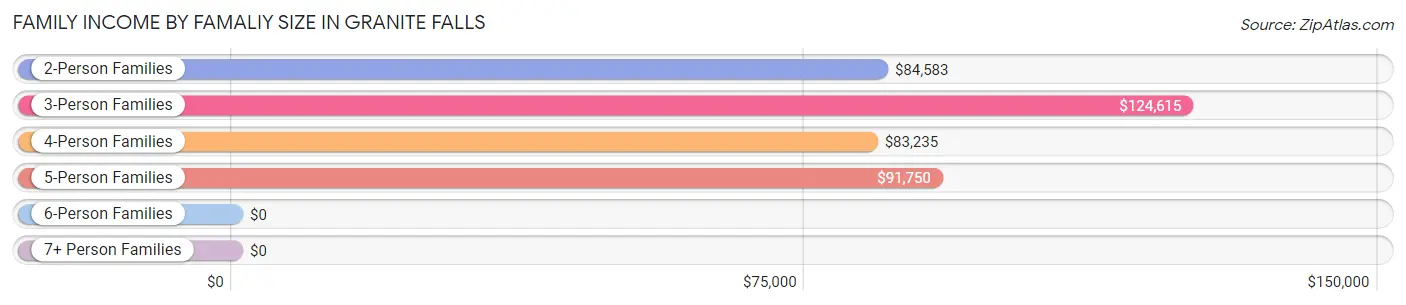
| Income Bracket | # Families | Median Income |
| 2-Person Families | 301 (55.9%) | $84,583 |
| 3-Person Families | 62 (11.5%) | $124,615 |
| 4-Person Families | 84 (15.6%) | $83,235 |
| 5-Person Families | 54 (10.0%) | $91,750 |
| 6-Person Families | 37 (6.9%) | $0 |
| 7+ Person Families | 0 (0.0%) | $0 |
| Total | 538 (100.0%) | $91,250 |
Family Income by Number of Earners in Granite Falls
The median family income in Granite Falls is $91,250, with families comprising 3+ earners (48) having the highest median family income of $185,208, while families with no earners (72) have the lowest median family income of $51,786, accounting for 8.9% and 13.4% of families, respectively.
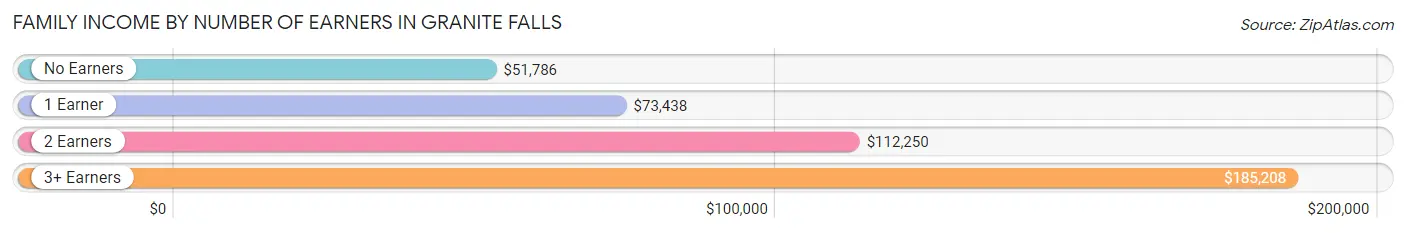
| Number of Earners | # Families | Median Income |
| No Earners | 72 (13.4%) | $51,786 |
| 1 Earner | 225 (41.8%) | $73,438 |
| 2 Earners | 193 (35.9%) | $112,250 |
| 3+ Earners | 48 (8.9%) | $185,208 |
| Total | 538 (100.0%) | $91,250 |
Household Income in Granite Falls
Household Income Brackets in Granite Falls
With 229 households falling in the category, the $50,000 to $74,999 income range is the most frequent in Granite Falls, accounting for 20.7% of all households. In contrast, only 33 households (3.0%) fall into the $200,000+ income bracket, making it the least populous group.
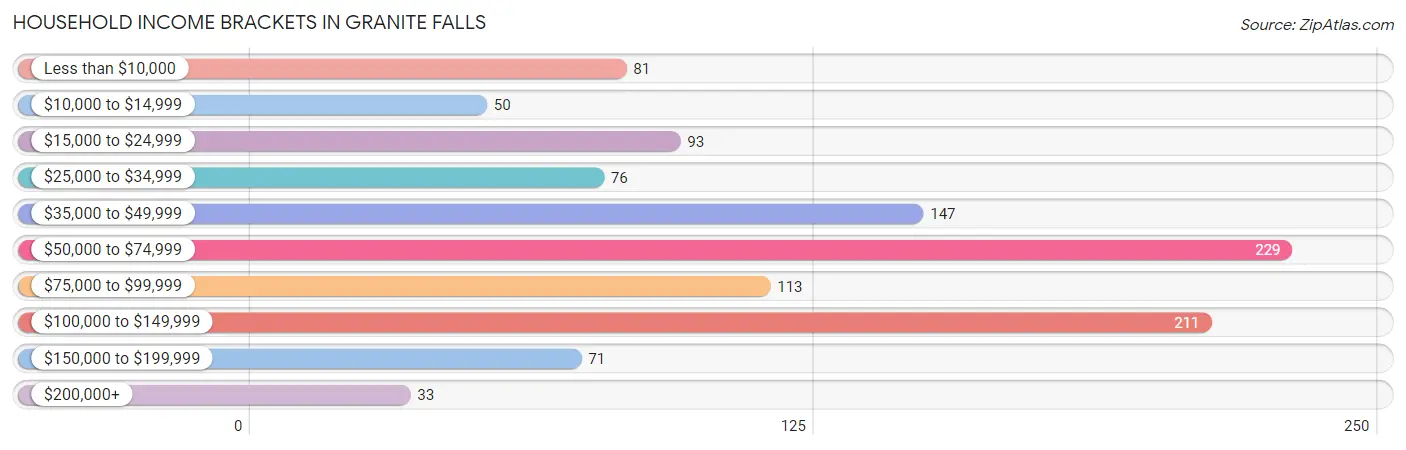
| Income Bracket | # Households | % Households |
| Less than $10,000 | 81 | 7.3% |
| $10,000 to $14,999 | 50 | 4.5% |
| $15,000 to $24,999 | 93 | 8.4% |
| $25,000 to $34,999 | 76 | 6.9% |
| $35,000 to $49,999 | 147 | 13.3% |
| $50,000 to $74,999 | 229 | 20.7% |
| $75,000 to $99,999 | 113 | 10.2% |
| $100,000 to $149,999 | 211 | 19.1% |
| $150,000 to $199,999 | 71 | 6.4% |
| $200,000+ | 33 | 3.0% |
Household Income by Householder Age in Granite Falls
The median household income in Granite Falls is $58,350, with the highest median household income of $84,280 found in the 45 to 64 years age bracket for the primary householder. A total of 331 households (30.0%) fall into this category. Meanwhile, the 15 to 24 years age bracket for the primary householder has the lowest median household income of $0, with 98 households (8.9%) in this group.
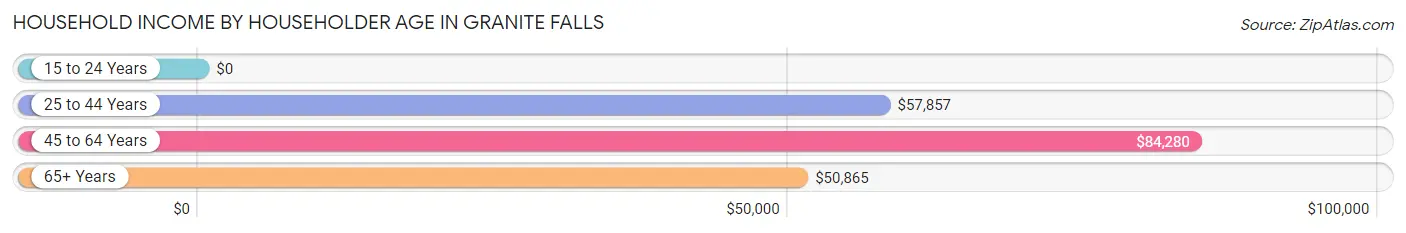
| Income Bracket | # Households | Median Income |
| 15 to 24 Years | 98 (8.9%) | $0 |
| 25 to 44 Years | 252 (22.8%) | $57,857 |
| 45 to 64 Years | 331 (30.0%) | $84,280 |
| 65+ Years | 423 (38.3%) | $50,865 |
| Total | 1,104 (100.0%) | $58,350 |
Poverty in Granite Falls
Income Below Poverty by Sex and Age in Granite Falls
With 5.9% poverty level for males and 16.0% for females among the residents of Granite Falls, 45 to 54 year old males and 55 to 64 year old females are the most vulnerable to poverty, with 20 males (16.4%) and 34 females (35.4%) in their respective age groups living below the poverty level.
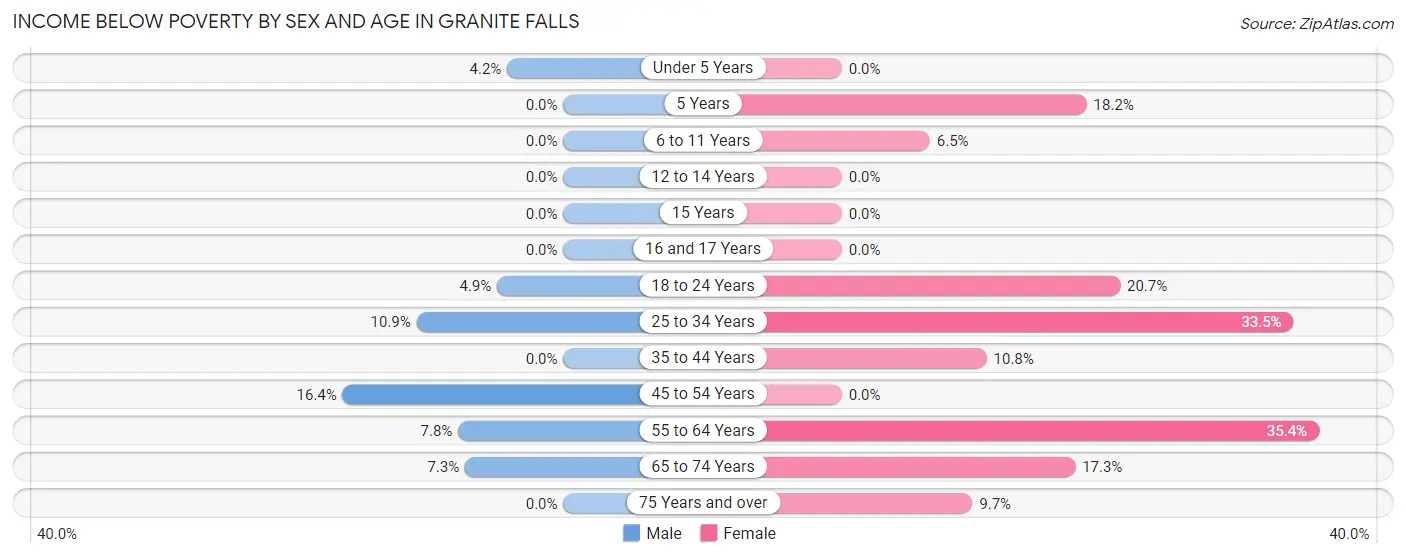
| Age Bracket | Male | Female |
| Under 5 Years | 2 (4.2%) | 0 (0.0%) |
| 5 Years | 0 (0.0%) | 4 (18.2%) |
| 6 to 11 Years | 0 (0.0%) | 7 (6.5%) |
| 12 to 14 Years | 0 (0.0%) | 0 (0.0%) |
| 15 Years | 0 (0.0%) | 0 (0.0%) |
| 16 and 17 Years | 0 (0.0%) | 0 (0.0%) |
| 18 to 24 Years | 6 (4.9%) | 25 (20.7%) |
| 25 to 34 Years | 17 (10.9%) | 58 (33.5%) |
| 35 to 44 Years | 0 (0.0%) | 10 (10.7%) |
| 45 to 54 Years | 20 (16.4%) | 0 (0.0%) |
| 55 to 64 Years | 15 (7.8%) | 34 (35.4%) |
| 65 to 74 Years | 10 (7.3%) | 26 (17.3%) |
| 75 Years and over | 0 (0.0%) | 19 (9.7%) |
| Total | 70 (5.9%) | 183 (16.0%) |
Income Above Poverty by Sex and Age in Granite Falls
According to the poverty statistics in Granite Falls, males aged 5 years and females aged under 5 years are the age groups that are most secure financially, with 100.0% of males and 100.0% of females in these age groups living above the poverty line.
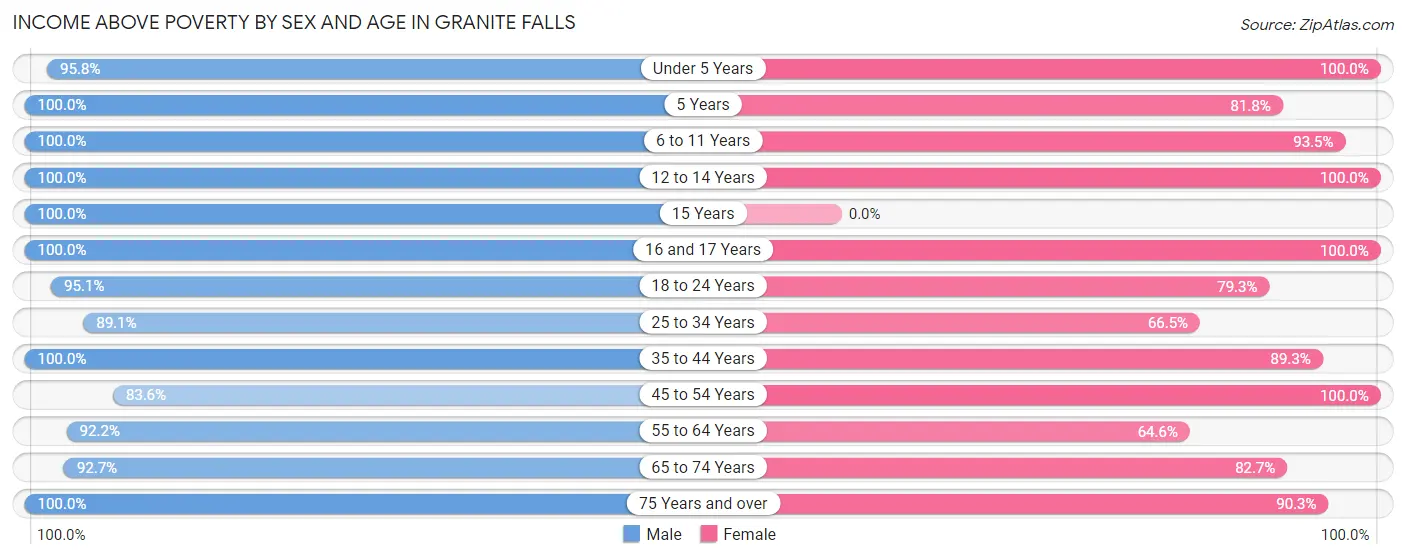
| Age Bracket | Male | Female |
| Under 5 Years | 46 (95.8%) | 81 (100.0%) |
| 5 Years | 6 (100.0%) | 18 (81.8%) |
| 6 to 11 Years | 65 (100.0%) | 100 (93.5%) |
| 12 to 14 Years | 71 (100.0%) | 15 (100.0%) |
| 15 Years | 33 (100.0%) | 0 (0.0%) |
| 16 and 17 Years | 15 (100.0%) | 11 (100.0%) |
| 18 to 24 Years | 116 (95.1%) | 96 (79.3%) |
| 25 to 34 Years | 139 (89.1%) | 115 (66.5%) |
| 35 to 44 Years | 107 (100.0%) | 83 (89.2%) |
| 45 to 54 Years | 102 (83.6%) | 77 (100.0%) |
| 55 to 64 Years | 177 (92.2%) | 62 (64.6%) |
| 65 to 74 Years | 127 (92.7%) | 124 (82.7%) |
| 75 Years and over | 121 (100.0%) | 177 (90.3%) |
| Total | 1,125 (94.1%) | 959 (84.0%) |
Income Below Poverty Among Married-Couple Families in Granite Falls
The poverty statistics for married-couple families in Granite Falls show that 2.1% or 9 of the total 432 families live below the poverty line. Families with no children have the highest poverty rate of 3.3%, comprising of 9 families. On the other hand, families with 1 or 2 children have the lowest poverty rate of 0.0%, which includes 0 families.
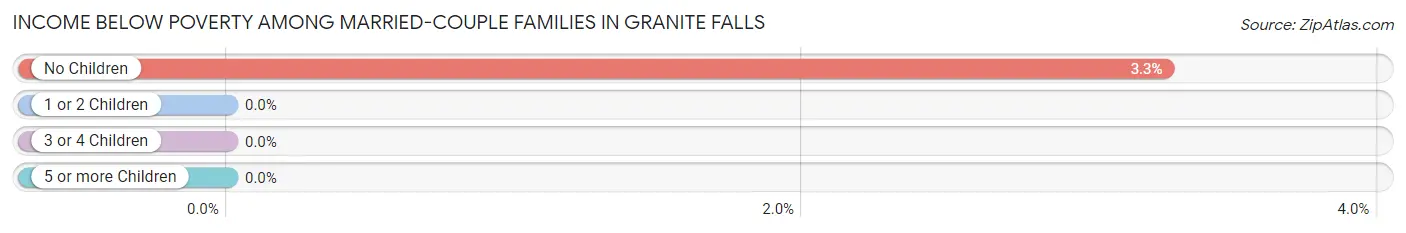
| Children | Above Poverty | Below Poverty |
| No Children | 267 (96.7%) | 9 (3.3%) |
| 1 or 2 Children | 109 (100.0%) | 0 (0.0%) |
| 3 or 4 Children | 47 (100.0%) | 0 (0.0%) |
| 5 or more Children | 0 (0.0%) | 0 (0.0%) |
| Total | 423 (97.9%) | 9 (2.1%) |
Income Below Poverty Among Single-Parent Households in Granite Falls
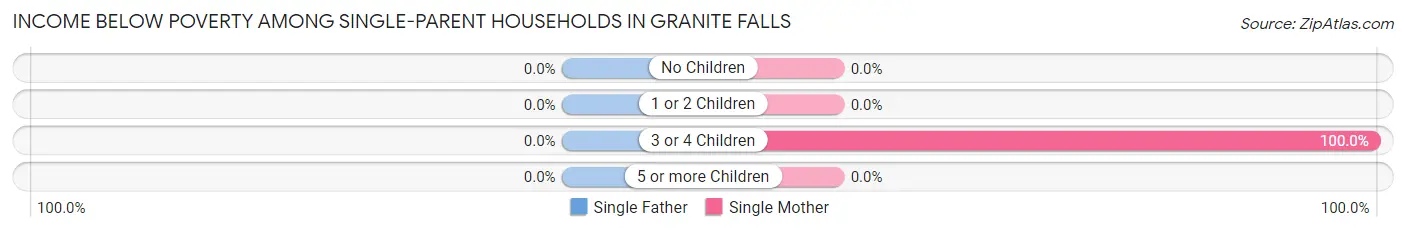
| Children | Single Father | Single Mother |
| No Children | 0 (0.0%) | 0 (0.0%) |
| 1 or 2 Children | 0 (0.0%) | 0 (0.0%) |
| 3 or 4 Children | 0 (0.0%) | 17 (100.0%) |
| 5 or more Children | 0 (0.0%) | 0 (0.0%) |
| Total | 0 (0.0%) | 17 (23.9%) |
Income Below Poverty Among Married-Couple vs Single-Parent Households in Granite Falls
The poverty data for Granite Falls shows that 9 of the married-couple family households (2.1%) and 17 of the single-parent households (16.0%) are living below the poverty level. Within the married-couple family households, those with no children have the highest poverty rate, with 9 households (3.3%) falling below the poverty line. Among the single-parent households, those with 3 or 4 children have the highest poverty rate, with 17 household (100.0%) living below poverty.
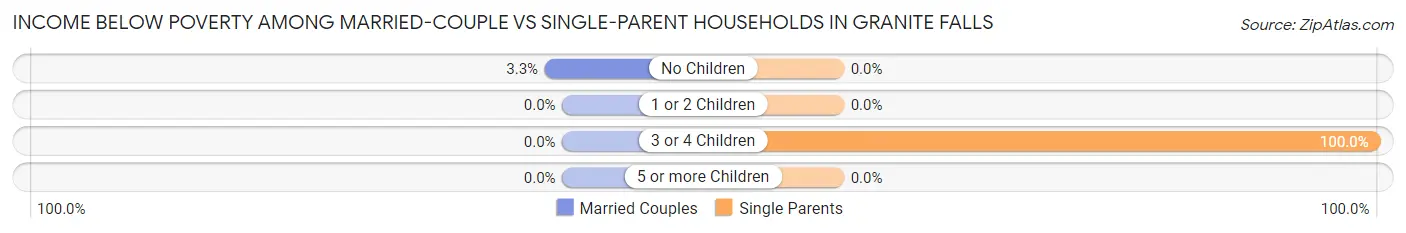
| Children | Married-Couple Families | Single-Parent Households |
| No Children | 9 (3.3%) | 0 (0.0%) |
| 1 or 2 Children | 0 (0.0%) | 0 (0.0%) |
| 3 or 4 Children | 0 (0.0%) | 17 (100.0%) |
| 5 or more Children | 0 (0.0%) | 0 (0.0%) |
| Total | 9 (2.1%) | 17 (16.0%) |
Race in Granite Falls
The most populous races in Granite Falls are White / Caucasian (2,015 | 83.2%), Hispanic or Latino (182 | 7.5%), and Native / Alaskan (173 | 7.1%).
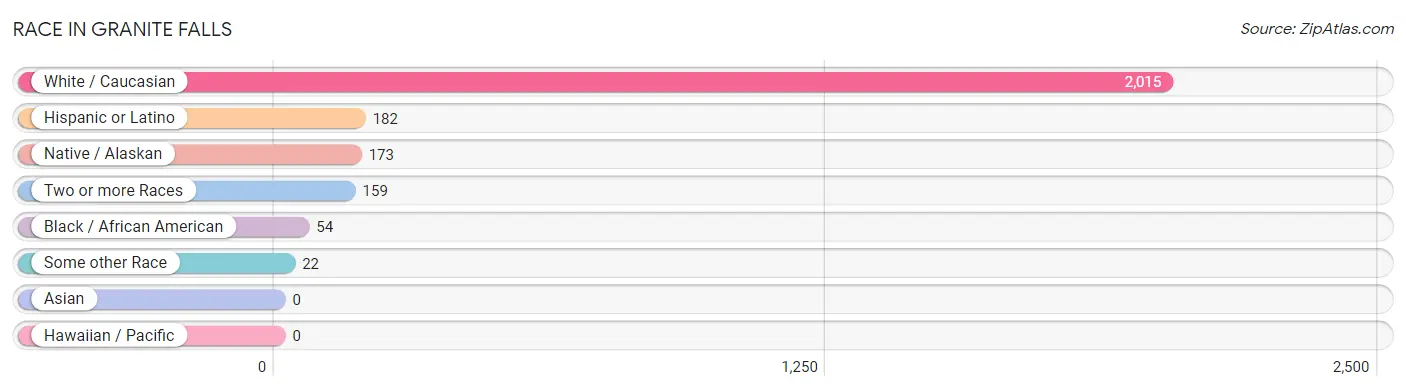
| Race | # Population | % Population |
| Asian | 0 | 0.0% |
| Black / African American | 54 | 2.2% |
| Hawaiian / Pacific | 0 | 0.0% |
| Hispanic or Latino | 182 | 7.5% |
| Native / Alaskan | 173 | 7.1% |
| White / Caucasian | 2,015 | 83.2% |
| Two or more Races | 159 | 6.6% |
| Some other Race | 22 | 0.9% |
| Total | 2,423 | 100.0% |
Ancestry in Granite Falls
The most populous ancestries reported in Granite Falls are German (794 | 32.8%), Norwegian (704 | 29.0%), Mexican (160 | 6.6%), English (131 | 5.4%), and Irish (128 | 5.3%), together accounting for 79.1% of all Granite Falls residents.
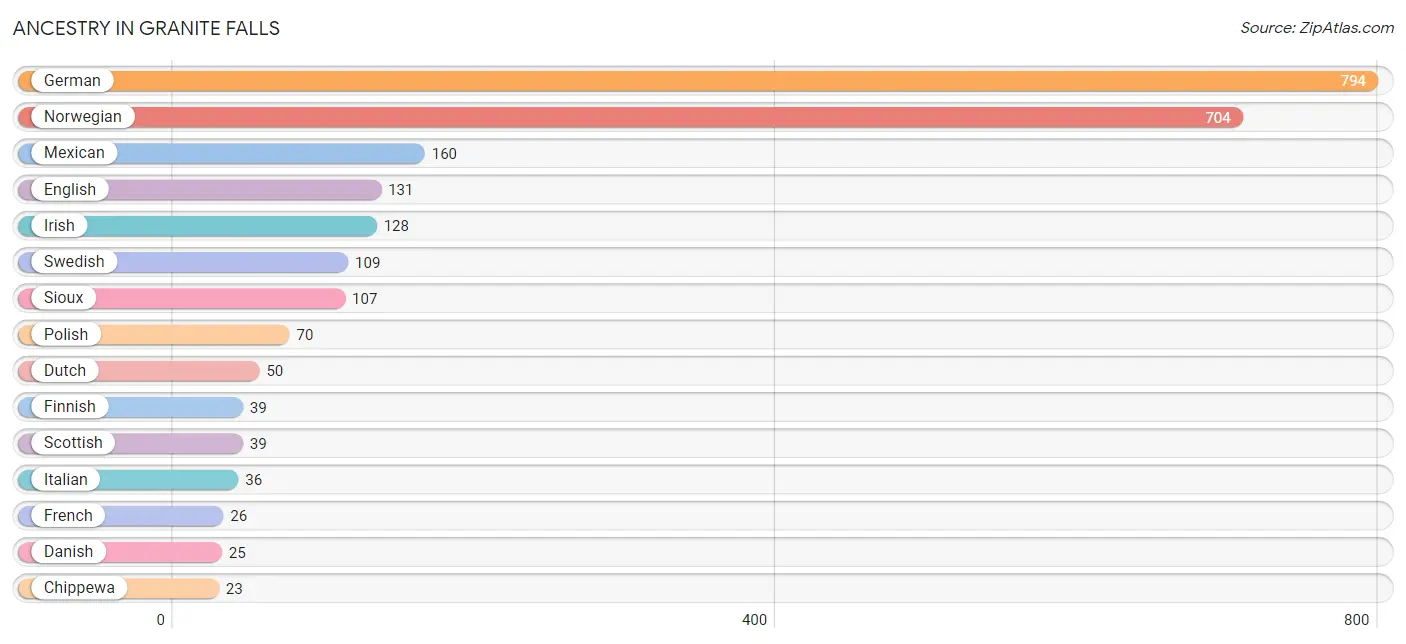
| Ancestry | # Population | % Population |
| American | 9 | 0.4% |
| Belgian | 11 | 0.4% |
| Central American | 8 | 0.3% |
| Cherokee | 15 | 0.6% |
| Chippewa | 23 | 0.9% |
| Czech | 2 | 0.1% |
| Danish | 25 | 1.0% |
| Dutch | 50 | 2.1% |
| English | 131 | 5.4% |
| Finnish | 39 | 1.6% |
| French | 26 | 1.1% |
| French Canadian | 4 | 0.2% |
| German | 794 | 32.8% |
| Guatemalan | 8 | 0.3% |
| Hungarian | 3 | 0.1% |
| Irish | 128 | 5.3% |
| Italian | 36 | 1.5% |
| Latvian | 19 | 0.8% |
| Mexican | 160 | 6.6% |
| Norwegian | 704 | 29.0% |
| Polish | 70 | 2.9% |
| Russian | 2 | 0.1% |
| Scandinavian | 16 | 0.7% |
| Scotch-Irish | 8 | 0.3% |
| Scottish | 39 | 1.6% |
| Sioux | 107 | 4.4% |
| South American | 14 | 0.6% |
| Swedish | 109 | 4.5% |
| Swiss | 12 | 0.5% |
| Venezuelan | 14 | 0.6% |
| Welsh | 10 | 0.4% | View All 31 Rows |
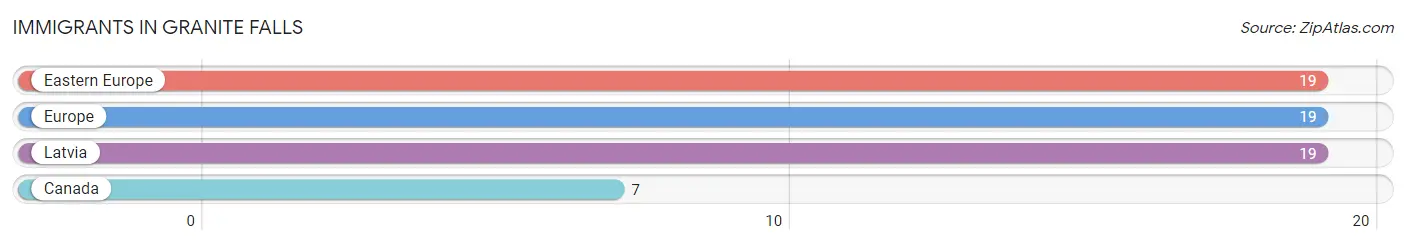
Immigrants in Granite Falls
The most numerous immigrant groups reported in Granite Falls came from Eastern Europe (19 | 0.8%), Europe (19 | 0.8%), Latvia (19 | 0.8%), and Canada (7 | 0.3%), together accounting for 2.6% of all Granite Falls residents.
| Immigration Origin | # Population | % Population |
| Canada | 7 | 0.3% |
| Eastern Europe | 19 | 0.8% |
| Europe | 19 | 0.8% |
| Latvia | 19 | 0.8% | View All 4 Rows |
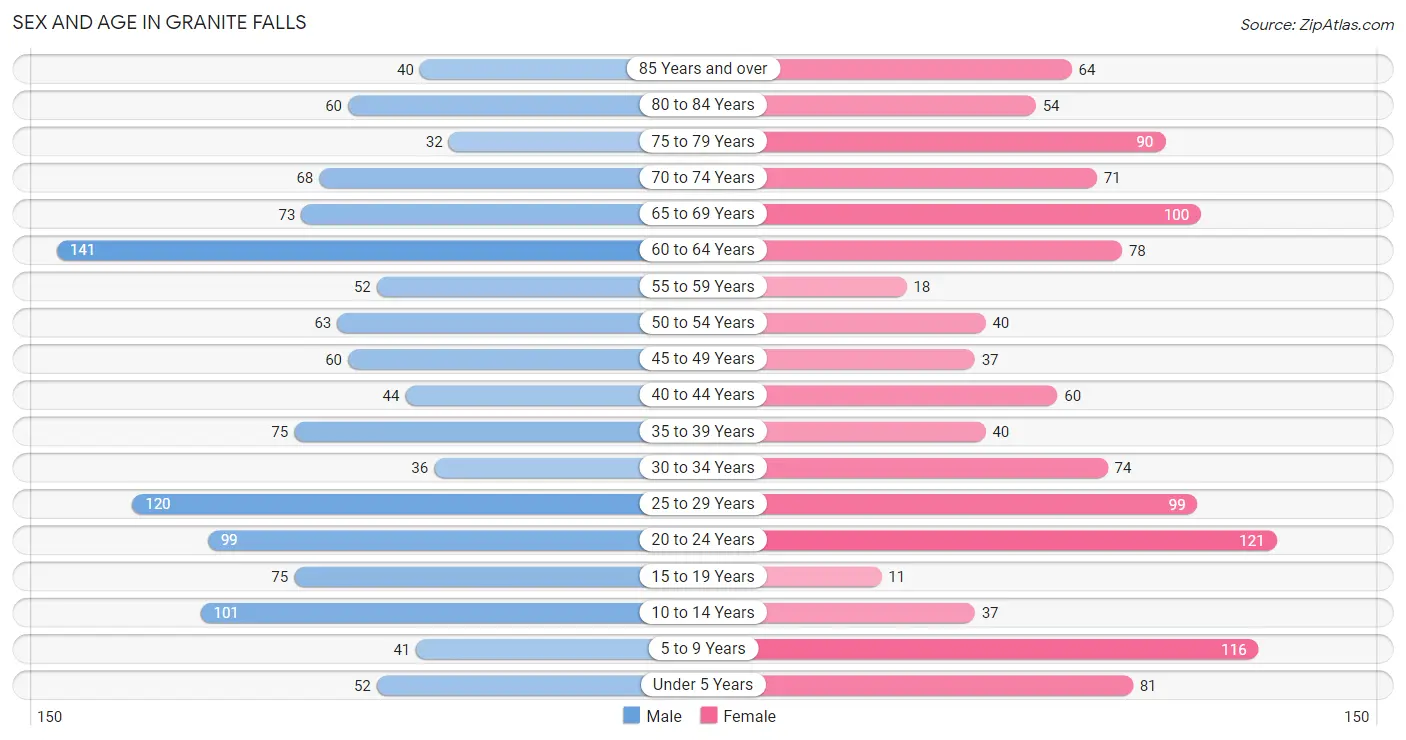
Sex and Age in Granite Falls
Sex and Age in Granite Falls
The most populous age groups in Granite Falls are 60 to 64 Years (141 | 11.4%) for men and 20 to 24 Years (121 | 10.2%) for women.
| Age Bracket | Male | Female |
| Under 5 Years | 52 (4.2%) | 81 (6.8%) |
| 5 to 9 Years | 41 (3.3%) | 116 (9.7%) |
| 10 to 14 Years | 101 (8.2%) | 37 (3.1%) |
| 15 to 19 Years | 75 (6.1%) | 11 (0.9%) |
| 20 to 24 Years | 99 (8.0%) | 121 (10.2%) |
| 25 to 29 Years | 120 (9.7%) | 99 (8.3%) |
| 30 to 34 Years | 36 (2.9%) | 74 (6.2%) |
| 35 to 39 Years | 75 (6.1%) | 40 (3.4%) |
| 40 to 44 Years | 44 (3.6%) | 60 (5.0%) |
| 45 to 49 Years | 60 (4.9%) | 37 (3.1%) |
| 50 to 54 Years | 63 (5.1%) | 40 (3.4%) |
| 55 to 59 Years | 52 (4.2%) | 18 (1.5%) |
| 60 to 64 Years | 141 (11.4%) | 78 (6.6%) |
| 65 to 69 Years | 73 (5.9%) | 100 (8.4%) |
| 70 to 74 Years | 68 (5.5%) | 71 (6.0%) |
| 75 to 79 Years | 32 (2.6%) | 90 (7.6%) |
| 80 to 84 Years | 60 (4.9%) | 54 (4.5%) |
| 85 Years and over | 40 (3.3%) | 64 (5.4%) |
| Total | 1,232 (100.0%) | 1,191 (100.0%) |
Families and Households in Granite Falls
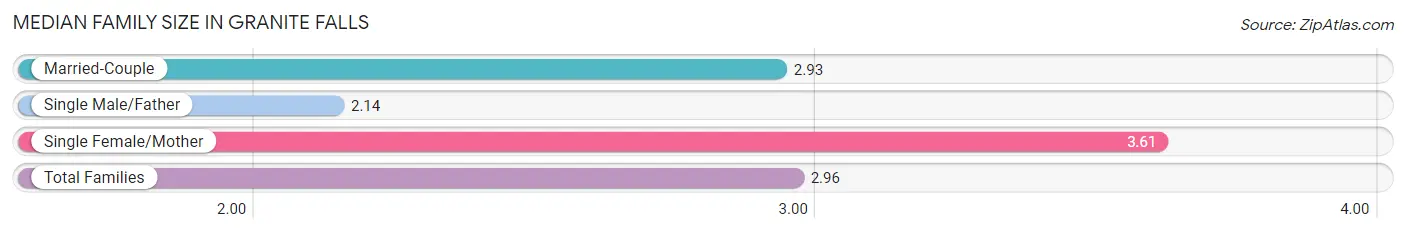
Median Family Size in Granite Falls
The median family size in Granite Falls is 2.96 persons per family, with single female/mother families (71 | 13.2%) accounting for the largest median family size of 3.61 persons per family. On the other hand, single male/father families (35 | 6.5%) represent the smallest median family size with 2.14 persons per family.
| Family Type | # Families | Family Size |
| Married-Couple | 432 (80.3%) | 2.93 |
| Single Male/Father | 35 (6.5%) | 2.14 |
| Single Female/Mother | 71 (13.2%) | 3.61 |
| Total Families | 538 (100.0%) | 2.96 |
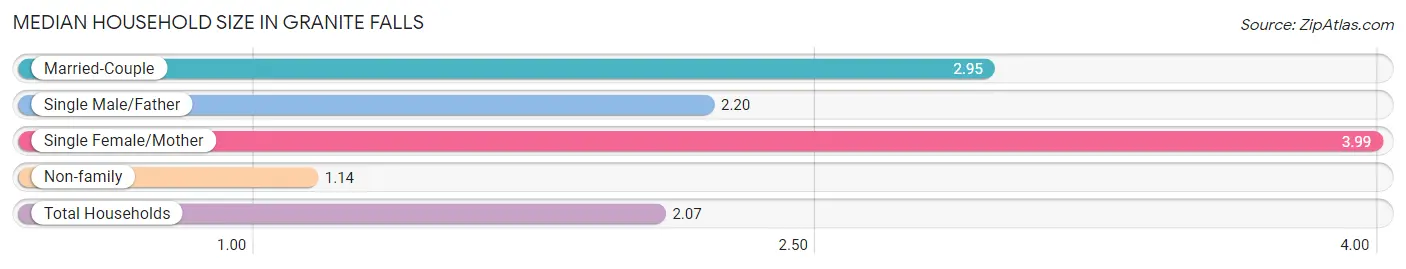
Median Household Size in Granite Falls
The median household size in Granite Falls is 2.07 persons per household, with single female/mother households (71 | 6.4%) accounting for the largest median household size of 3.99 persons per household. non-family households (566 | 51.3%) represent the smallest median household size with 1.14 persons per household.
| Household Type | # Households | Household Size |
| Married-Couple | 432 (39.1%) | 2.95 |
| Single Male/Father | 35 (3.2%) | 2.20 |
| Single Female/Mother | 71 (6.4%) | 3.99 |
| Non-family | 566 (51.3%) | 1.14 |
| Total Households | 1,104 (100.0%) | 2.07 |
Household Size by Marriage Status in Granite Falls
Out of a total of 1,104 households in Granite Falls, 538 (48.7%) are family households, while 566 (51.3%) are nonfamily households. The most numerous type of family households are 2-person households, comprising 272, and the most common type of nonfamily households are 1-person households, comprising 473.
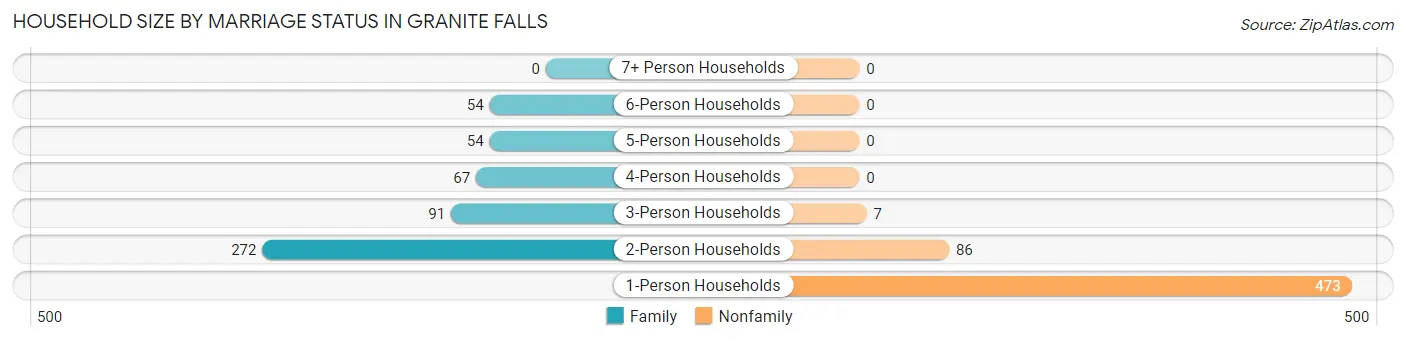
| Household Size | Family Households | Nonfamily Households |
| 1-Person Households | - | 473 (42.8%) |
| 2-Person Households | 272 (24.6%) | 86 (7.8%) |
| 3-Person Households | 91 (8.2%) | 7 (0.6%) |
| 4-Person Households | 67 (6.1%) | 0 (0.0%) |
| 5-Person Households | 54 (4.9%) | 0 (0.0%) |
| 6-Person Households | 54 (4.9%) | 0 (0.0%) |
| 7+ Person Households | 0 (0.0%) | 0 (0.0%) |
| Total | 538 (48.7%) | 566 (51.3%) |
Female Fertility in Granite Falls
Fertility by Age in Granite Falls
Average fertility rate in Granite Falls is 106.0 births per 1,000 women. Women in the age bracket of 35 to 50 years have the highest fertility rate with 124.0 births per 1,000 women. Women in the age bracket of 20 to 34 years acount for 63.8% of all women with births.
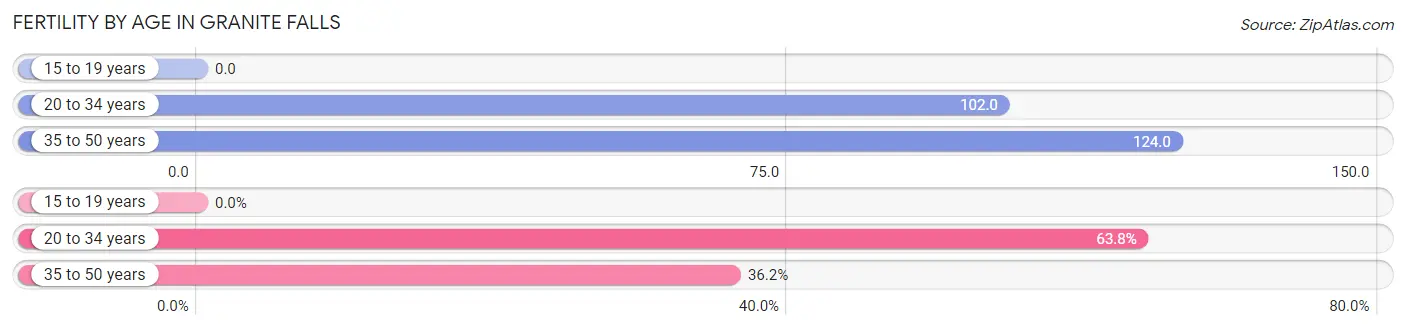
| Age Bracket | Women with Births | Births / 1,000 Women |
| 15 to 19 years | 0 (0.0%) | 0.0 |
| 20 to 34 years | 30 (63.8%) | 102.0 |
| 35 to 50 years | 17 (36.2%) | 124.0 |
| Total | 47 (100.0%) | 106.0 |
Fertility by Age by Marriage Status in Granite Falls
95.7% of women with births (47) in Granite Falls are married. The highest percentage of unmarried women with births falls into 20 to 34 years age bracket with 6.7% of them unmarried at the time of birth, while the lowest percentage of unmarried women with births belong to 35 to 50 years age bracket with 0.0% of them unmarried.
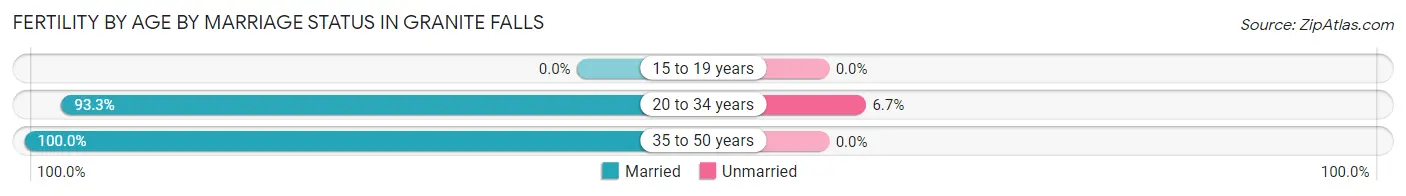
| Age Bracket | Married | Unmarried |
| 15 to 19 years | 0 (0.0%) | 0 (0.0%) |
| 20 to 34 years | 28 (93.3%) | 2 (6.7%) |
| 35 to 50 years | 17 (100.0%) | 0 (0.0%) |
| Total | 45 (95.7%) | 2 (4.3%) |
Fertility by Education in Granite Falls
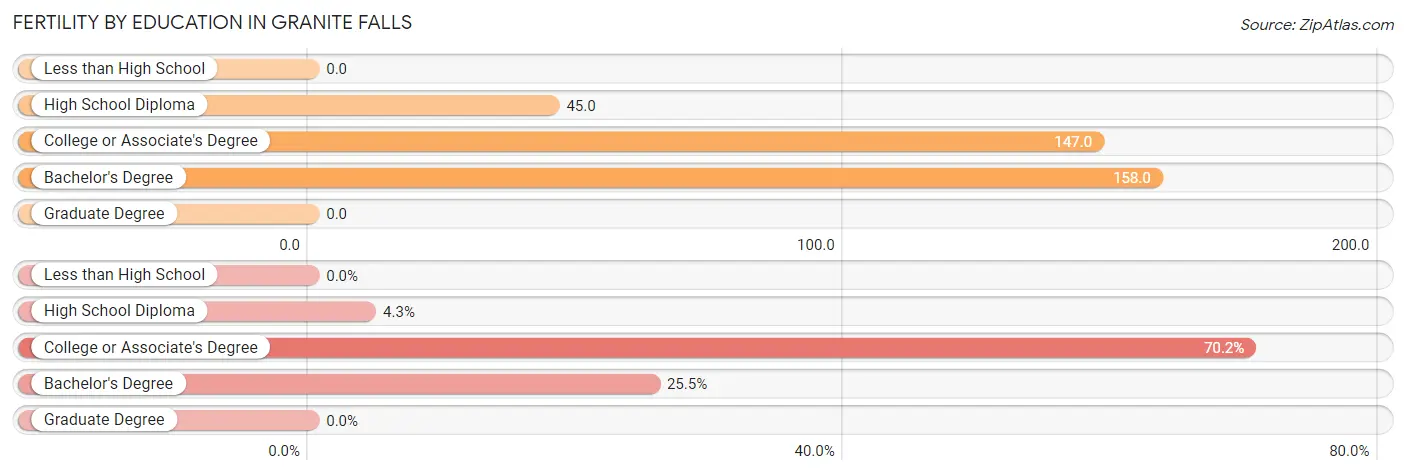
| Educational Attainment | Women with Births | Births / 1,000 Women |
| Less than High School | 0 (0.0%) | 0.0 |
| High School Diploma | 2 (4.3%) | 45.0 |
| College or Associate's Degree | 33 (70.2%) | 147.0 |
| Bachelor's Degree | 12 (25.5%) | 158.0 |
| Graduate Degree | 0 (0.0%) | 0.0 |
| Total | 47 (100.0%) | 106.0 |
Fertility by Education by Marriage Status in Granite Falls
4.3% of women with births in Granite Falls are unmarried. Women with the educational attainment of college or associate's degree are most likely to be married with 100.0% of them married at childbirth, while women with the educational attainment of high school diploma are least likely to be married with 100.0% of them unmarried at childbirth.
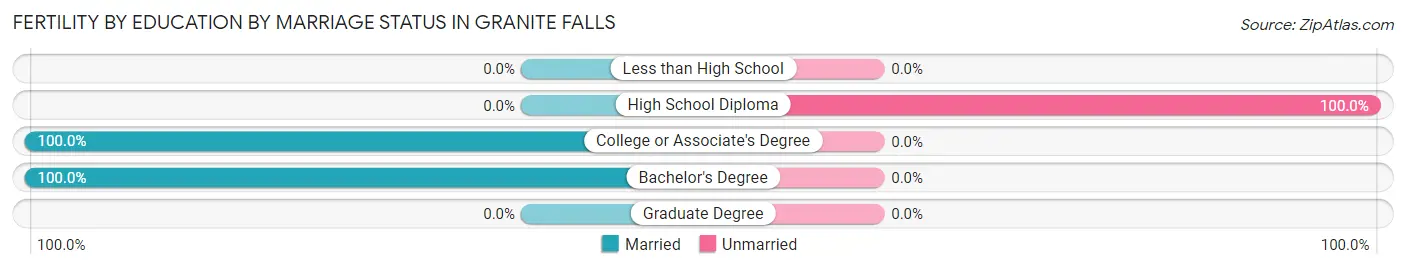
| Educational Attainment | Married | Unmarried |
| Less than High School | 0 (0.0%) | 0 (0.0%) |
| High School Diploma | 0 (0.0%) | 2 (100.0%) |
| College or Associate's Degree | 33 (100.0%) | 0 (0.0%) |
| Bachelor's Degree | 12 (100.0%) | 0 (0.0%) |
| Graduate Degree | 0 (0.0%) | 0 (0.0%) |
| Total | 45 (95.7%) | 2 (4.3%) |
Employment Characteristics in Granite Falls
Employment by Class of Employer in Granite Falls
Among the 1,105 employed individuals in Granite Falls, private company employees (716 | 64.8%), not-for-profit organizations (136 | 12.3%), and local government employees (92 | 8.3%) make up the most common classes of employment.
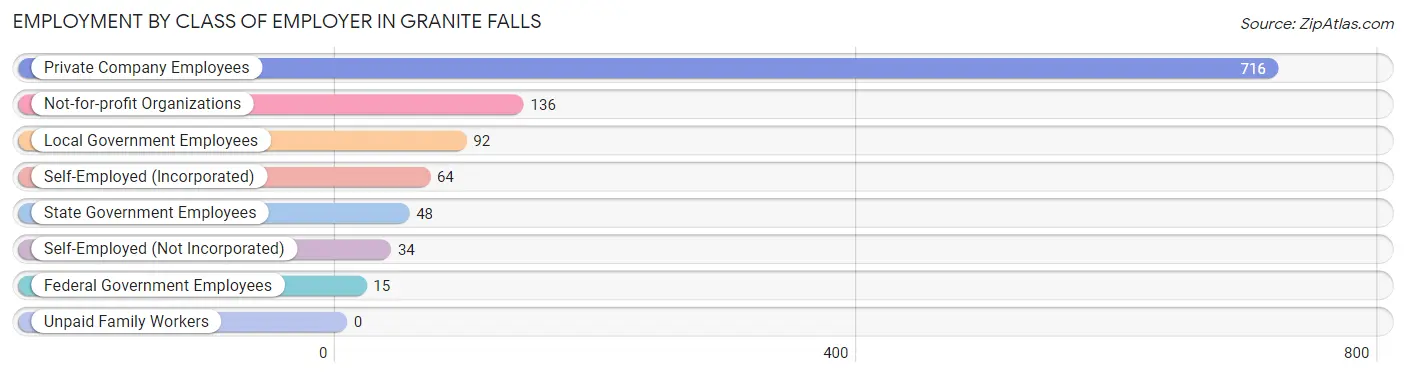
| Employer Class | # Employees | % Employees |
| Private Company Employees | 716 | 64.8% |
| Self-Employed (Incorporated) | 64 | 5.8% |
| Self-Employed (Not Incorporated) | 34 | 3.1% |
| Not-for-profit Organizations | 136 | 12.3% |
| Local Government Employees | 92 | 8.3% |
| State Government Employees | 48 | 4.3% |
| Federal Government Employees | 15 | 1.4% |
| Unpaid Family Workers | 0 | 0.0% |
| Total | 1,105 | 100.0% |
Employment Status by Age in Granite Falls
According to the labor force statistics for Granite Falls, out of the total population over 16 years of age (1,962), 60.1% or 1,179 individuals are in the labor force, with 2.6% or 31 of them unemployed. The age group with the highest labor force participation rate is 20 to 24 years, with 98.2% or 216 individuals in the labor force. Within the labor force, the 45 to 54 years age range has the highest percentage of unemployed individuals, with 14.9% or 26 of them being unemployed.
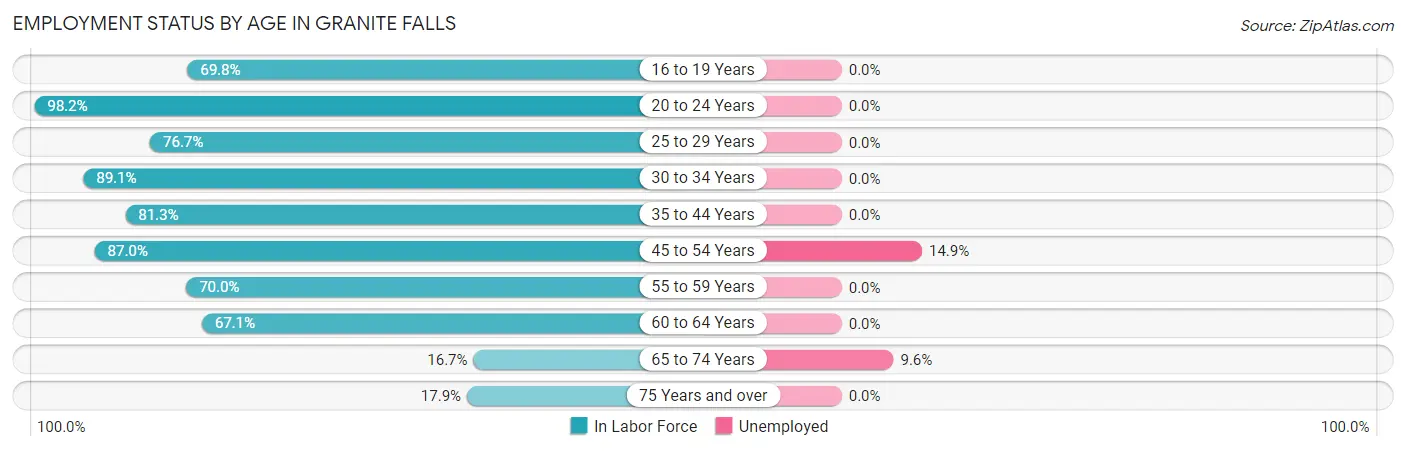
| Age Bracket | In Labor Force | Unemployed |
| 16 to 19 Years | 37 (69.8%) | 0 (0.0%) |
| 20 to 24 Years | 216 (98.2%) | 0 (0.0%) |
| 25 to 29 Years | 168 (76.7%) | 0 (0.0%) |
| 30 to 34 Years | 98 (89.1%) | 0 (0.0%) |
| 35 to 44 Years | 178 (81.3%) | 0 (0.0%) |
| 45 to 54 Years | 174 (87.0%) | 26 (14.9%) |
| 55 to 59 Years | 49 (70.0%) | 0 (0.0%) |
| 60 to 64 Years | 147 (67.1%) | 0 (0.0%) |
| 65 to 74 Years | 52 (16.7%) | 5 (9.6%) |
| 75 Years and over | 61 (17.9%) | 0 (0.0%) |
| Total | 1,179 (60.1%) | 31 (2.6%) |
Employment Status by Educational Attainment in Granite Falls
According to labor force statistics for Granite Falls, 78.5% of individuals (814) out of the total population between 25 and 64 years of age (1,037) are in the labor force, with 3.2% or 26 of them being unemployed. The group with the highest labor force participation rate are those with the educational attainment of bachelor's degree or higher, with 90.3% or 269 individuals in the labor force. Within the labor force, individuals with bachelor's degree or higher education have the highest percentage of unemployment, with 9.7% or 26 of them being unemployed.
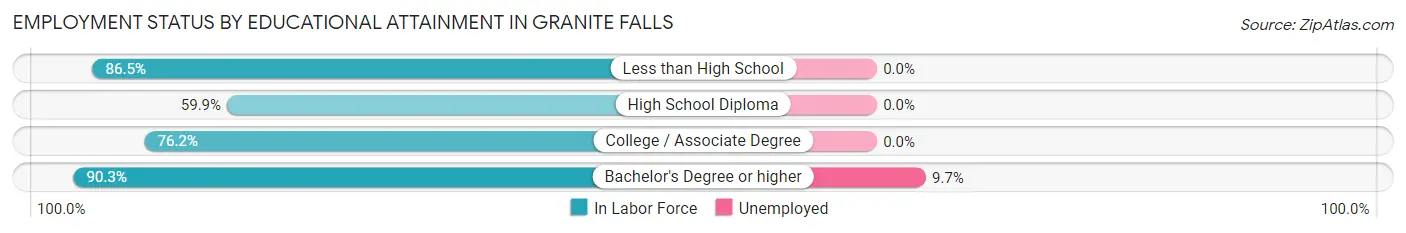
| Educational Attainment | In Labor Force | Unemployed |
| Less than High School | 90 (86.5%) | 0 (0.0%) |
| High School Diploma | 106 (59.9%) | 0 (0.0%) |
| College / Associate Degree | 349 (76.2%) | 0 (0.0%) |
| Bachelor's Degree or higher | 269 (90.3%) | 29 (9.7%) |
| Total | 814 (78.5%) | 33 (3.2%) |
Employment Occupations by Sex in Granite Falls
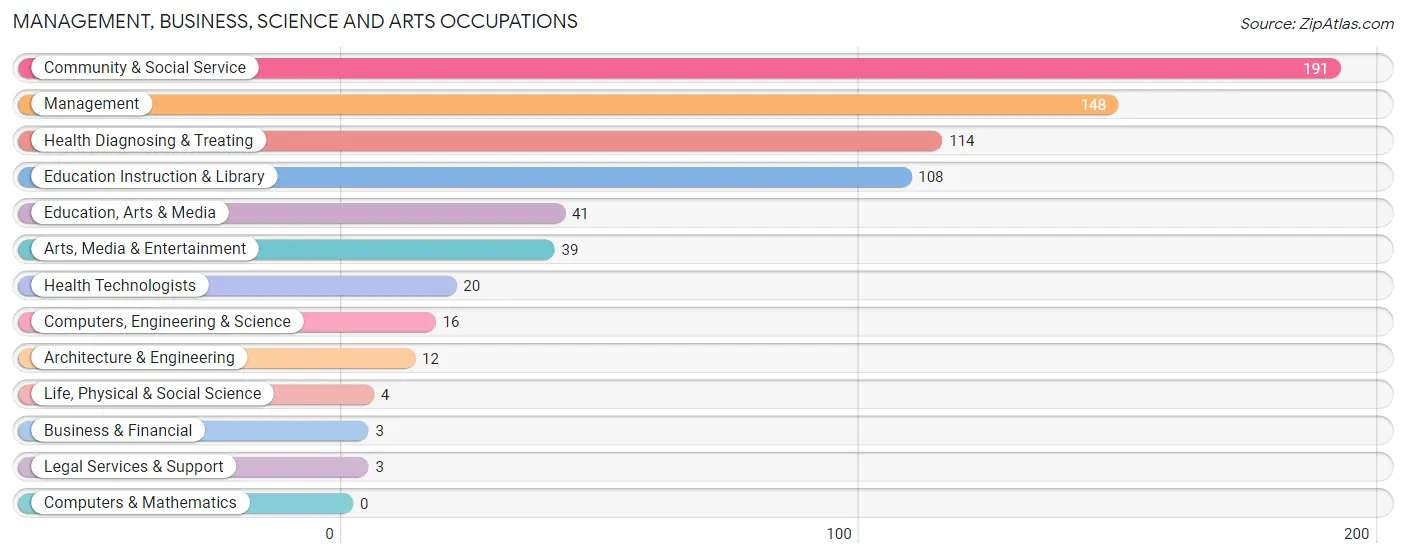
Management, Business, Science and Arts Occupations
The most common Management, Business, Science and Arts occupations in Granite Falls are Community & Social Service (191 | 16.6%), Management (148 | 12.9%), Health Diagnosing & Treating (114 | 9.9%), Education Instruction & Library (108 | 9.4%), and Education, Arts & Media (41 | 3.6%).
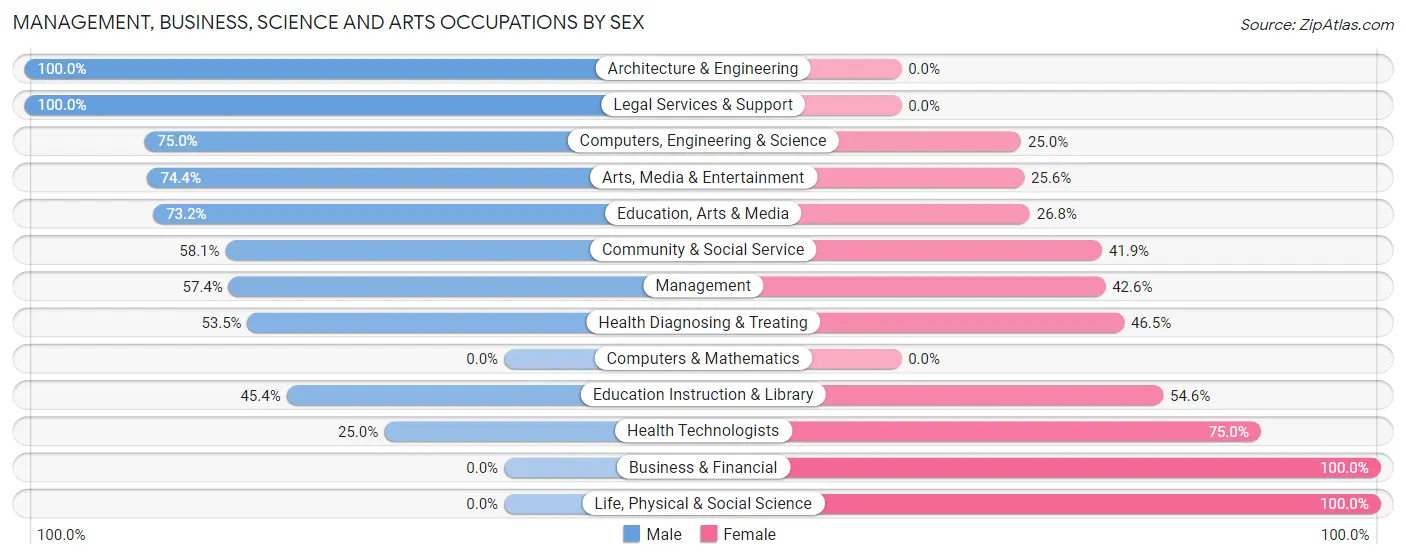
Management, Business, Science and Arts Occupations by Sex
Within the Management, Business, Science and Arts occupations in Granite Falls, the most male-oriented occupations are Architecture & Engineering (100.0%), Legal Services & Support (100.0%), and Computers, Engineering & Science (75.0%), while the most female-oriented occupations are Business & Financial (100.0%), Life, Physical & Social Science (100.0%), and Health Technologists (75.0%).
| Occupation | Male | Female |
| Management | 85 (57.4%) | 63 (42.6%) |
| Business & Financial | 0 (0.0%) | 3 (100.0%) |
| Computers, Engineering & Science | 12 (75.0%) | 4 (25.0%) |
| Computers & Mathematics | 0 (0.0%) | 0 (0.0%) |
| Architecture & Engineering | 12 (100.0%) | 0 (0.0%) |
| Life, Physical & Social Science | 0 (0.0%) | 4 (100.0%) |
| Community & Social Service | 111 (58.1%) | 80 (41.9%) |
| Education, Arts & Media | 30 (73.2%) | 11 (26.8%) |
| Legal Services & Support | 3 (100.0%) | 0 (0.0%) |
| Education Instruction & Library | 49 (45.4%) | 59 (54.6%) |
| Arts, Media & Entertainment | 29 (74.4%) | 10 (25.6%) |
| Health Diagnosing & Treating | 61 (53.5%) | 53 (46.5%) |
| Health Technologists | 5 (25.0%) | 15 (75.0%) |
| Total (Category) | 269 (57.0%) | 203 (43.0%) |
| Total (Overall) | 623 (54.2%) | 526 (45.8%) |
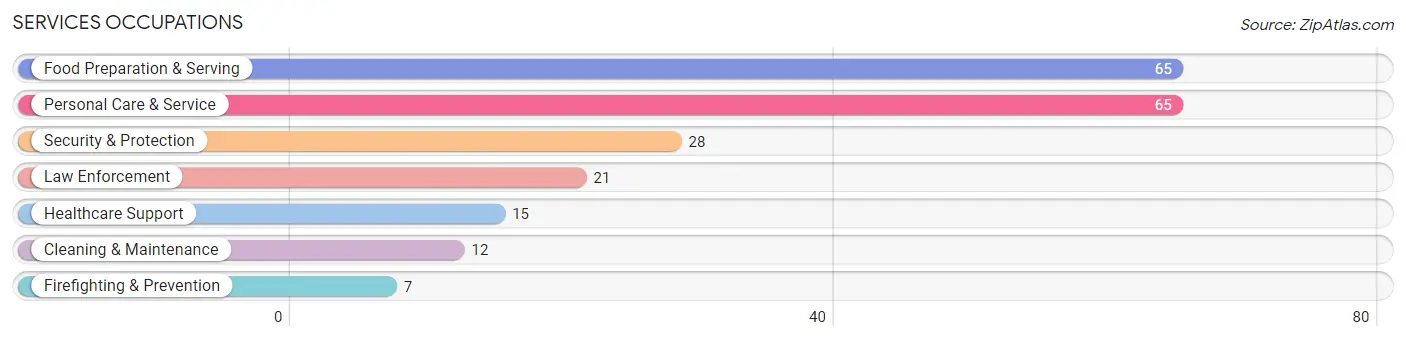
Services Occupations
The most common Services occupations in Granite Falls are Food Preparation & Serving (65 | 5.7%), Personal Care & Service (65 | 5.7%), Security & Protection (28 | 2.4%), Law Enforcement (21 | 1.8%), and Healthcare Support (15 | 1.3%).
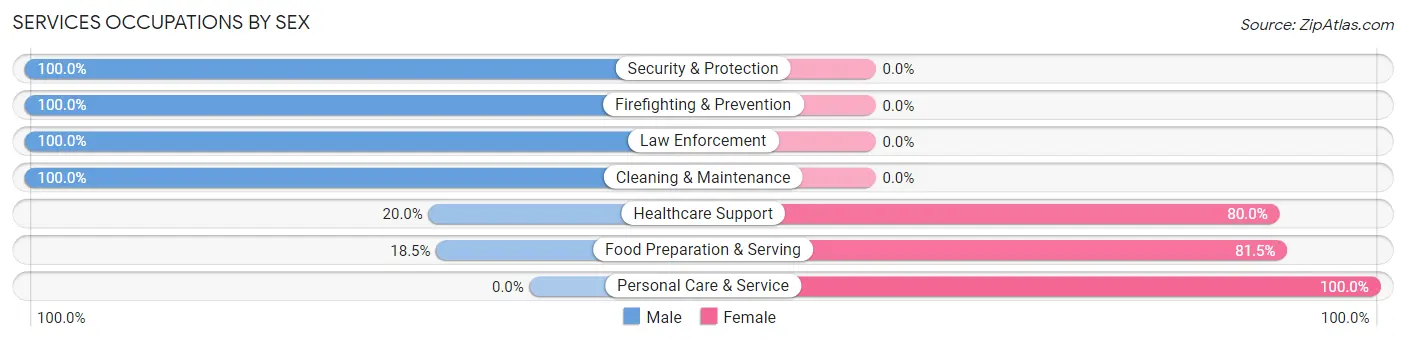
Services Occupations by Sex
Within the Services occupations in Granite Falls, the most male-oriented occupations are Security & Protection (100.0%), Firefighting & Prevention (100.0%), and Law Enforcement (100.0%), while the most female-oriented occupations are Personal Care & Service (100.0%), Food Preparation & Serving (81.5%), and Healthcare Support (80.0%).
| Occupation | Male | Female |
| Healthcare Support | 3 (20.0%) | 12 (80.0%) |
| Security & Protection | 28 (100.0%) | 0 (0.0%) |
| Firefighting & Prevention | 7 (100.0%) | 0 (0.0%) |
| Law Enforcement | 21 (100.0%) | 0 (0.0%) |
| Food Preparation & Serving | 12 (18.5%) | 53 (81.5%) |
| Cleaning & Maintenance | 12 (100.0%) | 0 (0.0%) |
| Personal Care & Service | 0 (0.0%) | 65 (100.0%) |
| Total (Category) | 55 (29.7%) | 130 (70.3%) |
| Total (Overall) | 623 (54.2%) | 526 (45.8%) |
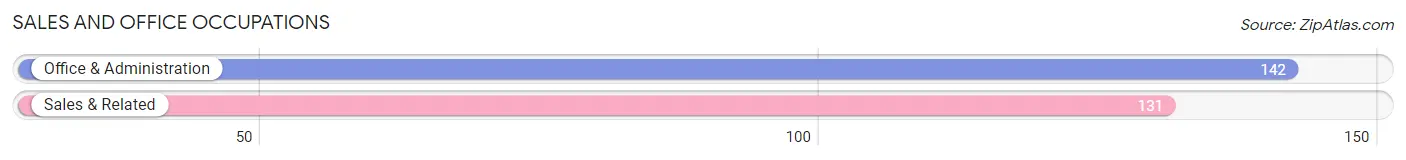
Sales and Office Occupations
The most common Sales and Office occupations in Granite Falls are Office & Administration (142 | 12.4%), and Sales & Related (131 | 11.4%).
Sales and Office Occupations by Sex
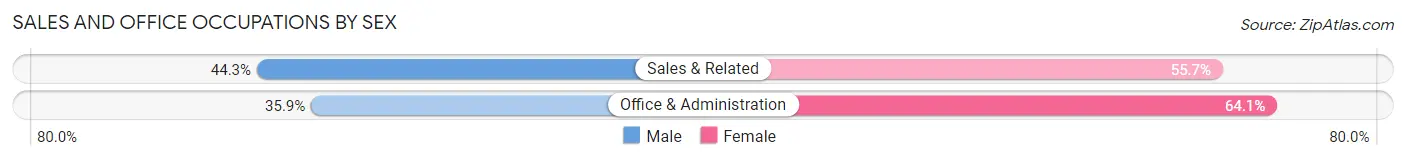
| Occupation | Male | Female |
| Sales & Related | 58 (44.3%) | 73 (55.7%) |
| Office & Administration | 51 (35.9%) | 91 (64.1%) |
| Total (Category) | 109 (39.9%) | 164 (60.1%) |
| Total (Overall) | 623 (54.2%) | 526 (45.8%) |
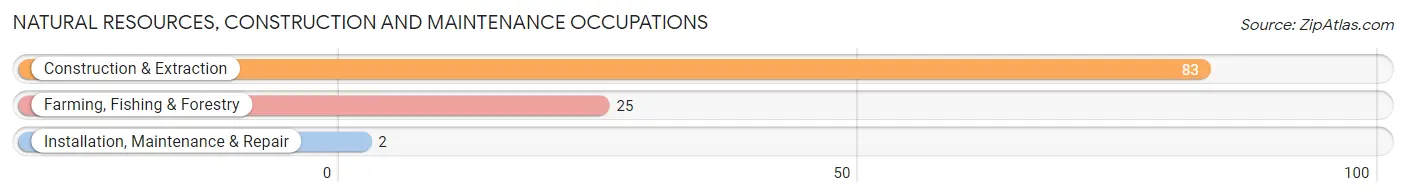
Natural Resources, Construction and Maintenance Occupations
The most common Natural Resources, Construction and Maintenance occupations in Granite Falls are Construction & Extraction (83 | 7.2%), Farming, Fishing & Forestry (25 | 2.2%), and Installation, Maintenance & Repair (2 | 0.2%).
Natural Resources, Construction and Maintenance Occupations by Sex
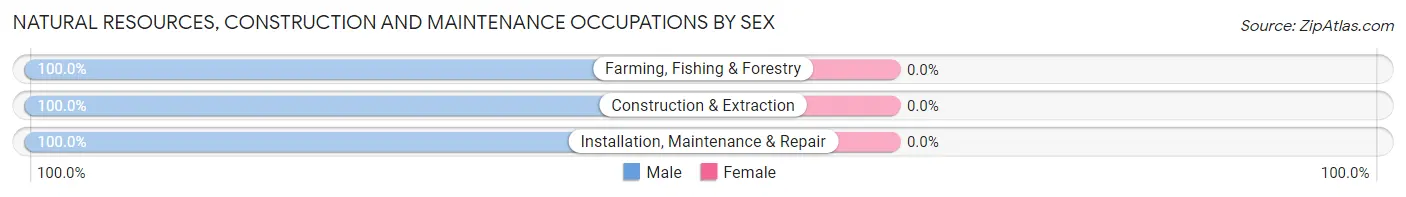
| Occupation | Male | Female |
| Farming, Fishing & Forestry | 25 (100.0%) | 0 (0.0%) |
| Construction & Extraction | 83 (100.0%) | 0 (0.0%) |
| Installation, Maintenance & Repair | 2 (100.0%) | 0 (0.0%) |
| Total (Category) | 110 (100.0%) | 0 (0.0%) |
| Total (Overall) | 623 (54.2%) | 526 (45.8%) |
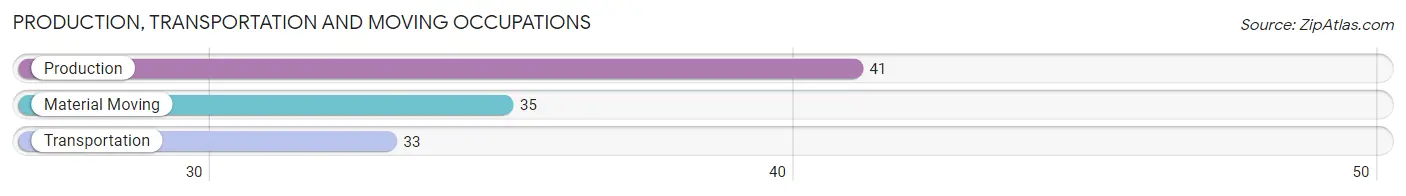
Production, Transportation and Moving Occupations
The most common Production, Transportation and Moving occupations in Granite Falls are Production (41 | 3.6%), Material Moving (35 | 3.0%), and Transportation (33 | 2.9%).
Production, Transportation and Moving Occupations by Sex
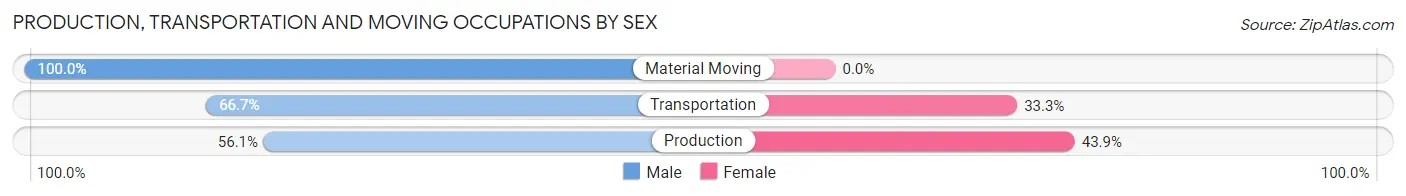
| Occupation | Male | Female |
| Production | 23 (56.1%) | 18 (43.9%) |
| Transportation | 22 (66.7%) | 11 (33.3%) |
| Material Moving | 35 (100.0%) | 0 (0.0%) |
| Total (Category) | 80 (73.4%) | 29 (26.6%) |
| Total (Overall) | 623 (54.2%) | 526 (45.8%) |
Employment Industries by Sex in Granite Falls
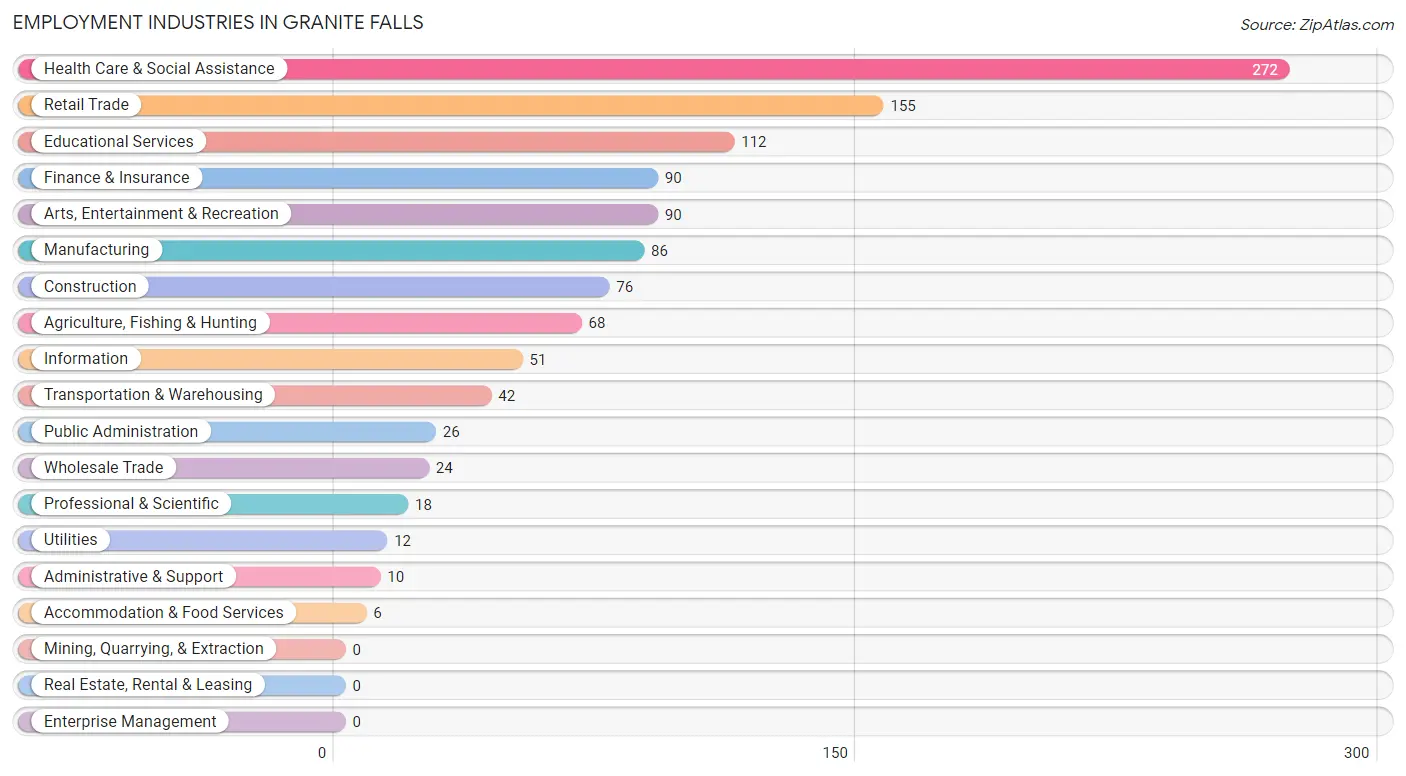
Employment Industries in Granite Falls
The major employment industries in Granite Falls include Health Care & Social Assistance (272 | 23.7%), Retail Trade (155 | 13.5%), Educational Services (112 | 9.8%), Finance & Insurance (90 | 7.8%), and Arts, Entertainment & Recreation (90 | 7.8%).
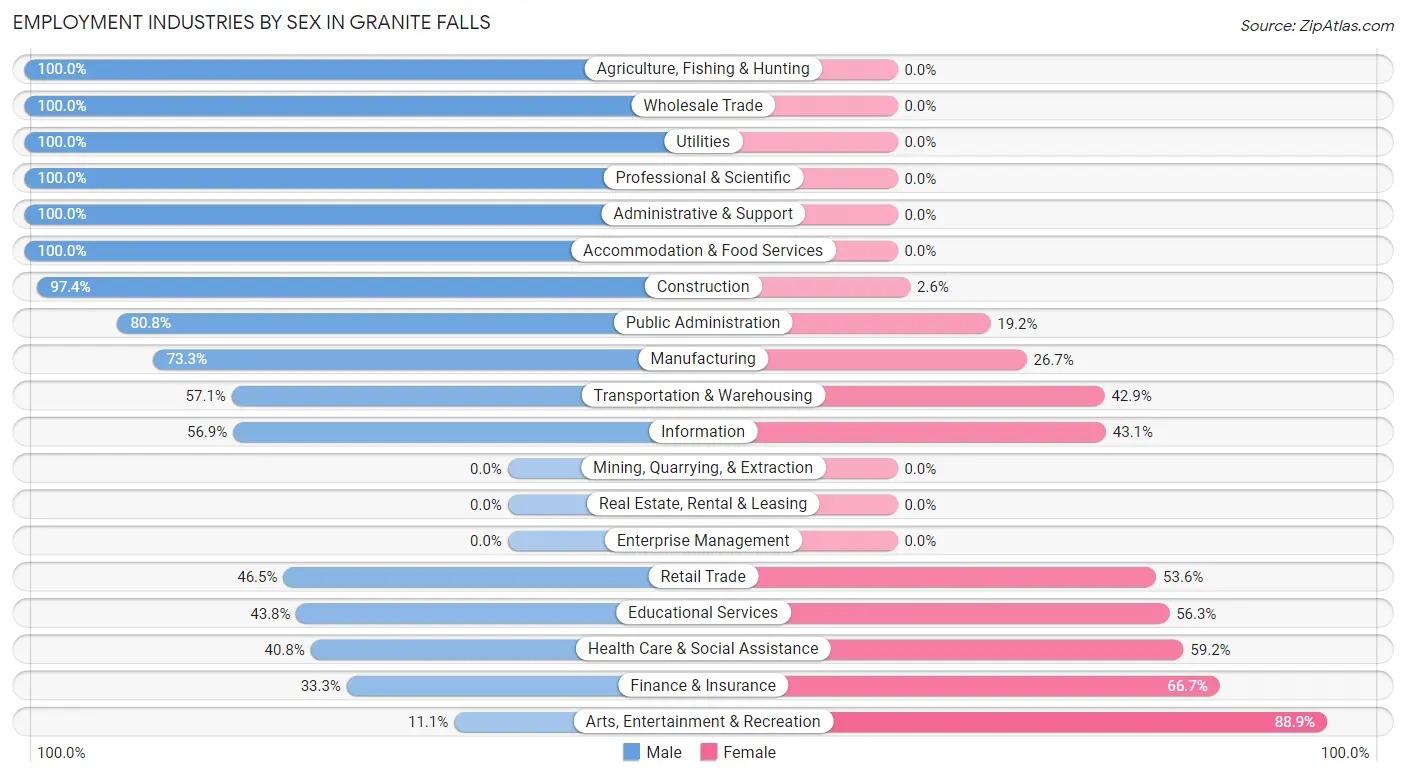
Employment Industries by Sex in Granite Falls
The Granite Falls industries that see more men than women are Agriculture, Fishing & Hunting (100.0%), Wholesale Trade (100.0%), and Utilities (100.0%), whereas the industries that tend to have a higher number of women are Arts, Entertainment & Recreation (88.9%), Finance & Insurance (66.7%), and Health Care & Social Assistance (59.2%).
| Industry | Male | Female |
| Agriculture, Fishing & Hunting | 68 (100.0%) | 0 (0.0%) |
| Mining, Quarrying, & Extraction | 0 (0.0%) | 0 (0.0%) |
| Construction | 74 (97.4%) | 2 (2.6%) |
| Manufacturing | 63 (73.3%) | 23 (26.7%) |
| Wholesale Trade | 24 (100.0%) | 0 (0.0%) |
| Retail Trade | 72 (46.5%) | 83 (53.5%) |
| Transportation & Warehousing | 24 (57.1%) | 18 (42.9%) |
| Utilities | 12 (100.0%) | 0 (0.0%) |
| Information | 29 (56.9%) | 22 (43.1%) |
| Finance & Insurance | 30 (33.3%) | 60 (66.7%) |
| Real Estate, Rental & Leasing | 0 (0.0%) | 0 (0.0%) |
| Professional & Scientific | 18 (100.0%) | 0 (0.0%) |
| Enterprise Management | 0 (0.0%) | 0 (0.0%) |
| Administrative & Support | 10 (100.0%) | 0 (0.0%) |
| Educational Services | 49 (43.8%) | 63 (56.2%) |
| Health Care & Social Assistance | 111 (40.8%) | 161 (59.2%) |
| Arts, Entertainment & Recreation | 10 (11.1%) | 80 (88.9%) |
| Accommodation & Food Services | 6 (100.0%) | 0 (0.0%) |
| Public Administration | 21 (80.8%) | 5 (19.2%) |
| Total | 623 (54.2%) | 526 (45.8%) |
Education in Granite Falls
School Enrollment in Granite Falls
The most common levels of schooling among the 486 students in Granite Falls are middle school (123 | 25.3%), college / undergraduate (93 | 19.1%), and elementary school (90 | 18.5%).
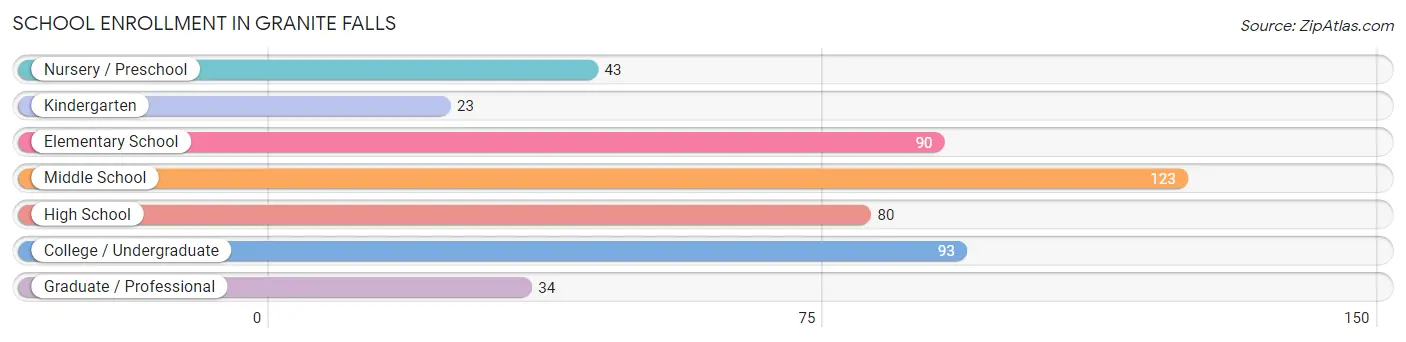
| School Level | # Students | % Students |
| Nursery / Preschool | 43 | 8.8% |
| Kindergarten | 23 | 4.7% |
| Elementary School | 90 | 18.5% |
| Middle School | 123 | 25.3% |
| High School | 80 | 16.5% |
| College / Undergraduate | 93 | 19.1% |
| Graduate / Professional | 34 | 7.0% |
| Total | 486 | 100.0% |
School Enrollment by Age by Funding Source in Granite Falls
Out of a total of 486 students who are enrolled in schools in Granite Falls, 15 (3.1%) attend a private institution, while the remaining 471 (96.9%) are enrolled in public schools. The age group of 35 years and over has the highest likelihood of being enrolled in private schools, with 6 (33.3% in the age bracket) enrolled. Conversely, the age group of 3 to 4 year olds has the lowest likelihood of being enrolled in a private school, with 15 (100.0% in the age bracket) attending a public institution.
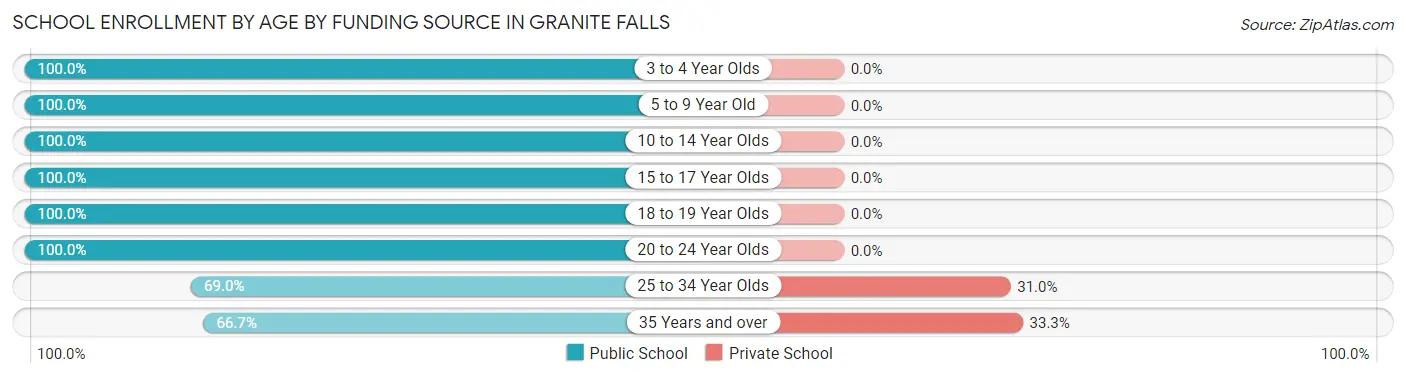
| Age Bracket | Public School | Private School |
| 3 to 4 Year Olds | 15 (100.0%) | 0 (0.0%) |
| 5 to 9 Year Old | 135 (100.0%) | 0 (0.0%) |
| 10 to 14 Year Olds | 138 (100.0%) | 0 (0.0%) |
| 15 to 17 Year Olds | 59 (100.0%) | 0 (0.0%) |
| 18 to 19 Year Olds | 12 (100.0%) | 0 (0.0%) |
| 20 to 24 Year Olds | 80 (100.0%) | 0 (0.0%) |
| 25 to 34 Year Olds | 20 (69.0%) | 9 (31.0%) |
| 35 Years and over | 12 (66.7%) | 6 (33.3%) |
| Total | 471 (96.9%) | 15 (3.1%) |
Educational Attainment by Field of Study in Granite Falls
Education (135 | 28.6%), business (73 | 15.5%), science & technology (72 | 15.2%), arts & humanities (45 | 9.5%), and bio, nature & agricultural (44 | 9.3%) are the most common fields of study among 472 individuals in Granite Falls who have obtained a bachelor's degree or higher.
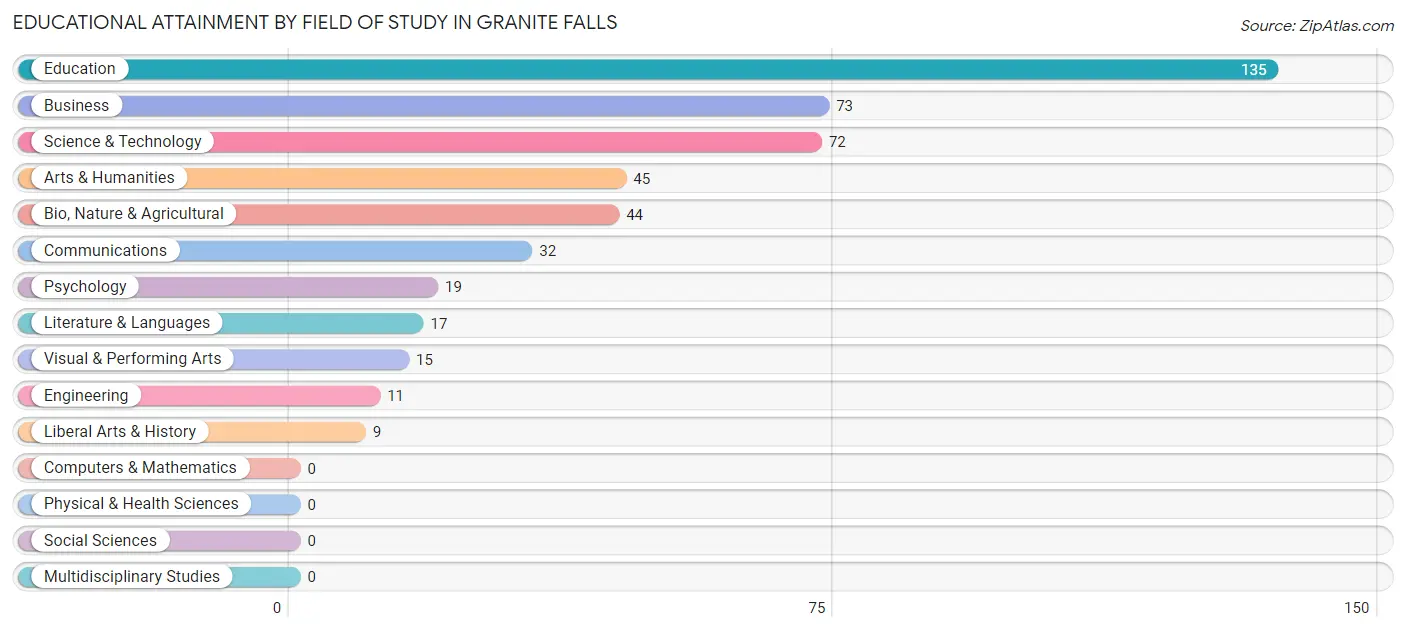
| Field of Study | # Graduates | % Graduates |
| Computers & Mathematics | 0 | 0.0% |
| Bio, Nature & Agricultural | 44 | 9.3% |
| Physical & Health Sciences | 0 | 0.0% |
| Psychology | 19 | 4.0% |
| Social Sciences | 0 | 0.0% |
| Engineering | 11 | 2.3% |
| Multidisciplinary Studies | 0 | 0.0% |
| Science & Technology | 72 | 15.2% |
| Business | 73 | 15.5% |
| Education | 135 | 28.6% |
| Literature & Languages | 17 | 3.6% |
| Liberal Arts & History | 9 | 1.9% |
| Visual & Performing Arts | 15 | 3.2% |
| Communications | 32 | 6.8% |
| Arts & Humanities | 45 | 9.5% |
| Total | 472 | 100.0% |
Transportation & Commute in Granite Falls
Vehicle Availability by Sex in Granite Falls
The most prevalent vehicle ownership categories in Granite Falls are males with 2 vehicles (290, accounting for 47.6%) and females with 2 vehicles (167, making up 59.6%).
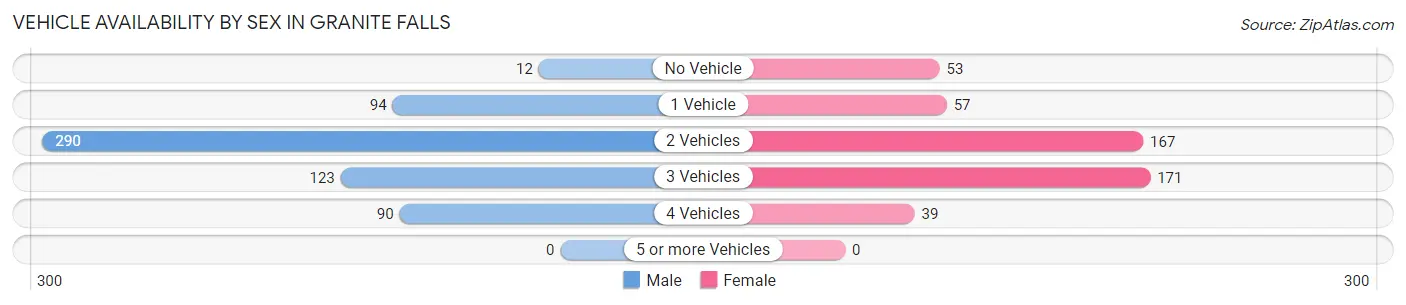
| Vehicles Available | Male | Female |
| No Vehicle | 12 (2.0%) | 53 (10.9%) |
| 1 Vehicle | 94 (15.4%) | 57 (11.7%) |
| 2 Vehicles | 290 (47.6%) | 167 (34.3%) |
| 3 Vehicles | 123 (20.2%) | 171 (35.1%) |
| 4 Vehicles | 90 (14.8%) | 39 (8.0%) |
| 5 or more Vehicles | 0 (0.0%) | 0 (0.0%) |
| Total | 609 (100.0%) | 487 (100.0%) |
Commute Time in Granite Falls
The most frequently occuring commute durations in Granite Falls are 5 to 9 minutes (227 commuters, 21.2%), 10 to 14 minutes (178 commuters, 16.6%), and 15 to 19 minutes (174 commuters, 16.2%).
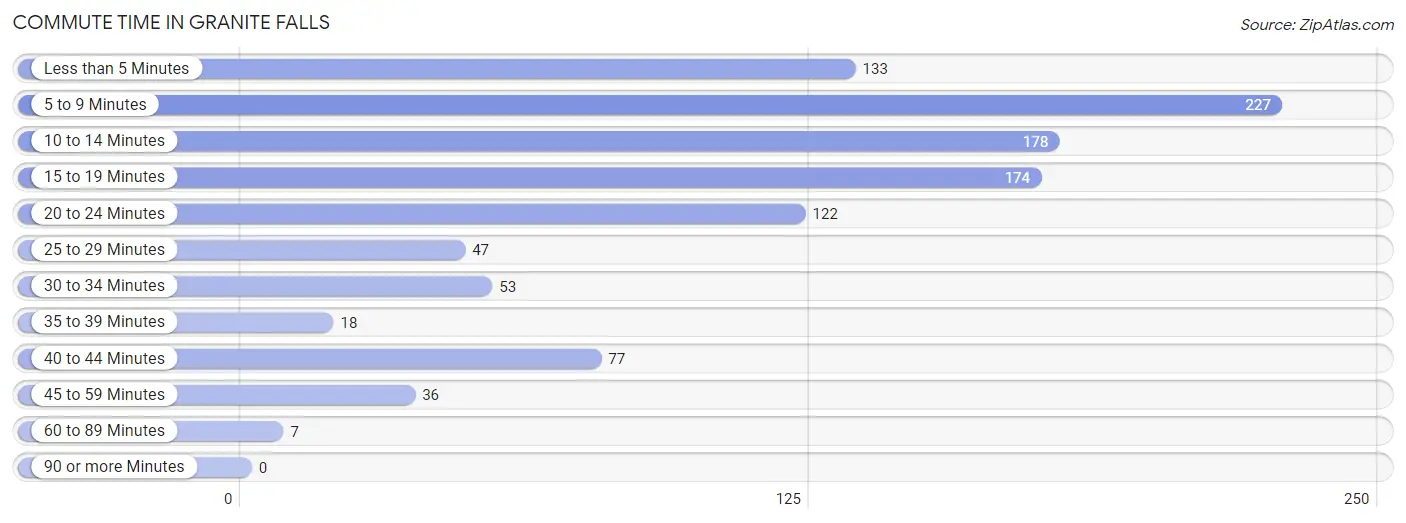
| Commute Time | # Commuters | % Commuters |
| Less than 5 Minutes | 133 | 12.4% |
| 5 to 9 Minutes | 227 | 21.2% |
| 10 to 14 Minutes | 178 | 16.6% |
| 15 to 19 Minutes | 174 | 16.2% |
| 20 to 24 Minutes | 122 | 11.4% |
| 25 to 29 Minutes | 47 | 4.4% |
| 30 to 34 Minutes | 53 | 4.9% |
| 35 to 39 Minutes | 18 | 1.7% |
| 40 to 44 Minutes | 77 | 7.2% |
| 45 to 59 Minutes | 36 | 3.4% |
| 60 to 89 Minutes | 7 | 0.6% |
| 90 or more Minutes | 0 | 0.0% |
Commute Time by Sex in Granite Falls
The most common commute times in Granite Falls are 5 to 9 minutes (106 commuters, 17.5%) for males and 5 to 9 minutes (121 commuters, 26.0%) for females.
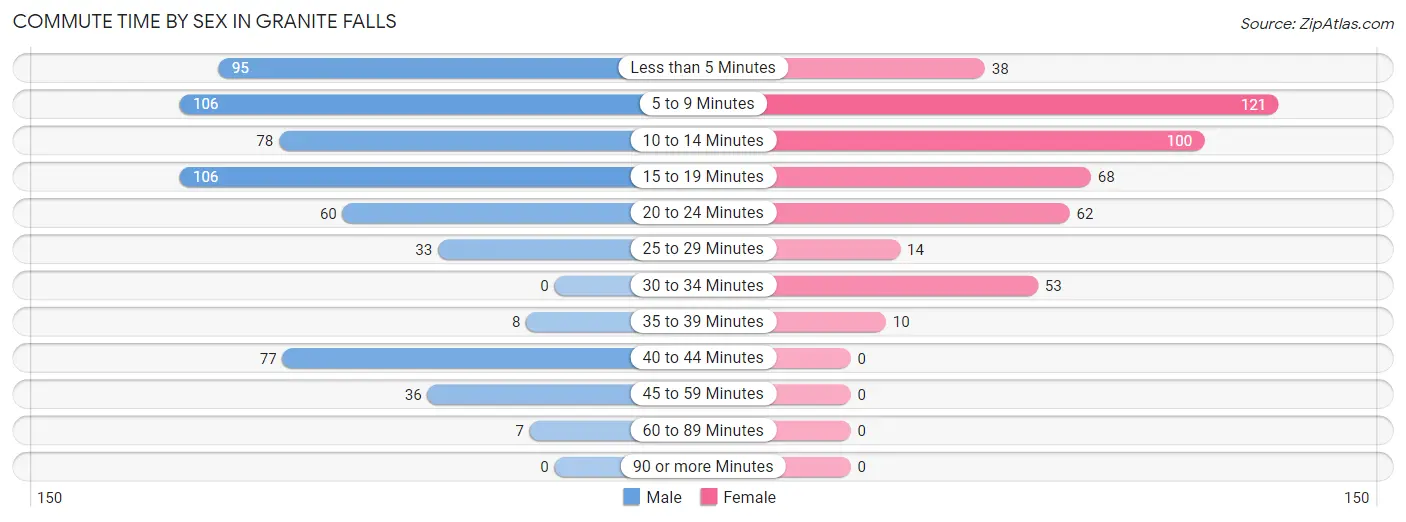
| Commute Time | Male | Female |
| Less than 5 Minutes | 95 (15.7%) | 38 (8.2%) |
| 5 to 9 Minutes | 106 (17.5%) | 121 (26.0%) |
| 10 to 14 Minutes | 78 (12.9%) | 100 (21.5%) |
| 15 to 19 Minutes | 106 (17.5%) | 68 (14.6%) |
| 20 to 24 Minutes | 60 (9.9%) | 62 (13.3%) |
| 25 to 29 Minutes | 33 (5.4%) | 14 (3.0%) |
| 30 to 34 Minutes | 0 (0.0%) | 53 (11.4%) |
| 35 to 39 Minutes | 8 (1.3%) | 10 (2.1%) |
| 40 to 44 Minutes | 77 (12.7%) | 0 (0.0%) |
| 45 to 59 Minutes | 36 (5.9%) | 0 (0.0%) |
| 60 to 89 Minutes | 7 (1.2%) | 0 (0.0%) |
| 90 or more Minutes | 0 (0.0%) | 0 (0.0%) |
Time of Departure to Work by Sex in Granite Falls
The most frequent times of departure to work in Granite Falls are 4:00 PM to 11:59 PM (131, 21.6%) for males and 7:30 AM to 7:59 AM (98, 21.0%) for females.
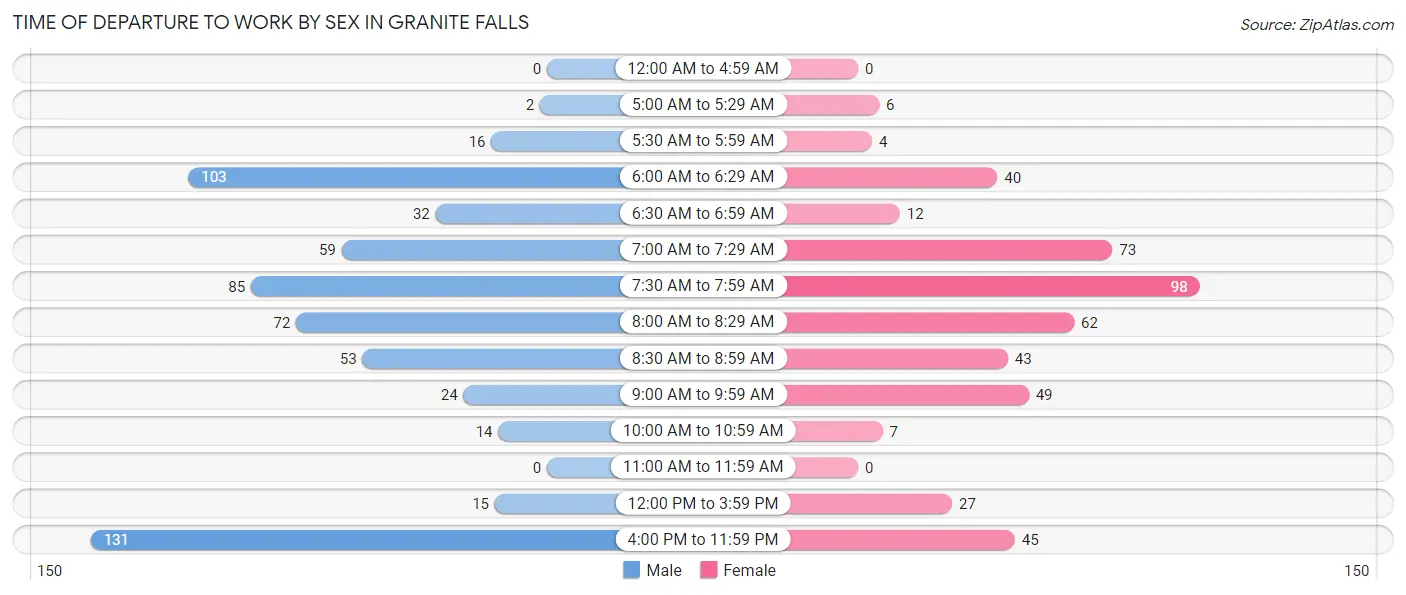
| Time of Departure | Male | Female |
| 12:00 AM to 4:59 AM | 0 (0.0%) | 0 (0.0%) |
| 5:00 AM to 5:29 AM | 2 (0.3%) | 6 (1.3%) |
| 5:30 AM to 5:59 AM | 16 (2.6%) | 4 (0.9%) |
| 6:00 AM to 6:29 AM | 103 (17.0%) | 40 (8.6%) |
| 6:30 AM to 6:59 AM | 32 (5.3%) | 12 (2.6%) |
| 7:00 AM to 7:29 AM | 59 (9.7%) | 73 (15.7%) |
| 7:30 AM to 7:59 AM | 85 (14.0%) | 98 (21.0%) |
| 8:00 AM to 8:29 AM | 72 (11.9%) | 62 (13.3%) |
| 8:30 AM to 8:59 AM | 53 (8.7%) | 43 (9.2%) |
| 9:00 AM to 9:59 AM | 24 (4.0%) | 49 (10.5%) |
| 10:00 AM to 10:59 AM | 14 (2.3%) | 7 (1.5%) |
| 11:00 AM to 11:59 AM | 0 (0.0%) | 0 (0.0%) |
| 12:00 PM to 3:59 PM | 15 (2.5%) | 27 (5.8%) |
| 4:00 PM to 11:59 PM | 131 (21.6%) | 45 (9.7%) |
| Total | 606 (100.0%) | 466 (100.0%) |
Housing Occupancy in Granite Falls
Occupancy by Ownership in Granite Falls
Of the total 1,104 dwellings in Granite Falls, owner-occupied units account for 806 (73.0%), while renter-occupied units make up 298 (27.0%).
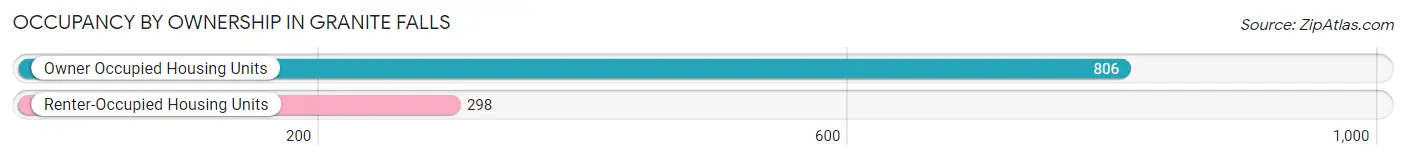
| Occupancy | # Housing Units | % Housing Units |
| Owner Occupied Housing Units | 806 | 73.0% |
| Renter-Occupied Housing Units | 298 | 27.0% |
| Total Occupied Housing Units | 1,104 | 100.0% |
Occupancy by Household Size in Granite Falls
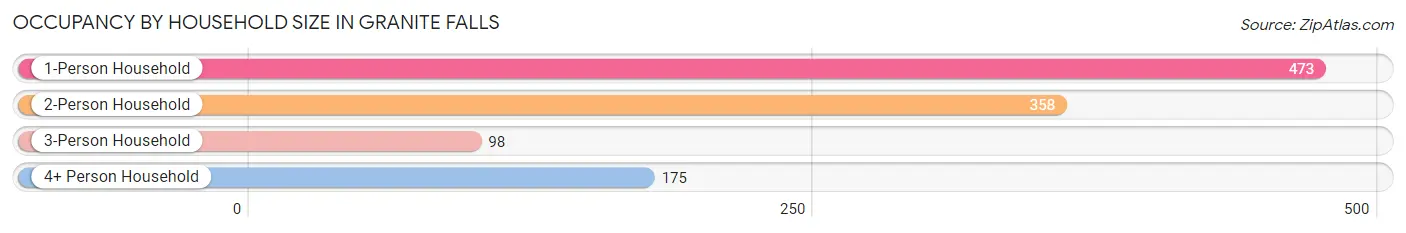
| Household Size | # Housing Units | % Housing Units |
| 1-Person Household | 473 | 42.8% |
| 2-Person Household | 358 | 32.4% |
| 3-Person Household | 98 | 8.9% |
| 4+ Person Household | 175 | 15.9% |
| Total Housing Units | 1,104 | 100.0% |
Occupancy by Ownership by Household Size in Granite Falls
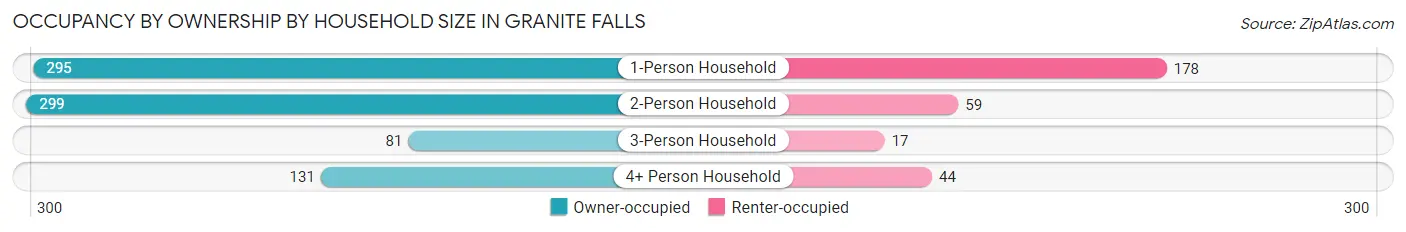
| Household Size | Owner-occupied | Renter-occupied |
| 1-Person Household | 295 (62.4%) | 178 (37.6%) |
| 2-Person Household | 299 (83.5%) | 59 (16.5%) |
| 3-Person Household | 81 (82.7%) | 17 (17.3%) |
| 4+ Person Household | 131 (74.9%) | 44 (25.1%) |
| Total Housing Units | 806 (73.0%) | 298 (27.0%) |
Occupancy by Educational Attainment in Granite Falls
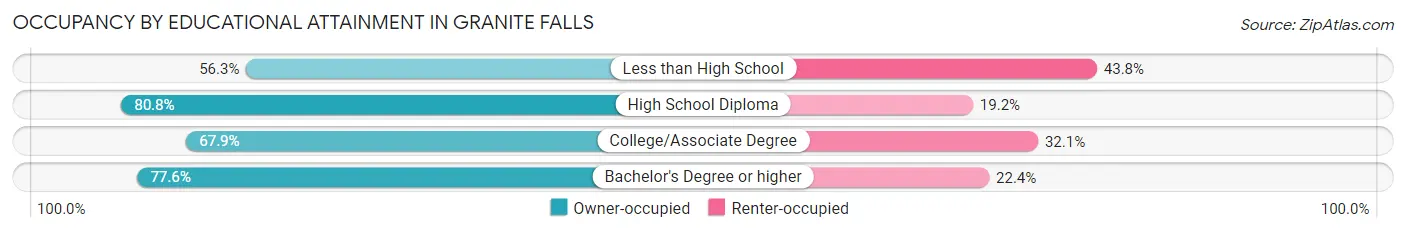
| Household Size | Owner-occupied | Renter-occupied |
| Less than High School | 36 (56.2%) | 28 (43.8%) |
| High School Diploma | 236 (80.8%) | 56 (19.2%) |
| College/Associate Degree | 326 (67.9%) | 154 (32.1%) |
| Bachelor's Degree or higher | 208 (77.6%) | 60 (22.4%) |
Occupancy by Age of Householder in Granite Falls
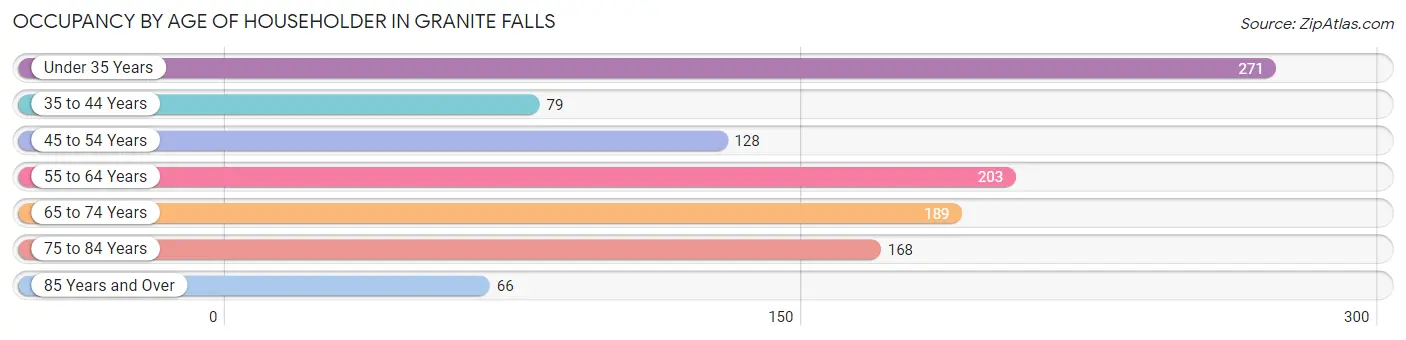
| Age Bracket | # Households | % Households |
| Under 35 Years | 271 | 24.5% |
| 35 to 44 Years | 79 | 7.2% |
| 45 to 54 Years | 128 | 11.6% |
| 55 to 64 Years | 203 | 18.4% |
| 65 to 74 Years | 189 | 17.1% |
| 75 to 84 Years | 168 | 15.2% |
| 85 Years and Over | 66 | 6.0% |
| Total | 1,104 | 100.0% |
Housing Finances in Granite Falls
Median Income by Occupancy in Granite Falls
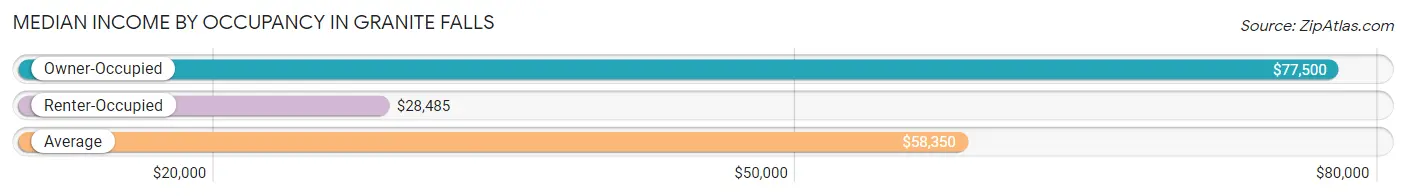
| Occupancy Type | # Households | Median Income |
| Owner-Occupied | 806 (73.0%) | $77,500 |
| Renter-Occupied | 298 (27.0%) | $28,485 |
| Average | 1,104 (100.0%) | $58,350 |
Occupancy by Householder Income Bracket in Granite Falls
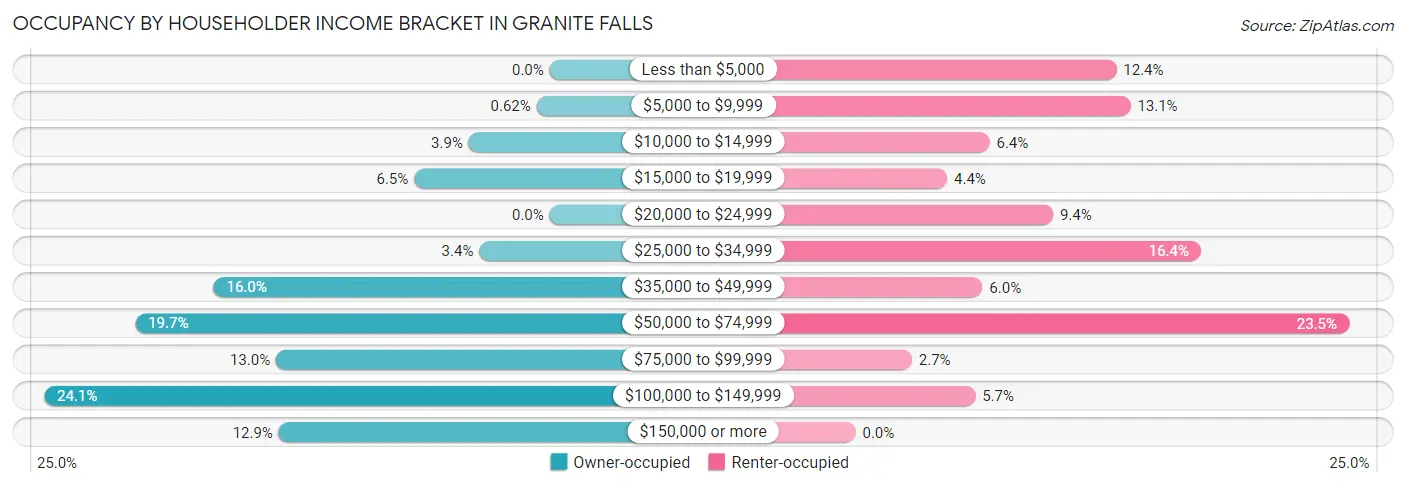
| Income Bracket | Owner-occupied | Renter-occupied |
| Less than $5,000 | 0 (0.0%) | 37 (12.4%) |
| $5,000 to $9,999 | 5 (0.6%) | 39 (13.1%) |
| $10,000 to $14,999 | 31 (3.8%) | 19 (6.4%) |
| $15,000 to $19,999 | 52 (6.5%) | 13 (4.4%) |
| $20,000 to $24,999 | 0 (0.0%) | 28 (9.4%) |
| $25,000 to $34,999 | 27 (3.4%) | 49 (16.4%) |
| $35,000 to $49,999 | 129 (16.0%) | 18 (6.0%) |
| $50,000 to $74,999 | 159 (19.7%) | 70 (23.5%) |
| $75,000 to $99,999 | 105 (13.0%) | 8 (2.7%) |
| $100,000 to $149,999 | 194 (24.1%) | 17 (5.7%) |
| $150,000 or more | 104 (12.9%) | 0 (0.0%) |
| Total | 806 (100.0%) | 298 (100.0%) |
Monthly Housing Cost Tiers in Granite Falls
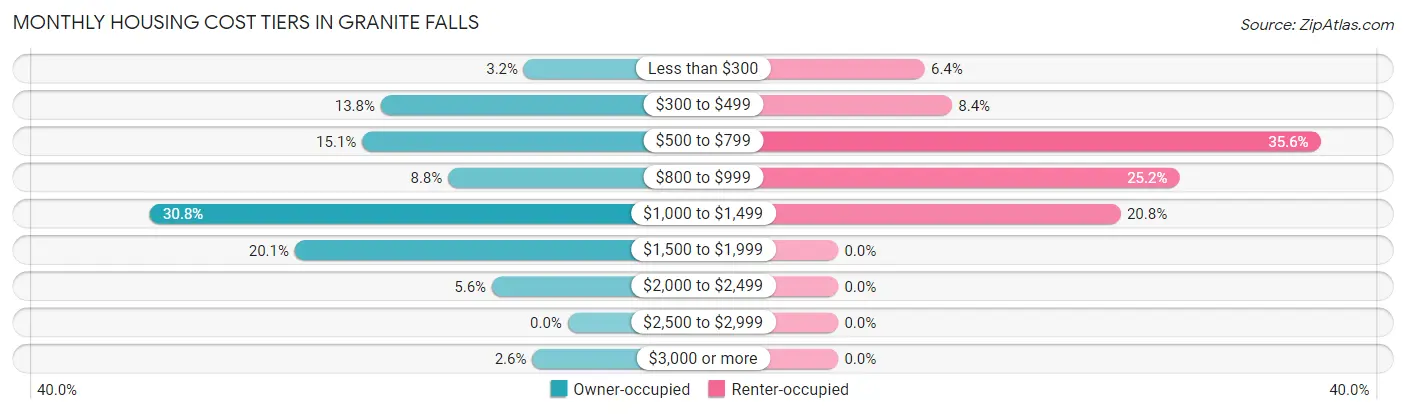
| Monthly Cost | Owner-occupied | Renter-occupied |
| Less than $300 | 26 (3.2%) | 19 (6.4%) |
| $300 to $499 | 111 (13.8%) | 25 (8.4%) |
| $500 to $799 | 122 (15.1%) | 106 (35.6%) |
| $800 to $999 | 71 (8.8%) | 75 (25.2%) |
| $1,000 to $1,499 | 248 (30.8%) | 62 (20.8%) |
| $1,500 to $1,999 | 162 (20.1%) | 0 (0.0%) |
| $2,000 to $2,499 | 45 (5.6%) | 0 (0.0%) |
| $2,500 to $2,999 | 0 (0.0%) | 0 (0.0%) |
| $3,000 or more | 21 (2.6%) | 0 (0.0%) |
| Total | 806 (100.0%) | 298 (100.0%) |
Physical Housing Characteristics in Granite Falls
Housing Structures in Granite Falls
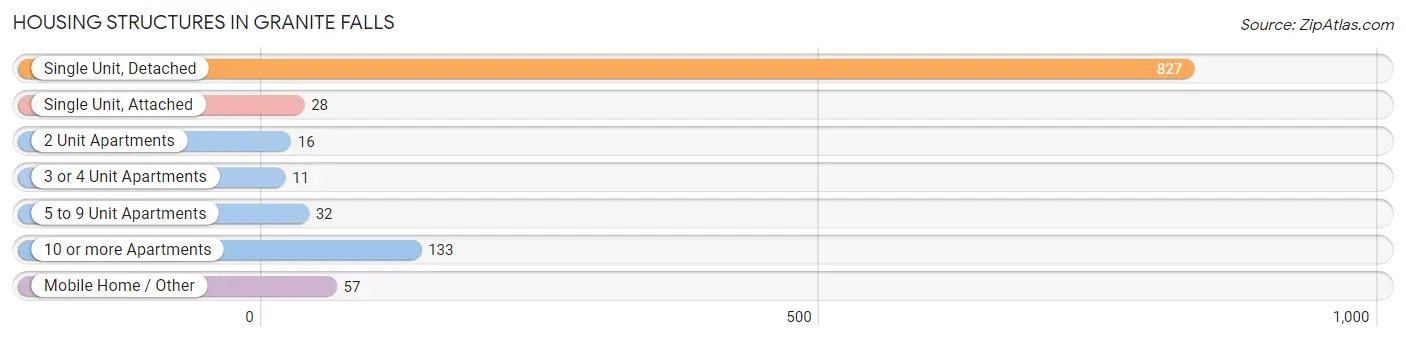
| Structure Type | # Housing Units | % Housing Units |
| Single Unit, Detached | 827 | 74.9% |
| Single Unit, Attached | 28 | 2.5% |
| 2 Unit Apartments | 16 | 1.5% |
| 3 or 4 Unit Apartments | 11 | 1.0% |
| 5 to 9 Unit Apartments | 32 | 2.9% |
| 10 or more Apartments | 133 | 12.0% |
| Mobile Home / Other | 57 | 5.2% |
| Total | 1,104 | 100.0% |
Housing Structures by Occupancy in Granite Falls
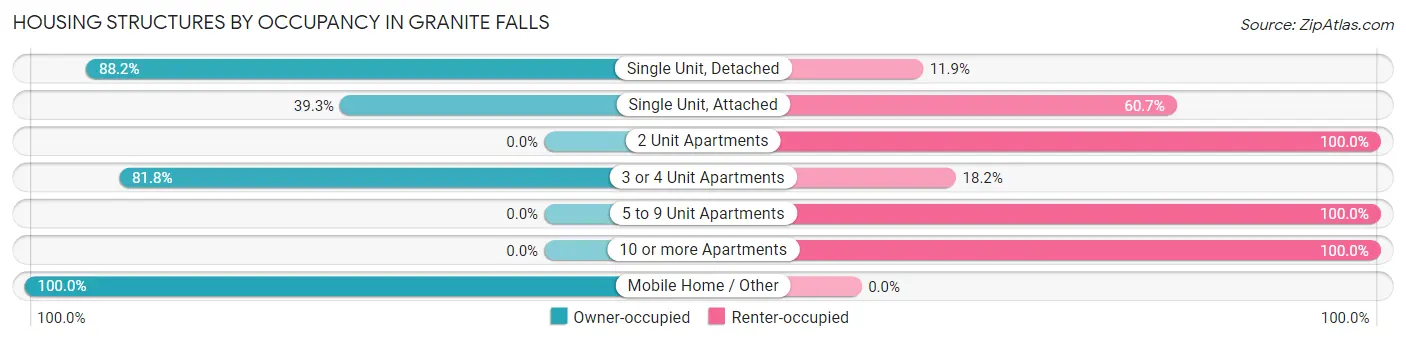
| Structure Type | Owner-occupied | Renter-occupied |
| Single Unit, Detached | 729 (88.1%) | 98 (11.8%) |
| Single Unit, Attached | 11 (39.3%) | 17 (60.7%) |
| 2 Unit Apartments | 0 (0.0%) | 16 (100.0%) |
| 3 or 4 Unit Apartments | 9 (81.8%) | 2 (18.2%) |
| 5 to 9 Unit Apartments | 0 (0.0%) | 32 (100.0%) |
| 10 or more Apartments | 0 (0.0%) | 133 (100.0%) |
| Mobile Home / Other | 57 (100.0%) | 0 (0.0%) |
| Total | 806 (73.0%) | 298 (27.0%) |
Housing Structures by Number of Rooms in Granite Falls
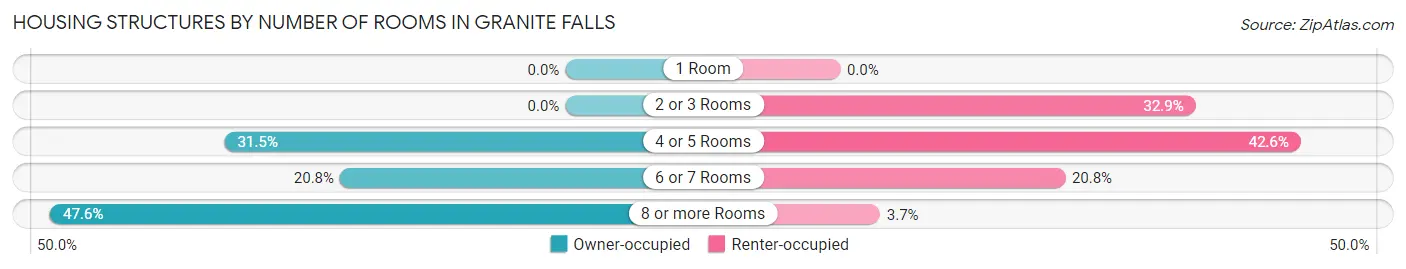
| Number of Rooms | Owner-occupied | Renter-occupied |
| 1 Room | 0 (0.0%) | 0 (0.0%) |
| 2 or 3 Rooms | 0 (0.0%) | 98 (32.9%) |
| 4 or 5 Rooms | 254 (31.5%) | 127 (42.6%) |
| 6 or 7 Rooms | 168 (20.8%) | 62 (20.8%) |
| 8 or more Rooms | 384 (47.6%) | 11 (3.7%) |
| Total | 806 (100.0%) | 298 (100.0%) |
Housing Structure by Heating Type in Granite Falls
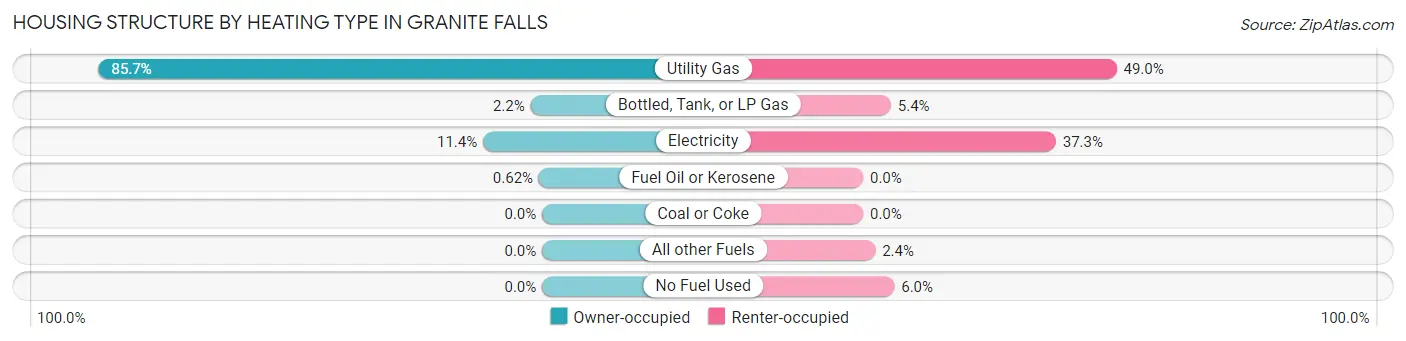
| Heating Type | Owner-occupied | Renter-occupied |
| Utility Gas | 691 (85.7%) | 146 (49.0%) |
| Bottled, Tank, or LP Gas | 18 (2.2%) | 16 (5.4%) |
| Electricity | 92 (11.4%) | 111 (37.2%) |
| Fuel Oil or Kerosene | 5 (0.6%) | 0 (0.0%) |
| Coal or Coke | 0 (0.0%) | 0 (0.0%) |
| All other Fuels | 0 (0.0%) | 7 (2.4%) |
| No Fuel Used | 0 (0.0%) | 18 (6.0%) |
| Total | 806 (100.0%) | 298 (100.0%) |
Household Vehicle Usage in Granite Falls
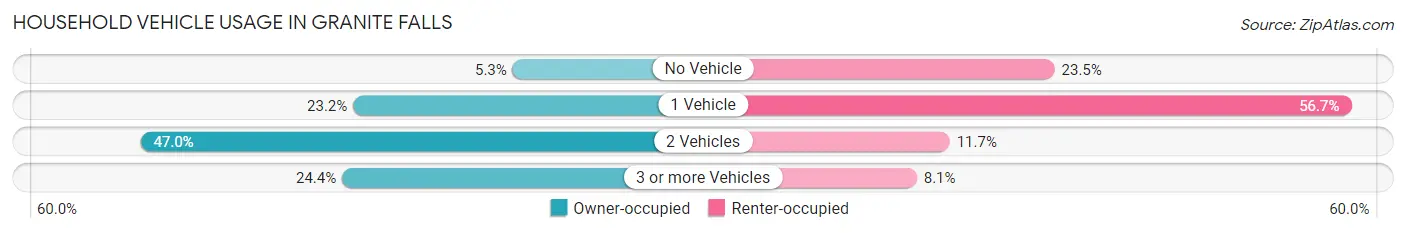
| Vehicles per Household | Owner-occupied | Renter-occupied |
| No Vehicle | 43 (5.3%) | 70 (23.5%) |
| 1 Vehicle | 187 (23.2%) | 169 (56.7%) |
| 2 Vehicles | 379 (47.0%) | 35 (11.7%) |
| 3 or more Vehicles | 197 (24.4%) | 24 (8.1%) |
| Total | 806 (100.0%) | 298 (100.0%) |
Real Estate & Mortgages in Granite Falls
Real Estate and Mortgage Overview in Granite Falls
| Characteristic | Without Mortgage | With Mortgage |
| Housing Units | 298 | 508 |
| Median Property Value | $134,200 | $155,800 |
| Median Household Income | $51,250 | $84 |
| Monthly Housing Costs | $520 | $0 |
| Real Estate Taxes | $2,163 | $53 |
Property Value by Mortgage Status in Granite Falls
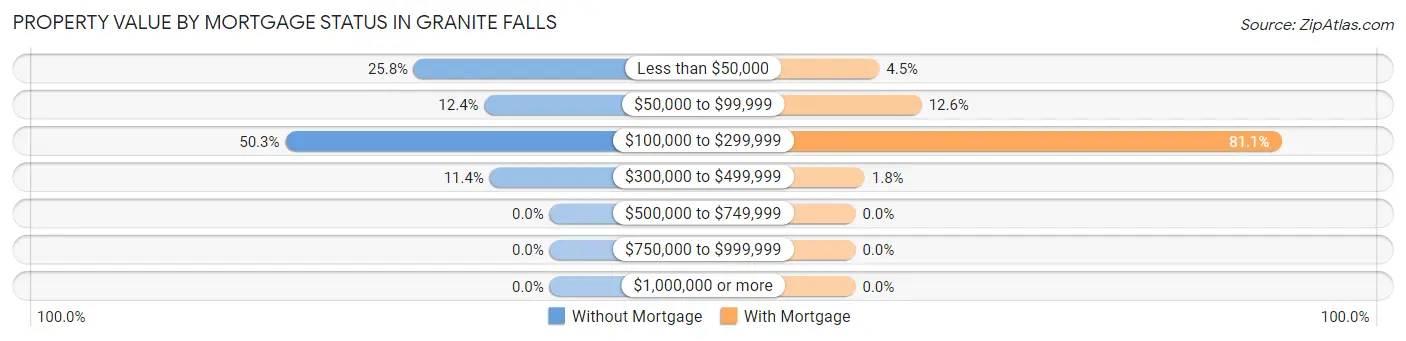
| Property Value | Without Mortgage | With Mortgage |
| Less than $50,000 | 77 (25.8%) | 23 (4.5%) |
| $50,000 to $99,999 | 37 (12.4%) | 64 (12.6%) |
| $100,000 to $299,999 | 150 (50.3%) | 412 (81.1%) |
| $300,000 to $499,999 | 34 (11.4%) | 9 (1.8%) |
| $500,000 to $749,999 | 0 (0.0%) | 0 (0.0%) |
| $750,000 to $999,999 | 0 (0.0%) | 0 (0.0%) |
| $1,000,000 or more | 0 (0.0%) | 0 (0.0%) |
| Total | 298 (100.0%) | 508 (100.0%) |
Household Income by Mortgage Status in Granite Falls
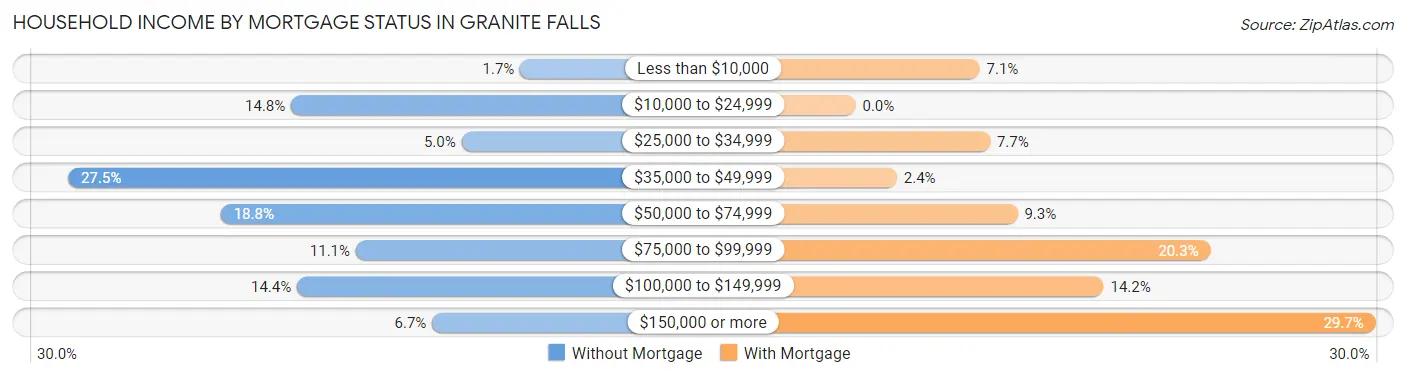
| Household Income | Without Mortgage | With Mortgage |
| Less than $10,000 | 5 (1.7%) | 36 (7.1%) |
| $10,000 to $24,999 | 44 (14.8%) | 0 (0.0%) |
| $25,000 to $34,999 | 15 (5.0%) | 39 (7.7%) |
| $35,000 to $49,999 | 82 (27.5%) | 12 (2.4%) |
| $50,000 to $74,999 | 56 (18.8%) | 47 (9.2%) |
| $75,000 to $99,999 | 33 (11.1%) | 103 (20.3%) |
| $100,000 to $149,999 | 43 (14.4%) | 72 (14.2%) |
| $150,000 or more | 20 (6.7%) | 151 (29.7%) |
| Total | 298 (100.0%) | 508 (100.0%) |
Property Value to Household Income Ratio in Granite Falls
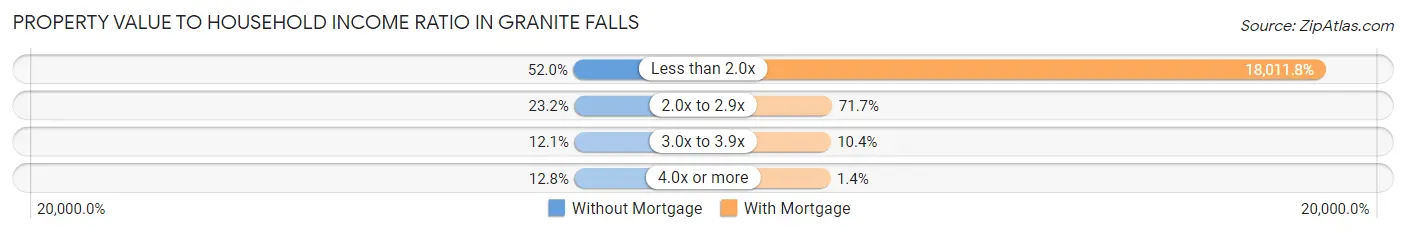
| Value-to-Income Ratio | Without Mortgage | With Mortgage |
| Less than 2.0x | 155 (52.0%) | 91,500 (18,011.8%) |
| 2.0x to 2.9x | 69 (23.2%) | 364 (71.7%) |
| 3.0x to 3.9x | 36 (12.1%) | 53 (10.4%) |
| 4.0x or more | 38 (12.8%) | 7 (1.4%) |
| Total | 298 (100.0%) | 508 (100.0%) |
Real Estate Taxes by Mortgage Status in Granite Falls
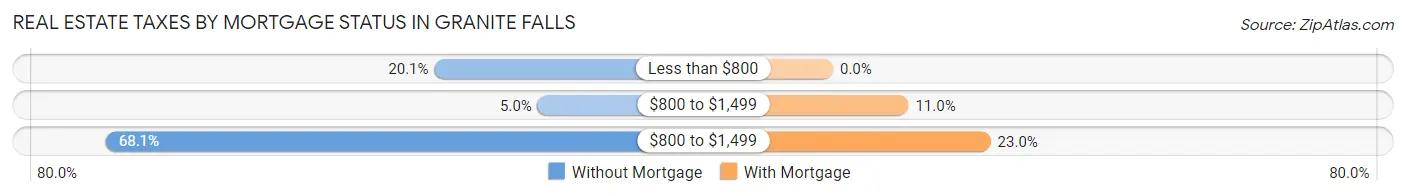
| Property Taxes | Without Mortgage | With Mortgage |
| Less than $800 | 60 (20.1%) | 0 (0.0%) |
| $800 to $1,499 | 15 (5.0%) | 56 (11.0%) |
| $800 to $1,499 | 203 (68.1%) | 117 (23.0%) |
| Total | 298 (100.0%) | 508 (100.0%) |
Health & Disability in Granite Falls
Health Insurance Coverage by Age in Granite Falls
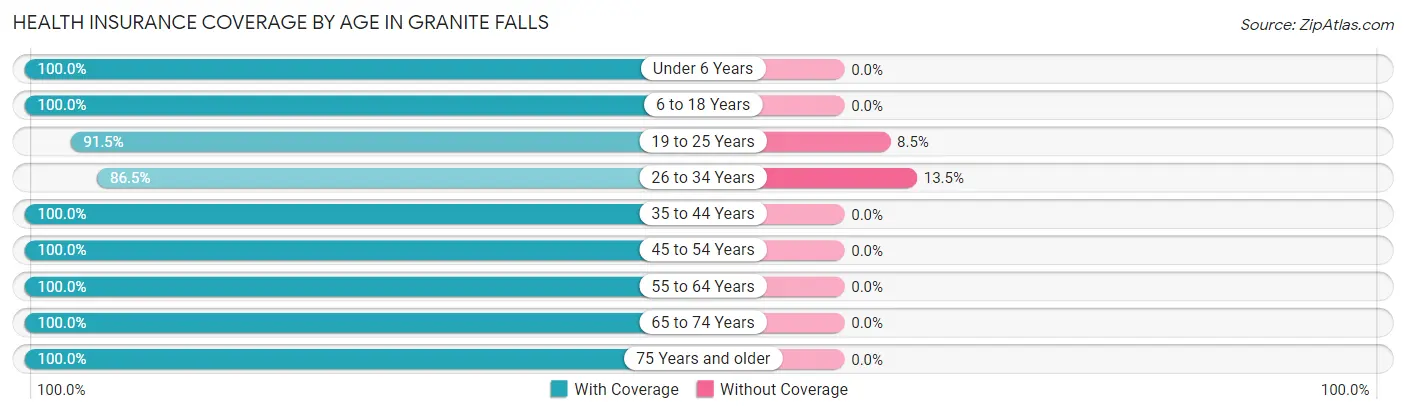
| Age Bracket | With Coverage | Without Coverage |
| Under 6 Years | 161 (100.0%) | 0 (0.0%) |
| 6 to 18 Years | 338 (100.0%) | 0 (0.0%) |
| 19 to 25 Years | 289 (91.5%) | 27 (8.5%) |
| 26 to 34 Years | 211 (86.5%) | 33 (13.5%) |
| 35 to 44 Years | 200 (100.0%) | 0 (0.0%) |
| 45 to 54 Years | 199 (100.0%) | 0 (0.0%) |
| 55 to 64 Years | 288 (100.0%) | 0 (0.0%) |
| 65 to 74 Years | 287 (100.0%) | 0 (0.0%) |
| 75 Years and older | 317 (100.0%) | 0 (0.0%) |
| Total | 2,290 (97.5%) | 60 (2.5%) |
Health Insurance Coverage by Citizenship Status in Granite Falls
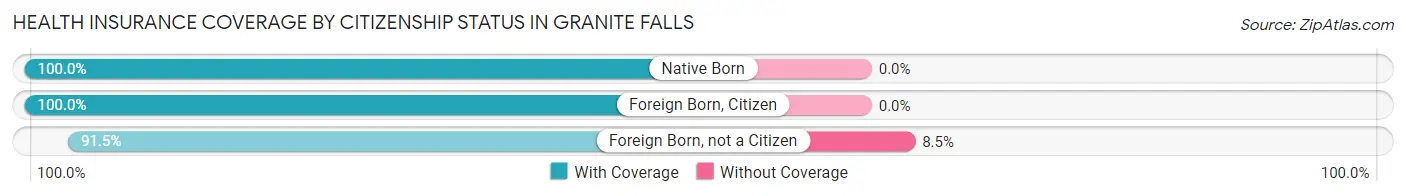
| Citizenship Status | With Coverage | Without Coverage |
| Native Born | 161 (100.0%) | 0 (0.0%) |
| Foreign Born, Citizen | 338 (100.0%) | 0 (0.0%) |
| Foreign Born, not a Citizen | 289 (91.5%) | 27 (8.5%) |
Health Insurance Coverage by Household Income in Granite Falls
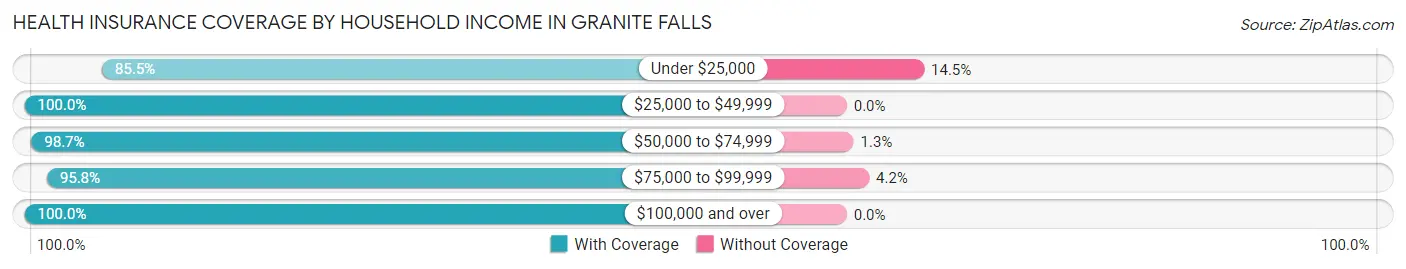
| Household Income | With Coverage | Without Coverage |
| Under $25,000 | 242 (85.5%) | 41 (14.5%) |
| $25,000 to $49,999 | 328 (100.0%) | 0 (0.0%) |
| $50,000 to $74,999 | 546 (98.7%) | 7 (1.3%) |
| $75,000 to $99,999 | 275 (95.8%) | 12 (4.2%) |
| $100,000 and over | 830 (100.0%) | 0 (0.0%) |
Public vs Private Health Insurance Coverage by Age in Granite Falls
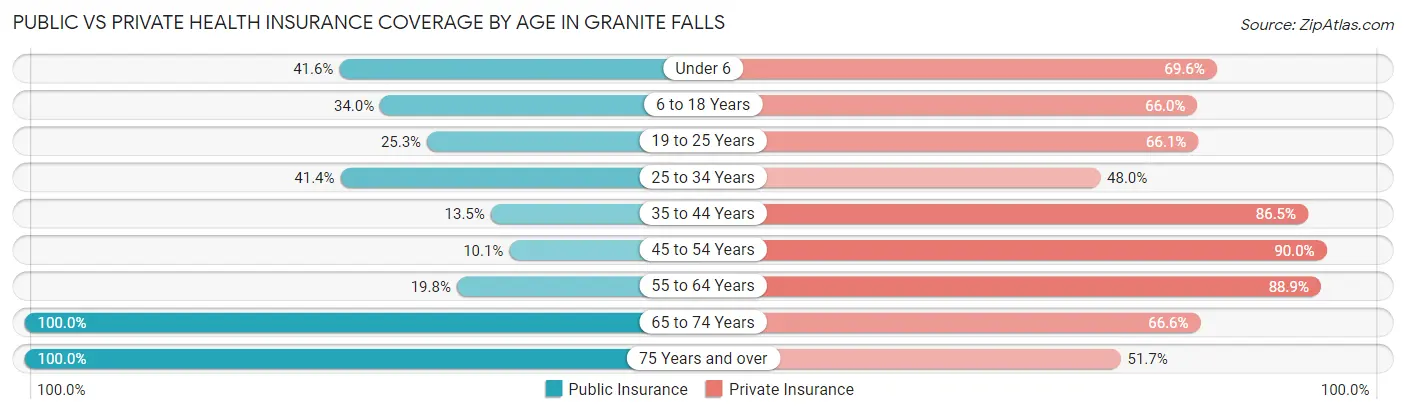
| Age Bracket | Public Insurance | Private Insurance |
| Under 6 | 67 (41.6%) | 112 (69.6%) |
| 6 to 18 Years | 115 (34.0%) | 223 (66.0%) |
| 19 to 25 Years | 80 (25.3%) | 209 (66.1%) |
| 25 to 34 Years | 101 (41.4%) | 117 (47.9%) |
| 35 to 44 Years | 27 (13.5%) | 173 (86.5%) |
| 45 to 54 Years | 20 (10.1%) | 179 (89.9%) |
| 55 to 64 Years | 57 (19.8%) | 256 (88.9%) |
| 65 to 74 Years | 287 (100.0%) | 191 (66.5%) |
| 75 Years and over | 317 (100.0%) | 164 (51.7%) |
| Total | 1,071 (45.6%) | 1,624 (69.1%) |
Disability Status by Sex by Age in Granite Falls
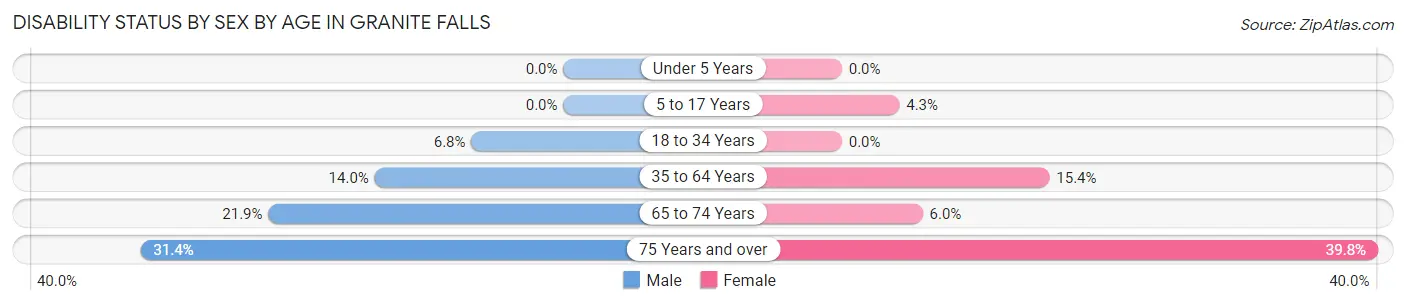
| Age Bracket | Male | Female |
| Under 5 Years | 0 (0.0%) | 0 (0.0%) |
| 5 to 17 Years | 0 (0.0%) | 7 (4.3%) |
| 18 to 34 Years | 19 (6.8%) | 0 (0.0%) |
| 35 to 64 Years | 59 (14.0%) | 41 (15.4%) |
| 65 to 74 Years | 30 (21.9%) | 9 (6.0%) |
| 75 Years and over | 38 (31.4%) | 78 (39.8%) |
Disability Class by Sex by Age in Granite Falls
Disability Class: Hearing Difficulty
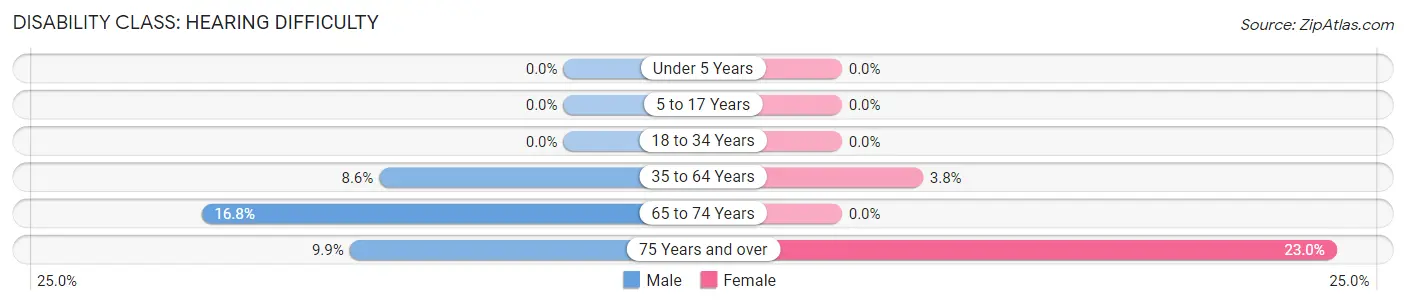
| Age Bracket | Male | Female |
| Under 5 Years | 0 (0.0%) | 0 (0.0%) |
| 5 to 17 Years | 0 (0.0%) | 0 (0.0%) |
| 18 to 34 Years | 0 (0.0%) | 0 (0.0%) |
| 35 to 64 Years | 36 (8.6%) | 10 (3.8%) |
| 65 to 74 Years | 23 (16.8%) | 0 (0.0%) |
| 75 Years and over | 12 (9.9%) | 45 (23.0%) |
Disability Class: Vision Difficulty
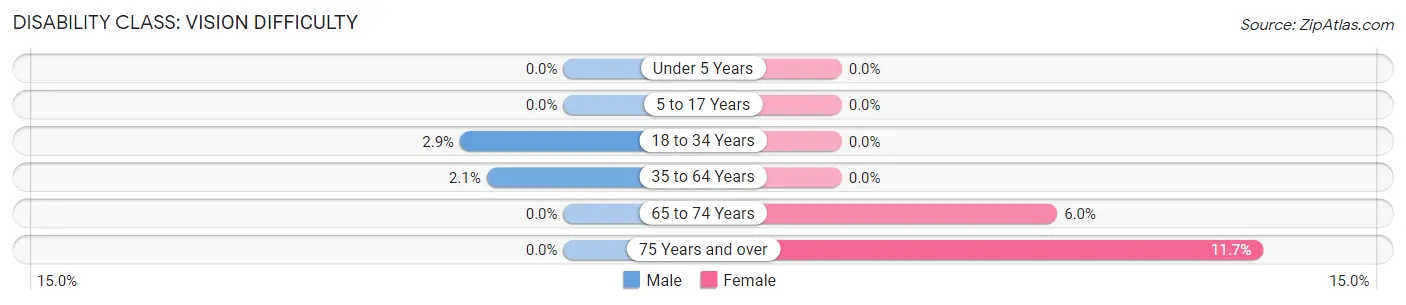
| Age Bracket | Male | Female |
| Under 5 Years | 0 (0.0%) | 0 (0.0%) |
| 5 to 17 Years | 0 (0.0%) | 0 (0.0%) |
| 18 to 34 Years | 8 (2.9%) | 0 (0.0%) |
| 35 to 64 Years | 9 (2.1%) | 0 (0.0%) |
| 65 to 74 Years | 0 (0.0%) | 9 (6.0%) |
| 75 Years and over | 0 (0.0%) | 23 (11.7%) |
Disability Class: Cognitive Difficulty
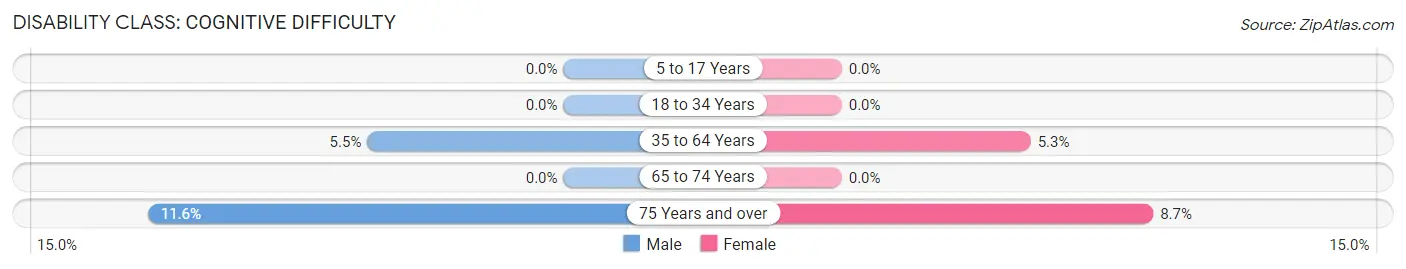
| Age Bracket | Male | Female |
| 5 to 17 Years | 0 (0.0%) | 0 (0.0%) |
| 18 to 34 Years | 0 (0.0%) | 0 (0.0%) |
| 35 to 64 Years | 23 (5.5%) | 14 (5.3%) |
| 65 to 74 Years | 0 (0.0%) | 0 (0.0%) |
| 75 Years and over | 14 (11.6%) | 17 (8.7%) |
Disability Class: Ambulatory Difficulty
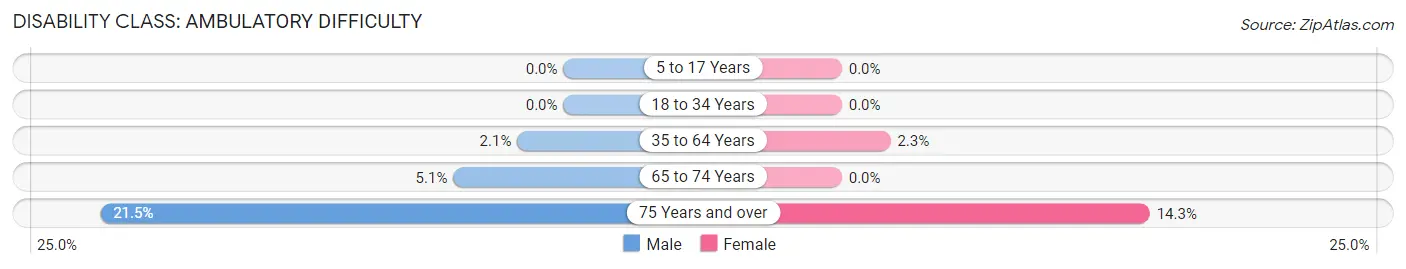
| Age Bracket | Male | Female |
| 5 to 17 Years | 0 (0.0%) | 0 (0.0%) |
| 18 to 34 Years | 0 (0.0%) | 0 (0.0%) |
| 35 to 64 Years | 9 (2.1%) | 6 (2.3%) |
| 65 to 74 Years | 7 (5.1%) | 0 (0.0%) |
| 75 Years and over | 26 (21.5%) | 28 (14.3%) |
Disability Class: Self-Care Difficulty
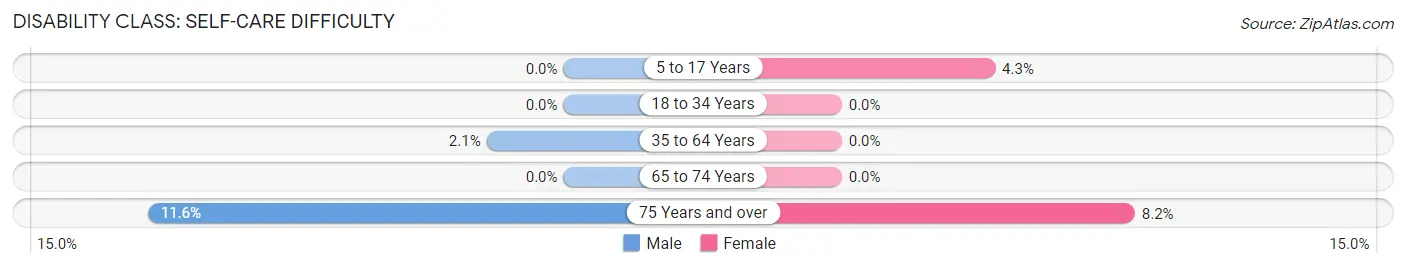
| Age Bracket | Male | Female |
| 5 to 17 Years | 0 (0.0%) | 7 (4.3%) |
| 18 to 34 Years | 0 (0.0%) | 0 (0.0%) |
| 35 to 64 Years | 9 (2.1%) | 0 (0.0%) |
| 65 to 74 Years | 0 (0.0%) | 0 (0.0%) |
| 75 Years and over | 14 (11.6%) | 16 (8.2%) |
Technology Access in Granite Falls
Computing Device Access in Granite Falls
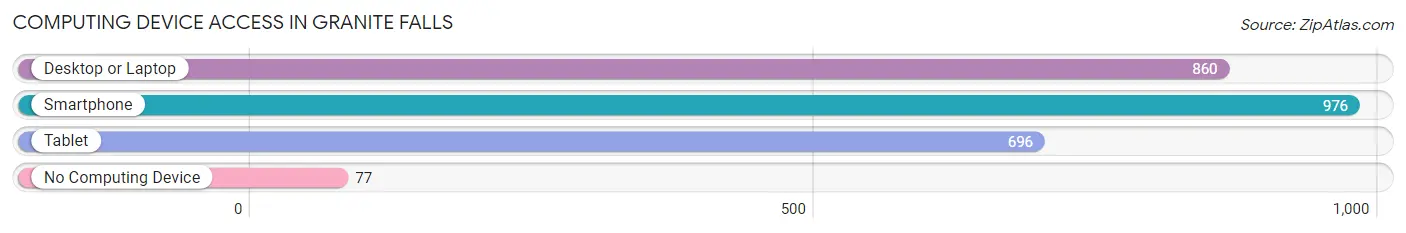
| Device Type | # Households | % Households |
| Desktop or Laptop | 860 | 77.9% |
| Smartphone | 976 | 88.4% |
| Tablet | 696 | 63.0% |
| No Computing Device | 77 | 7.0% |
| Total | 1,104 | 100.0% |
Internet Access in Granite Falls
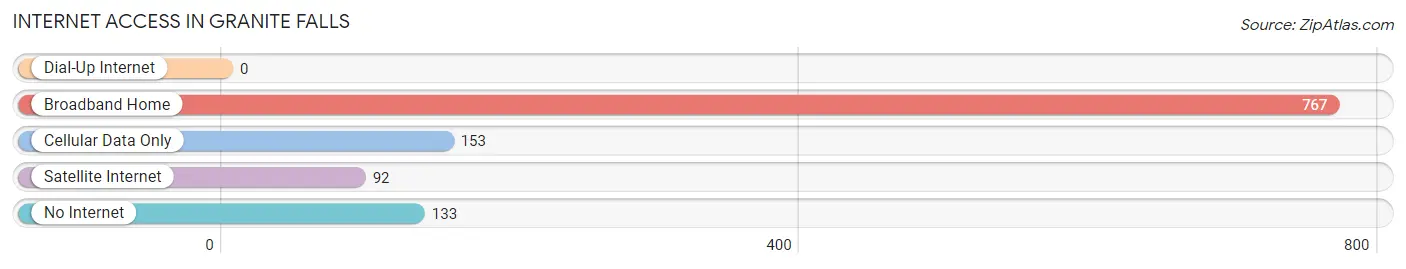
| Internet Type | # Households | % Households |
| Dial-Up Internet | 0 | 0.0% |
| Broadband Home | 767 | 69.5% |
| Cellular Data Only | 153 | 13.9% |
| Satellite Internet | 92 | 8.3% |
| No Internet | 133 | 12.0% |
| Total | 1,104 | 100.0% |
Granite Falls Summary
Granite Falls, Minnesota is a small city located in Yellow Medicine County in the southwestern part of the state. It is situated on the banks of the Minnesota River, about 40 miles west of the Twin Cities. The city has a population of 2,894 as of the 2010 census, making it the second-largest city in Yellow Medicine County.
History
Granite Falls was first settled in 1868 by a group of Swedish immigrants led by John Anderson. The city was named after the nearby falls on the Minnesota River, which were formed by the erosion of granite bedrock. The city was incorporated in 1881 and quickly became a center of commerce and industry. The first industry in the city was a sawmill, which was followed by a flour mill, a brickyard, and a creamery.
In the early 1900s, Granite Falls was a bustling city with a population of over 3,000. The city was home to a variety of businesses, including a hotel, a bank, a newspaper, a theater, and a variety of stores. The city also had a thriving agricultural industry, with many farmers growing wheat, oats, and other crops.
Geography
Granite Falls is located in the southwestern part of Minnesota, about 40 miles west of the Twin Cities. The city is situated on the banks of the Minnesota River, which flows through the city from east to west. The city is surrounded by rolling hills and farmland, with the nearest major city being Willmar, which is about 25 miles to the east.
The city has a total area of 2.2 square miles, all of which is land. The city has a humid continental climate, with cold winters and hot, humid summers. The average annual temperature is around 40 degrees Fahrenheit, with an average high of around 70 degrees in the summer and an average low of around 20 degrees in the winter.
Economy
Granite Falls has a diverse economy, with a variety of industries providing employment opportunities for its citizens. The city is home to a variety of manufacturing companies, including a plastics manufacturer, a metal fabricator, and a food processing plant. The city also has a thriving agricultural industry, with many farmers growing wheat, oats, and other crops.
The city is also home to a variety of retail stores, restaurants, and other businesses. The city is served by a variety of transportation options, including a bus service and a regional airport.
Demographics
As of the 2010 census, Granite Falls had a population of 2,894. The racial makeup of the city was 94.3% White, 0.7% African American, 0.3% Native American, 0.3% Asian, 0.1% Pacific Islander, 2.2% from other races, and 2.3% from two or more races. Hispanic or Latino of any race were 4.2% of the population.
The median income for a household in the city was $37,917, and the median income for a family was $45,938. The per capita income for the city was $19,945. About 11.3% of families and 14.2% of the population were below the poverty line, including 19.2% of those under age 18 and 8.2% of those age 65 or over.
Common Questions
What is Per Capita Income in Granite Falls?
Per Capita income in Granite Falls is $35,526.
What is the Median Family Income in Granite Falls?
Median Family Income in Granite Falls is $91,250.
What is the Median Household income in Granite Falls?
Median Household Income in Granite Falls is $58,350.
What is Income or Wage Gap in Granite Falls?
Income or Wage Gap in Granite Falls is 36.8%.
Women in Granite Falls earn 63.2 cents for every dollar earned by a man.
What is Inequality or Gini Index in Granite Falls?
Inequality or Gini Index in Granite Falls is 0.44.
What is the Total Population of Granite Falls?
Total Population of Granite Falls is 2,423.
What is the Total Male Population of Granite Falls?
Total Male Population of Granite Falls is 1,232.
What is the Total Female Population of Granite Falls?
Total Female Population of Granite Falls is 1,191.
What is the Ratio of Males per 100 Females in Granite Falls?
There are 103.44 Males per 100 Females in Granite Falls.
What is the Ratio of Females per 100 Males in Granite Falls?
There are 96.67 Females per 100 Males in Granite Falls.
What is the Median Population Age in Granite Falls?
Median Population Age in Granite Falls is 42.1 Years.
What is the Average Family Size in Granite Falls
Average Family Size in Granite Falls is 3.0 People.
What is the Average Household Size in Granite Falls
Average Household Size in Granite Falls is 2.1 People.
How Large is the Labor Force in Granite Falls?
There are 1,179 People in the Labor Forcein in Granite Falls.
What is the Percentage of People in the Labor Force in Granite Falls?
60.1% of People are in the Labor Force in Granite Falls.
What is the Unemployment Rate in Granite Falls?
Unemployment Rate in Granite Falls is 2.6%.