Cities with the Highest Percentage of Households Heated by Bottled Gas / Liquid Propane in Illinois
RELATED REPORTS & OPTIONS
Bottled Gas / LP Heating
Illinois
Compare Cities
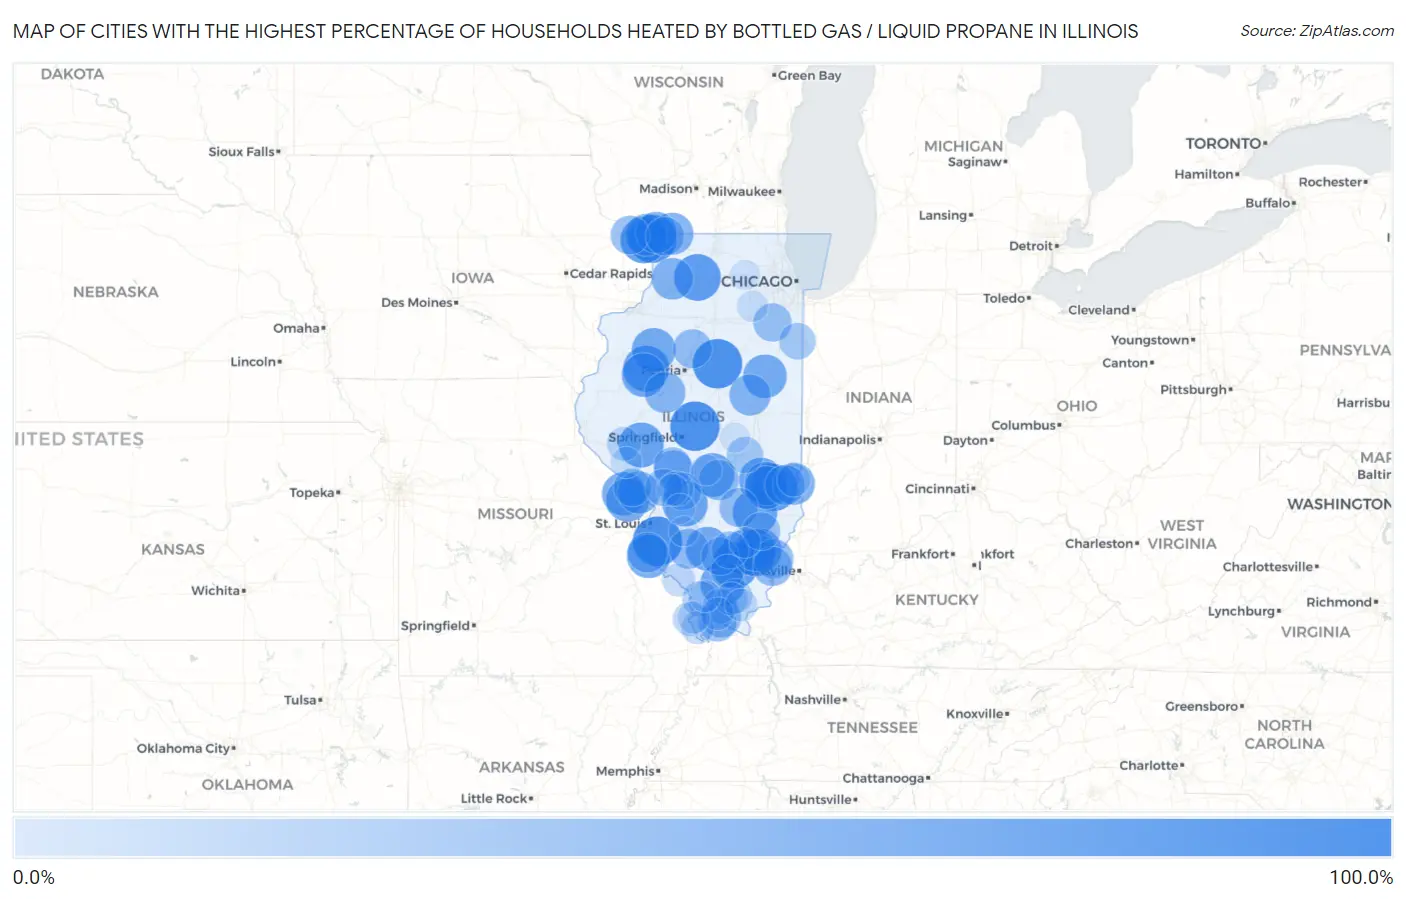
Map of Cities with the Highest Percentage of Households Heated by Bottled Gas / Liquid Propane in Illinois
0.0%
100.0%
Cities with the Highest Percentage of Households Heated by Bottled Gas / Liquid Propane in Illinois
| City | Bottled Gas / LP Heating | vs State | vs National | |
| 1. | Eagle Lake | 100.0% | 4.2%(+95.8)#1 | 4.9%(+95.1)#27 |
| 2. | Beverly | 100.0% | 4.2%(+95.8)#2 | 4.9%(+95.1)#69 |
| 3. | Cornland | 100.0% | 4.2%(+95.8)#3 | 4.9%(+95.1)#107 |
| 4. | Swedona | 100.0% | 4.2%(+95.8)#4 | 4.9%(+95.1)#145 |
| 5. | Panola | 100.0% | 4.2%(+95.8)#5 | 4.9%(+95.1)#170 |
| 6. | Floraville | 100.0% | 4.2%(+95.8)#6 | 4.9%(+95.1)#183 |
| 7. | Merritt | 100.0% | 4.2%(+95.8)#7 | 4.9%(+95.1)#213 |
| 8. | Apple Canyon Lake | 94.0% | 4.2%(+89.8)#8 | 4.9%(+89.1)#327 |
| 9. | Wilton Center | 90.6% | 4.2%(+86.4)#9 | 4.9%(+85.7)#387 |
| 10. | Yale | 89.7% | 4.2%(+85.5)#10 | 4.9%(+84.8)#411 |
| 11. | Lost Nation | 88.2% | 4.2%(+84.0)#11 | 4.9%(+83.3)#433 |
| 12. | Macedonia | 87.5% | 4.2%(+83.3)#12 | 4.9%(+82.6)#454 |
| 13. | The Galena Territory | 86.8% | 4.2%(+82.6)#13 | 4.9%(+81.9)#468 |
| 14. | London Mills | 85.3% | 4.2%(+81.1)#14 | 4.9%(+80.4)#500 |
| 15. | Oxville | 83.3% | 4.2%(+79.1)#15 | 4.9%(+78.4)#561 |
| 16. | Old Ripley | 81.8% | 4.2%(+77.6)#16 | 4.9%(+76.9)#604 |
| 17. | Smithville | 81.5% | 4.2%(+77.3)#17 | 4.9%(+76.6)#623 |
| 18. | Lynnville | 81.1% | 4.2%(+76.9)#18 | 4.9%(+76.2)#643 |
| 19. | Belle Prairie City | 80.0% | 4.2%(+75.8)#19 | 4.9%(+75.1)#675 |
| 20. | Sailor Springs | 79.5% | 4.2%(+75.3)#20 | 4.9%(+74.6)#694 |
| 21. | Jewett | 79.0% | 4.2%(+74.8)#21 | 4.9%(+74.1)#713 |
| 22. | Whiteash | 77.5% | 4.2%(+73.3)#22 | 4.9%(+72.6)#765 |
| 23. | Oak Run | 76.4% | 4.2%(+72.2)#23 | 4.9%(+71.5)#809 |
| 24. | Ellisville | 75.7% | 4.2%(+71.5)#24 | 4.9%(+70.8)#842 |
| 25. | Radom | 75.4% | 4.2%(+71.2)#25 | 4.9%(+70.5)#851 |
| 26. | Oconee | 75.3% | 4.2%(+71.1)#26 | 4.9%(+70.4)#857 |
| 27. | Roberts | 75.0% | 4.2%(+70.8)#27 | 4.9%(+70.1)#863 |
| 28. | Fults | 75.0% | 4.2%(+70.8)#28 | 4.9%(+70.1)#887 |
| 29. | Batchtown | 74.5% | 4.2%(+70.3)#29 | 4.9%(+69.6)#905 |
| 30. | Hidalgo | 74.4% | 4.2%(+70.2)#30 | 4.9%(+69.5)#914 |
| 31. | Brussels | 73.8% | 4.2%(+69.6)#31 | 4.9%(+68.9)#933 |
| 32. | La Clede | 73.3% | 4.2%(+69.1)#32 | 4.9%(+68.4)#955 |
| 33. | Burnt Prairie | 73.1% | 4.2%(+68.9)#33 | 4.9%(+68.2)#968 |
| 34. | Rose Hill | 72.2% | 4.2%(+68.0)#34 | 4.9%(+67.3)#1,019 |
| 35. | Springerton | 70.3% | 4.2%(+66.1)#35 | 4.9%(+65.4)#1,110 |
| 36. | Otterville | 69.6% | 4.2%(+65.4)#36 | 4.9%(+64.7)#1,138 |
| 37. | Mill Shoals | 69.1% | 4.2%(+64.9)#37 | 4.9%(+64.2)#1,169 |
| 38. | West York | 69.0% | 4.2%(+64.8)#38 | 4.9%(+64.1)#1,174 |
| 39. | Winslow | 67.7% | 4.2%(+63.5)#39 | 4.9%(+62.8)#1,247 |
| 40. | Scales Mound | 67.4% | 4.2%(+63.2)#40 | 4.9%(+62.5)#1,261 |
| 41. | Coleta | 66.2% | 4.2%(+62.0)#41 | 4.9%(+61.3)#1,329 |
| 42. | Apple River | 65.4% | 4.2%(+61.2)#42 | 4.9%(+60.5)#1,383 |
| 43. | Foosland | 64.7% | 4.2%(+60.5)#43 | 4.9%(+59.8)#1,417 |
| 44. | Goofy Ridge | 62.9% | 4.2%(+58.7)#44 | 4.9%(+58.0)#1,503 |
| 45. | Literberry | 62.5% | 4.2%(+58.3)#45 | 4.9%(+57.6)#1,531 |
| 46. | Herrick | 60.7% | 4.2%(+56.5)#46 | 4.9%(+55.8)#1,640 |
| 47. | Maeystown | 60.0% | 4.2%(+55.8)#47 | 4.9%(+55.1)#1,680 |
| 48. | Annapolis | 60.0% | 4.2%(+55.8)#48 | 4.9%(+55.1)#1,686 |
| 49. | Oakdale | 58.7% | 4.2%(+54.5)#49 | 4.9%(+53.8)#1,792 |
| 50. | Belknap | 58.7% | 4.2%(+54.5)#50 | 4.9%(+53.8)#1,797 |
| 51. | Phillipstown | 57.1% | 4.2%(+52.9)#51 | 4.9%(+52.2)#1,915 |
| 52. | Maunie | 56.8% | 4.2%(+52.6)#52 | 4.9%(+51.9)#1,940 |
| 53. | Standard City | 56.7% | 4.2%(+52.5)#53 | 4.9%(+51.8)#1,950 |
| 54. | Hopewell | 55.6% | 4.2%(+51.4)#54 | 4.9%(+50.7)#2,014 |
| 55. | Iola | 55.2% | 4.2%(+51.0)#55 | 4.9%(+50.3)#2,047 |
| 56. | Menominee | 54.1% | 4.2%(+49.9)#56 | 4.9%(+49.2)#2,131 |
| 57. | Nora | 53.8% | 4.2%(+49.6)#57 | 4.9%(+48.9)#2,142 |
| 58. | Symerton | 52.8% | 4.2%(+48.6)#58 | 4.9%(+47.9)#2,218 |
| 59. | Illinois | 52.6% | 4.2%(+48.4)#59 | 4.9%(+47.7)#2,233 |
| 60. | New Grand Chain | 51.4% | 4.2%(+47.2)#60 | 4.9%(+46.5)#2,306 |
| 61. | Prairietown | 51.3% | 4.2%(+47.1)#61 | 4.9%(+46.4)#2,311 |
| 62. | Mount Erie | 51.0% | 4.2%(+46.8)#62 | 4.9%(+46.1)#2,329 |
| 63. | Nilwood | 50.8% | 4.2%(+46.6)#63 | 4.9%(+45.9)#2,345 |
| 64. | Fieldon | 50.6% | 4.2%(+46.4)#64 | 4.9%(+45.7)#2,355 |
| 65. | Nason | 50.5% | 4.2%(+46.3)#65 | 4.9%(+45.6)#2,361 |
| 66. | Walshville | 50.0% | 4.2%(+45.8)#66 | 4.9%(+45.1)#2,382 |
| 67. | Royal Lakes | 48.5% | 4.2%(+44.3)#67 | 4.9%(+43.6)#2,512 |
| 68. | Opdyke | 47.6% | 4.2%(+43.4)#68 | 4.9%(+42.7)#2,589 |
| 69. | Hopkins Park | 45.1% | 4.2%(+40.9)#69 | 4.9%(+40.2)#2,800 |
| 70. | Allenville | 44.7% | 4.2%(+40.5)#70 | 4.9%(+39.8)#2,834 |
| 71. | Riggston | 44.4% | 4.2%(+40.2)#71 | 4.9%(+39.5)#2,867 |
| 72. | Alto Pass | 40.4% | 4.2%(+36.2)#72 | 4.9%(+35.5)#3,199 |
| 73. | Buncombe | 39.0% | 4.2%(+34.8)#73 | 4.9%(+34.1)#3,321 |
| 74. | Lake Ka Ho | 37.7% | 4.2%(+33.5)#74 | 4.9%(+32.8)#3,447 |
| 75. | Stonefort | 37.6% | 4.2%(+33.4)#75 | 4.9%(+32.7)#3,452 |
| 76. | Unity | 36.0% | 4.2%(+31.8)#76 | 4.9%(+31.1)#3,590 |
| 77. | East Cape Girardeau | 35.2% | 4.2%(+31.0)#77 | 4.9%(+30.3)#3,663 |
| 78. | Lane | 34.9% | 4.2%(+30.7)#78 | 4.9%(+30.0)#3,692 |
| 79. | Valley City | 33.3% | 4.2%(+29.1)#79 | 4.9%(+28.4)#3,865 |
| 80. | Hanaford | 32.2% | 4.2%(+28.0)#80 | 4.9%(+27.3)#3,984 |
| 81. | West Union | 31.2% | 4.2%(+27.0)#81 | 4.9%(+26.3)#4,089 |
| 82. | Olive Branch | 31.0% | 4.2%(+26.8)#82 | 4.9%(+26.1)#4,105 |
| 83. | New Burnside | 30.9% | 4.2%(+26.7)#83 | 4.9%(+26.0)#4,125 |
| 84. | Rockwood | 30.0% | 4.2%(+25.8)#84 | 4.9%(+25.1)#4,235 |
| 85. | Cypress | 29.5% | 4.2%(+25.3)#85 | 4.9%(+24.6)#4,287 |
| 86. | Eddyville | 28.6% | 4.2%(+24.4)#86 | 4.9%(+23.7)#4,410 |
| 87. | Mcclure | 26.7% | 4.2%(+22.5)#87 | 4.9%(+21.8)#4,651 |
| 88. | Lake Carroll | 26.1% | 4.2%(+21.9)#88 | 4.9%(+21.2)#4,733 |
| 89. | Makanda | 25.9% | 4.2%(+21.7)#89 | 4.9%(+21.0)#4,764 |
| 90. | Paloma | 25.8% | 4.2%(+21.6)#90 | 4.9%(+20.9)#4,786 |
| 91. | Sawyerville | 25.3% | 4.2%(+21.1)#91 | 4.9%(+20.4)#4,857 |
| 92. | Lorenzo | 25.0% | 4.2%(+20.8)#92 | 4.9%(+20.1)#4,918 |
| 93. | Pearl | 24.1% | 4.2%(+19.9)#93 | 4.9%(+19.2)#5,053 |
| 94. | Plattville | 23.4% | 4.2%(+19.2)#94 | 4.9%(+18.5)#5,138 |
| 95. | Ohlman | 22.2% | 4.2%(+18.0)#95 | 4.9%(+17.3)#5,327 |
| 96. | Sims | 21.8% | 4.2%(+17.6)#96 | 4.9%(+16.9)#5,389 |
| 97. | Virgil | 19.5% | 4.2%(+15.3)#97 | 4.9%(+14.6)#5,785 |
| 98. | Grantfork | 19.3% | 4.2%(+15.1)#98 | 4.9%(+14.4)#5,810 |
| 99. | Laplace | 19.2% | 4.2%(+15.0)#99 | 4.9%(+14.3)#5,832 |
| 100. | Damiansville | 19.1% | 4.2%(+14.9)#100 | 4.9%(+14.2)#5,836 |
Common Questions
What are the Top 10 Cities with the Highest Percentage of Households Heated by Bottled Gas / Liquid Propane in Illinois?
Top 10 Cities with the Highest Percentage of Households Heated by Bottled Gas / Liquid Propane in Illinois are:
#1
100.0%
#2
100.0%
#3
100.0%
#4
94.0%
#5
89.7%
#6
88.2%
#7
87.5%
#8
86.8%
#9
85.3%
#10
81.8%
What city has the Highest Percentage of Households Heated by Bottled Gas / Liquid Propane in Illinois?
Cornland has the Highest Percentage of Households Heated by Bottled Gas / Liquid Propane in Illinois with 100.0%.
What is the Percentage of Households Heated by Bottled Gas / Liquid Propane in the State of Illinois?
Percentage of Households Heated by Bottled Gas / Liquid Propane in Illinois is 4.2%.
What is the Percentage of Households Heated by Bottled Gas / Liquid Propane in the United States?
Percentage of Households Heated by Bottled Gas / Liquid Propane in the United States is 4.9%.