Alto Pass, IL Map & Demographics
Alto Pass Map
Alto Pass Overview
$30,113
PER CAPITA INCOME
$75,536
AVG FAMILY INCOME
$58,393
AVG HOUSEHOLD INCOME
16.5%
WAGE / INCOME GAP [ % ]
83.5¢/ $1
WAGE / INCOME GAP [ $ ]
0.36
INEQUALITY / GINI INDEX
381
TOTAL POPULATION
194
MALE POPULATION
187
FEMALE POPULATION
103.74
MALES / 100 FEMALES
96.39
FEMALES / 100 MALES
44.4
MEDIAN AGE
3.6
AVG FAMILY SIZE
2.7
AVG HOUSEHOLD SIZE
185
LABOR FORCE [ PEOPLE ]
59.5%
PERCENT IN LABOR FORCE
4.9%
UNEMPLOYMENT RATE
Alto Pass Zip Codes
Alto Pass Area Codes
Income in Alto Pass
Income Overview in Alto Pass
Per Capita Income in Alto Pass is $30,113, while median incomes of families and households are $75,536 and $58,393 respectively.
| Characteristic | Number | Measure |
| Per Capita Income | 381 | $30,113 |
| Median Family Income | 85 | $75,536 |
| Mean Family Income | 85 | $88,439 |
| Median Household Income | 141 | $58,393 |
| Mean Household Income | 141 | $69,735 |
| Income Deficit | 85 | $0 |
| Wage / Income Gap (%) | 381 | 16.47% |
| Wage / Income Gap ($) | 381 | 83.53¢ per $1 |
| Gini / Inequality Index | 381 | 0.36 |
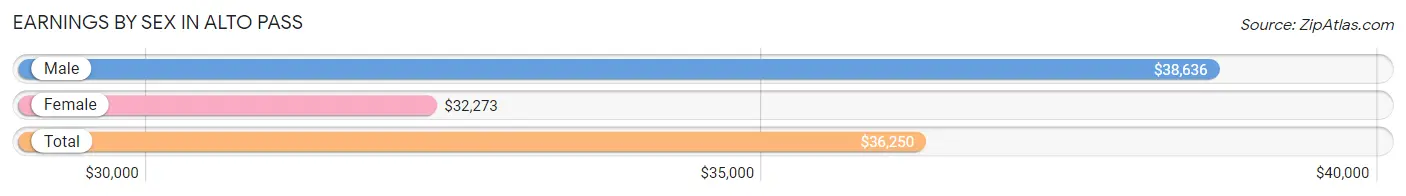
Earnings by Sex in Alto Pass
Average Earnings in Alto Pass are $36,250, $38,636 for men and $32,273 for women, a difference of 16.5%.
| Sex | Number | Average Earnings |
| Male | 108 (51.9%) | $38,636 |
| Female | 100 (48.1%) | $32,273 |
| Total | 208 (100.0%) | $36,250 |
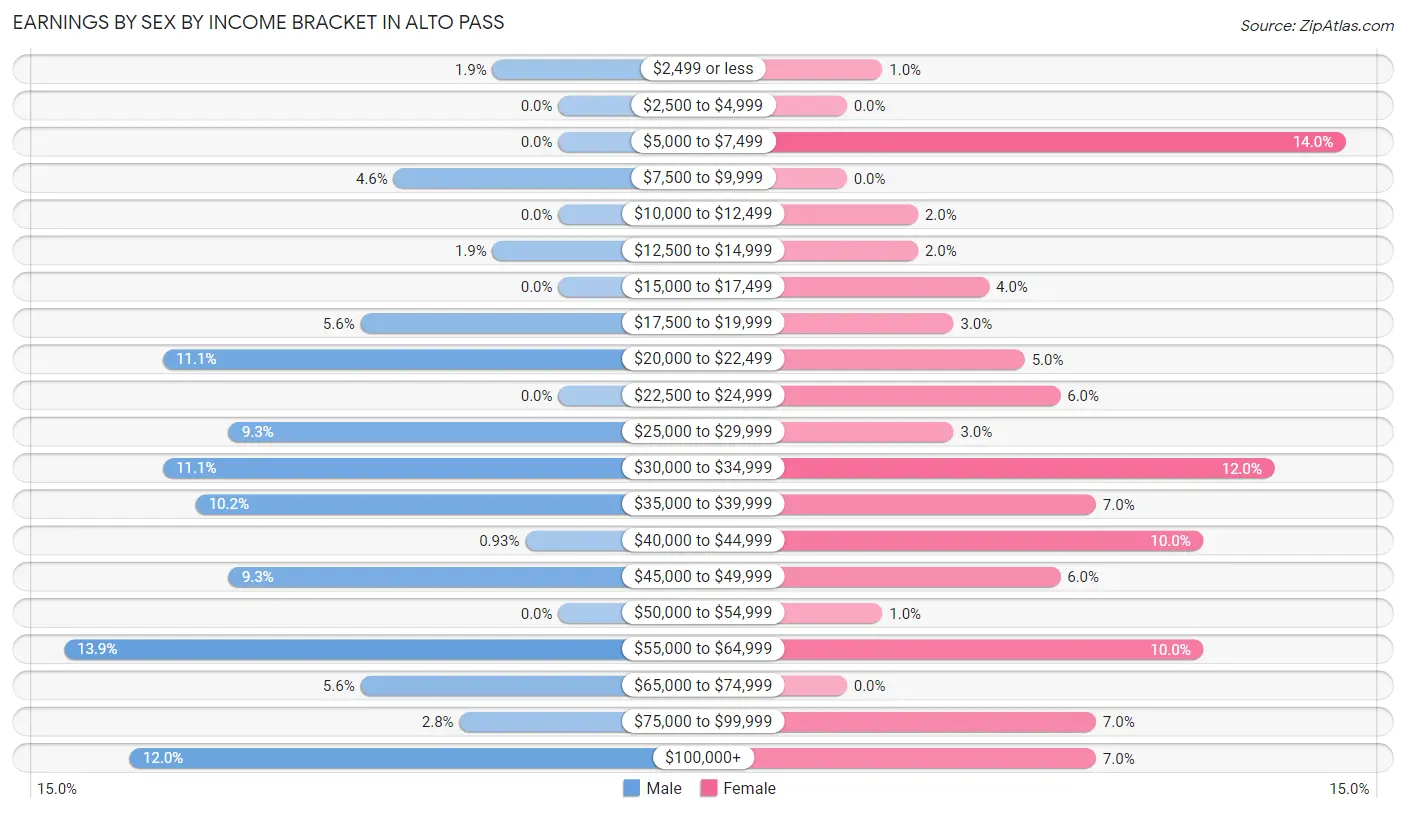
Earnings by Sex by Income Bracket in Alto Pass
The most common earnings brackets in Alto Pass are $55,000 to $64,999 for men (15 | 13.9%) and $5,000 to $7,499 for women (14 | 14.0%).
| Income | Male | Female |
| $2,499 or less | 2 (1.8%) | 1 (1.0%) |
| $2,500 to $4,999 | 0 (0.0%) | 0 (0.0%) |
| $5,000 to $7,499 | 0 (0.0%) | 14 (14.0%) |
| $7,500 to $9,999 | 5 (4.6%) | 0 (0.0%) |
| $10,000 to $12,499 | 0 (0.0%) | 2 (2.0%) |
| $12,500 to $14,999 | 2 (1.8%) | 2 (2.0%) |
| $15,000 to $17,499 | 0 (0.0%) | 4 (4.0%) |
| $17,500 to $19,999 | 6 (5.6%) | 3 (3.0%) |
| $20,000 to $22,499 | 12 (11.1%) | 5 (5.0%) |
| $22,500 to $24,999 | 0 (0.0%) | 6 (6.0%) |
| $25,000 to $29,999 | 10 (9.3%) | 3 (3.0%) |
| $30,000 to $34,999 | 12 (11.1%) | 12 (12.0%) |
| $35,000 to $39,999 | 11 (10.2%) | 7 (7.0%) |
| $40,000 to $44,999 | 1 (0.9%) | 10 (10.0%) |
| $45,000 to $49,999 | 10 (9.3%) | 6 (6.0%) |
| $50,000 to $54,999 | 0 (0.0%) | 1 (1.0%) |
| $55,000 to $64,999 | 15 (13.9%) | 10 (10.0%) |
| $65,000 to $74,999 | 6 (5.6%) | 0 (0.0%) |
| $75,000 to $99,999 | 3 (2.8%) | 7 (7.0%) |
| $100,000+ | 13 (12.0%) | 7 (7.0%) |
| Total | 108 (100.0%) | 100 (100.0%) |
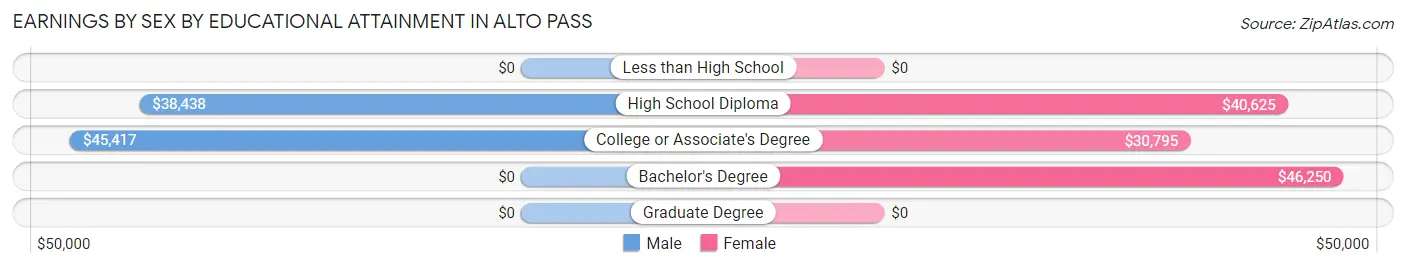
Earnings by Sex by Educational Attainment in Alto Pass
Average earnings in Alto Pass are $39,091 for men and $32,500 for women, a difference of 16.9%. Men with an educational attainment of college or associate's degree enjoy the highest average annual earnings of $45,417, while those with high school diploma education earn the least with $38,438. Women with an educational attainment of bachelor's degree earn the most with the average annual earnings of $46,250, while those with college or associate's degree education have the smallest earnings of $30,795.
| Educational Attainment | Male Income | Female Income |
| Less than High School | - | - |
| High School Diploma | $38,438 | $40,625 |
| College or Associate's Degree | $45,417 | $30,795 |
| Bachelor's Degree | - | - |
| Graduate Degree | - | - |
| Total | $39,091 | $32,500 |
Family Income in Alto Pass
Family Income Brackets in Alto Pass
According to the Alto Pass family income data, there are 24 families falling into the $50,000 to $74,999 income range, which is the most common income bracket and makes up 28.2% of all families.
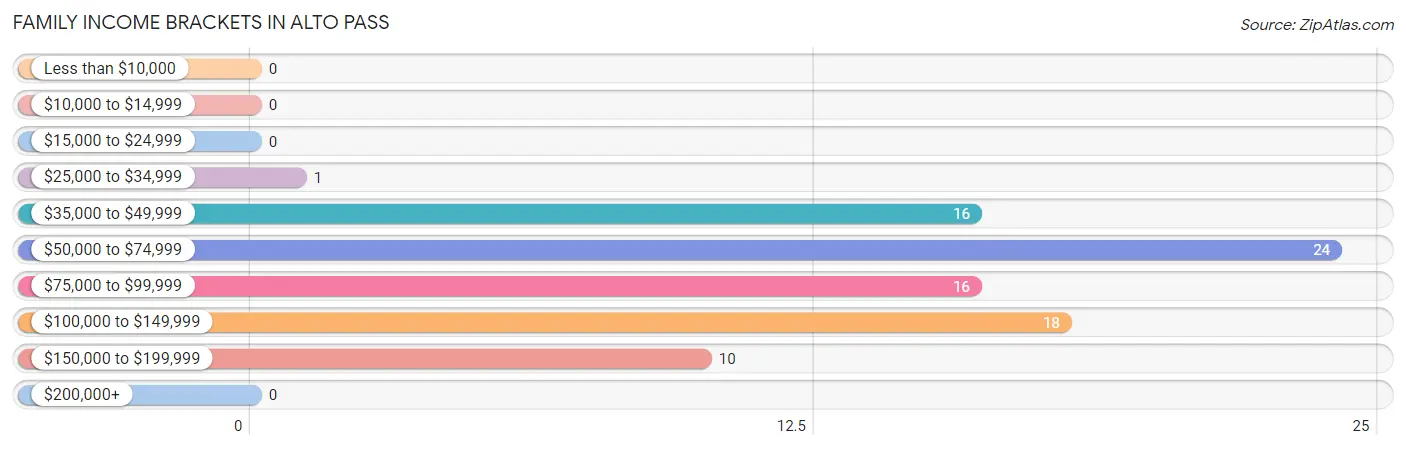
| Income Bracket | # Families | % Families |
| Less than $10,000 | 0 | 0.0% |
| $10,000 to $14,999 | 0 | 0.0% |
| $15,000 to $24,999 | 0 | 0.0% |
| $25,000 to $34,999 | 1 | 1.2% |
| $35,000 to $49,999 | 16 | 18.8% |
| $50,000 to $74,999 | 24 | 28.2% |
| $75,000 to $99,999 | 16 | 18.8% |
| $100,000 to $149,999 | 18 | 21.2% |
| $150,000 to $199,999 | 10 | 11.8% |
| $200,000+ | 0 | 0.0% |
Family Income by Famaliy Size in Alto Pass
4-person families (17 | 20.0%) account for the highest median family income in Alto Pass with $158,125 per family, while 4-person families (17 | 20.0%) have the highest median income of $39,531 per family member.
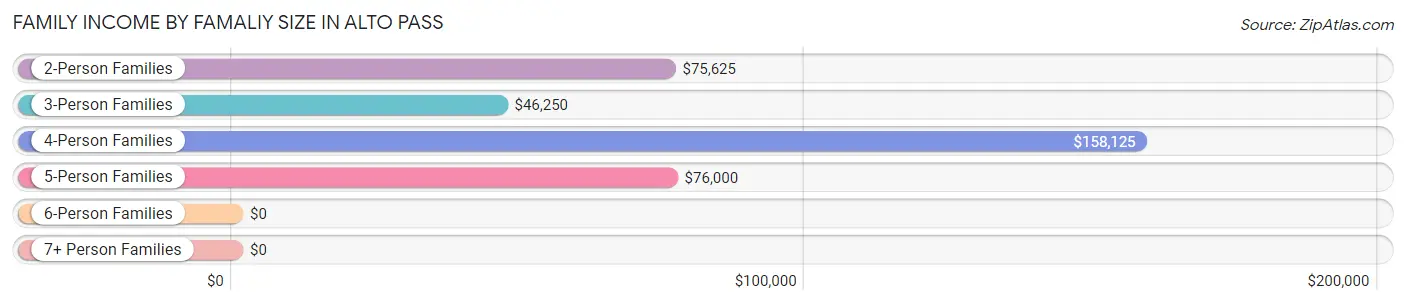
| Income Bracket | # Families | Median Income |
| 2-Person Families | 39 (45.9%) | $75,625 |
| 3-Person Families | 15 (17.6%) | $46,250 |
| 4-Person Families | 17 (20.0%) | $158,125 |
| 5-Person Families | 14 (16.5%) | $76,000 |
| 6-Person Families | 0 (0.0%) | $0 |
| 7+ Person Families | 0 (0.0%) | $0 |
| Total | 85 (100.0%) | $75,536 |
Family Income by Number of Earners in Alto Pass
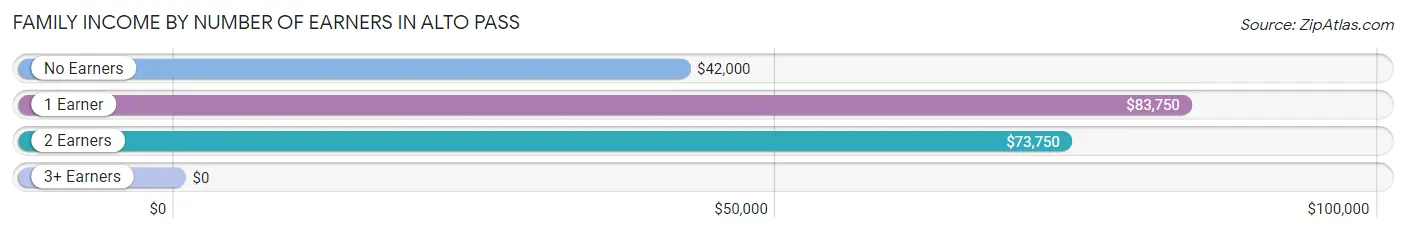
| Number of Earners | # Families | Median Income |
| No Earners | 10 (11.8%) | $42,000 |
| 1 Earner | 29 (34.1%) | $83,750 |
| 2 Earners | 42 (49.4%) | $73,750 |
| 3+ Earners | 4 (4.7%) | $0 |
| Total | 85 (100.0%) | $75,536 |
Household Income in Alto Pass
Household Income Brackets in Alto Pass
With 35 households falling in the category, the $50,000 to $74,999 income range is the most frequent in Alto Pass, accounting for 24.8% of all households.
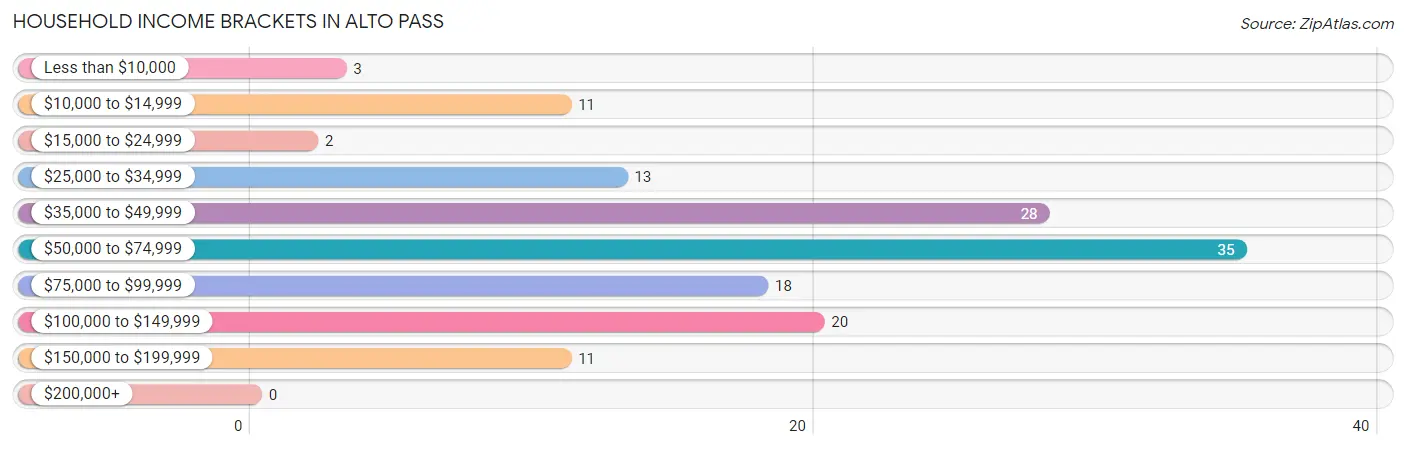
| Income Bracket | # Households | % Households |
| Less than $10,000 | 3 | 2.1% |
| $10,000 to $14,999 | 11 | 7.8% |
| $15,000 to $24,999 | 2 | 1.4% |
| $25,000 to $34,999 | 13 | 9.2% |
| $35,000 to $49,999 | 28 | 19.9% |
| $50,000 to $74,999 | 35 | 24.8% |
| $75,000 to $99,999 | 18 | 12.8% |
| $100,000 to $149,999 | 20 | 14.2% |
| $150,000 to $199,999 | 11 | 7.8% |
| $200,000+ | 0 | 0.0% |
Household Income by Householder Age in Alto Pass
The median household income in Alto Pass is $58,393, with the highest median household income of $76,500 found in the 25 to 44 years age bracket for the primary householder. A total of 40 households (28.4%) fall into this category.
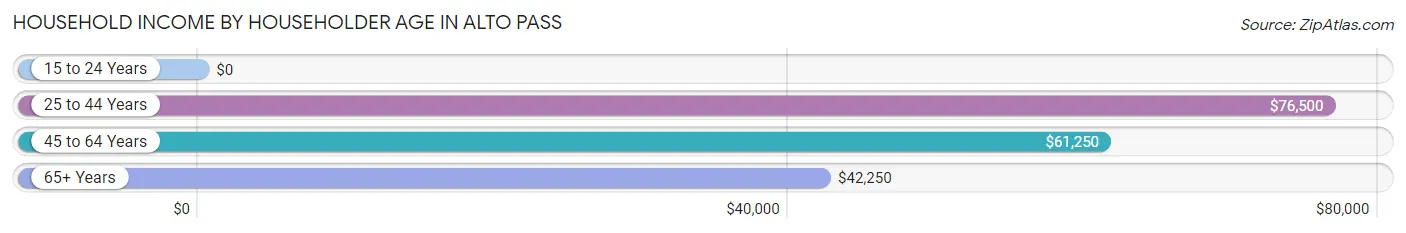
| Income Bracket | # Households | Median Income |
| 15 to 24 Years | 0 (0.0%) | $0 |
| 25 to 44 Years | 40 (28.4%) | $76,500 |
| 45 to 64 Years | 58 (41.1%) | $61,250 |
| 65+ Years | 43 (30.5%) | $42,250 |
| Total | 141 (100.0%) | $58,393 |
Poverty in Alto Pass
Income Below Poverty by Sex and Age in Alto Pass
With 2.1% poverty level for males and 6.0% for females among the residents of Alto Pass, 55 to 64 year old males and 75 year old and over females are the most vulnerable to poverty, with 4 males (12.1%) and 8 females (53.3%) in their respective age groups living below the poverty level.
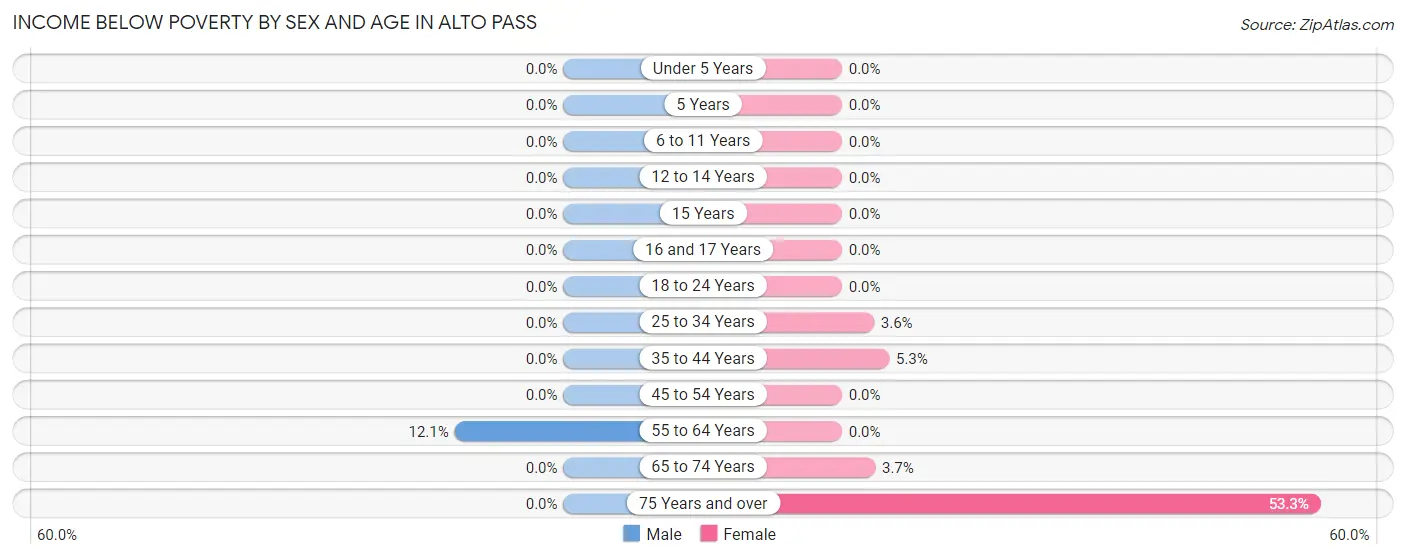
| Age Bracket | Male | Female |
| Under 5 Years | 0 (0.0%) | 0 (0.0%) |
| 5 Years | 0 (0.0%) | 0 (0.0%) |
| 6 to 11 Years | 0 (0.0%) | 0 (0.0%) |
| 12 to 14 Years | 0 (0.0%) | 0 (0.0%) |
| 15 Years | 0 (0.0%) | 0 (0.0%) |
| 16 and 17 Years | 0 (0.0%) | 0 (0.0%) |
| 18 to 24 Years | 0 (0.0%) | 0 (0.0%) |
| 25 to 34 Years | 0 (0.0%) | 1 (3.6%) |
| 35 to 44 Years | 0 (0.0%) | 1 (5.3%) |
| 45 to 54 Years | 0 (0.0%) | 0 (0.0%) |
| 55 to 64 Years | 4 (12.1%) | 0 (0.0%) |
| 65 to 74 Years | 0 (0.0%) | 1 (3.7%) |
| 75 Years and over | 0 (0.0%) | 8 (53.3%) |
| Total | 4 (2.1%) | 11 (6.0%) |
Income Above Poverty by Sex and Age in Alto Pass
According to the poverty statistics in Alto Pass, males aged under 5 years and females aged under 5 years are the age groups that are most secure financially, with 100.0% of males and 100.0% of females in these age groups living above the poverty line.
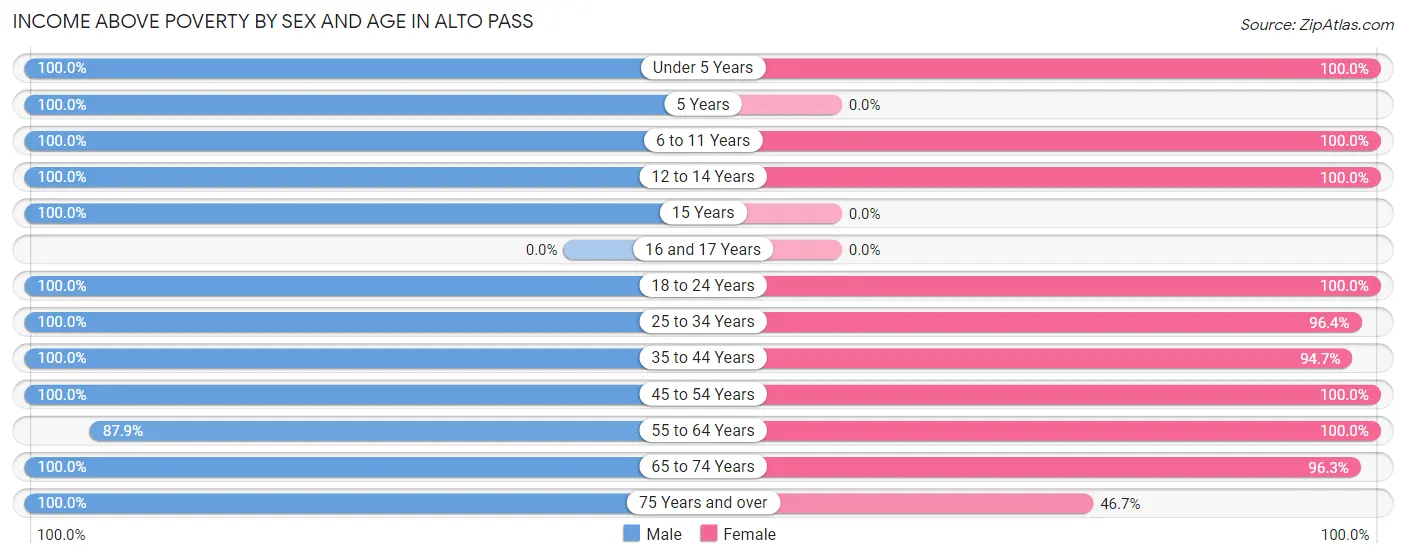
| Age Bracket | Male | Female |
| Under 5 Years | 17 (100.0%) | 4 (100.0%) |
| 5 Years | 5 (100.0%) | 0 (0.0%) |
| 6 to 11 Years | 9 (100.0%) | 6 (100.0%) |
| 12 to 14 Years | 1 (100.0%) | 16 (100.0%) |
| 15 Years | 9 (100.0%) | 0 (0.0%) |
| 16 and 17 Years | 0 (0.0%) | 0 (0.0%) |
| 18 to 24 Years | 14 (100.0%) | 2 (100.0%) |
| 25 to 34 Years | 48 (100.0%) | 27 (96.4%) |
| 35 to 44 Years | 12 (100.0%) | 18 (94.7%) |
| 45 to 54 Years | 17 (100.0%) | 35 (100.0%) |
| 55 to 64 Years | 29 (87.9%) | 32 (100.0%) |
| 65 to 74 Years | 21 (100.0%) | 26 (96.3%) |
| 75 Years and over | 8 (100.0%) | 7 (46.7%) |
| Total | 190 (97.9%) | 173 (94.0%) |
Income Below Poverty Among Married-Couple Families in Alto Pass
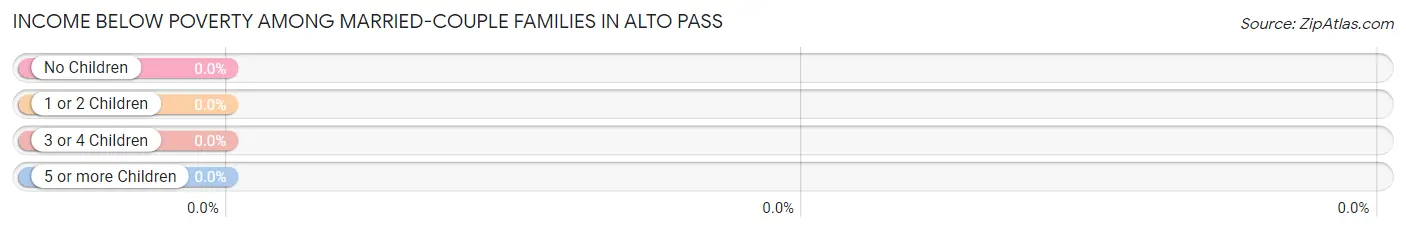
| Children | Above Poverty | Below Poverty |
| No Children | 42 (100.0%) | 0 (0.0%) |
| 1 or 2 Children | 22 (100.0%) | 0 (0.0%) |
| 3 or 4 Children | 7 (100.0%) | 0 (0.0%) |
| 5 or more Children | 0 (0.0%) | 0 (0.0%) |
| Total | 71 (100.0%) | 0 (0.0%) |
Income Below Poverty Among Single-Parent Households in Alto Pass
| Children | Single Father | Single Mother |
| No Children | 0 (0.0%) | 0 (0.0%) |
| 1 or 2 Children | 0 (0.0%) | 0 (0.0%) |
| 3 or 4 Children | 0 (0.0%) | 0 (0.0%) |
| 5 or more Children | 0 (0.0%) | 0 (0.0%) |
| Total | 0 (0.0%) | 0 (0.0%) |
Income Below Poverty Among Married-Couple vs Single-Parent Households in Alto Pass
| Children | Married-Couple Families | Single-Parent Households |
| No Children | 0 (0.0%) | 0 (0.0%) |
| 1 or 2 Children | 0 (0.0%) | 0 (0.0%) |
| 3 or 4 Children | 0 (0.0%) | 0 (0.0%) |
| 5 or more Children | 0 (0.0%) | 0 (0.0%) |
| Total | 0 (0.0%) | 0 (0.0%) |
Race in Alto Pass
The most populous races in Alto Pass are White / Caucasian (331 | 86.9%), Hispanic or Latino (79 | 20.7%), and Two or more Races (38 | 10.0%).
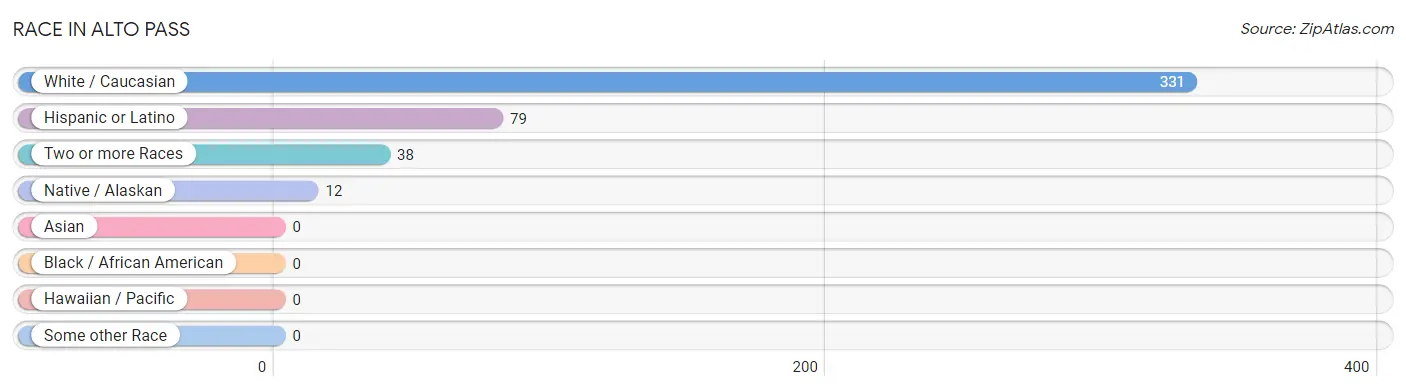
| Race | # Population | % Population |
| Asian | 0 | 0.0% |
| Black / African American | 0 | 0.0% |
| Hawaiian / Pacific | 0 | 0.0% |
| Hispanic or Latino | 79 | 20.7% |
| Native / Alaskan | 12 | 3.2% |
| White / Caucasian | 331 | 86.9% |
| Two or more Races | 38 | 10.0% |
| Some other Race | 0 | 0.0% |
| Total | 381 | 100.0% |
Ancestry in Alto Pass
The most populous ancestries reported in Alto Pass are Mexican (78 | 20.5%), English (48 | 12.6%), German (48 | 12.6%), Irish (38 | 10.0%), and European (29 | 7.6%), together accounting for 63.3% of all Alto Pass residents.
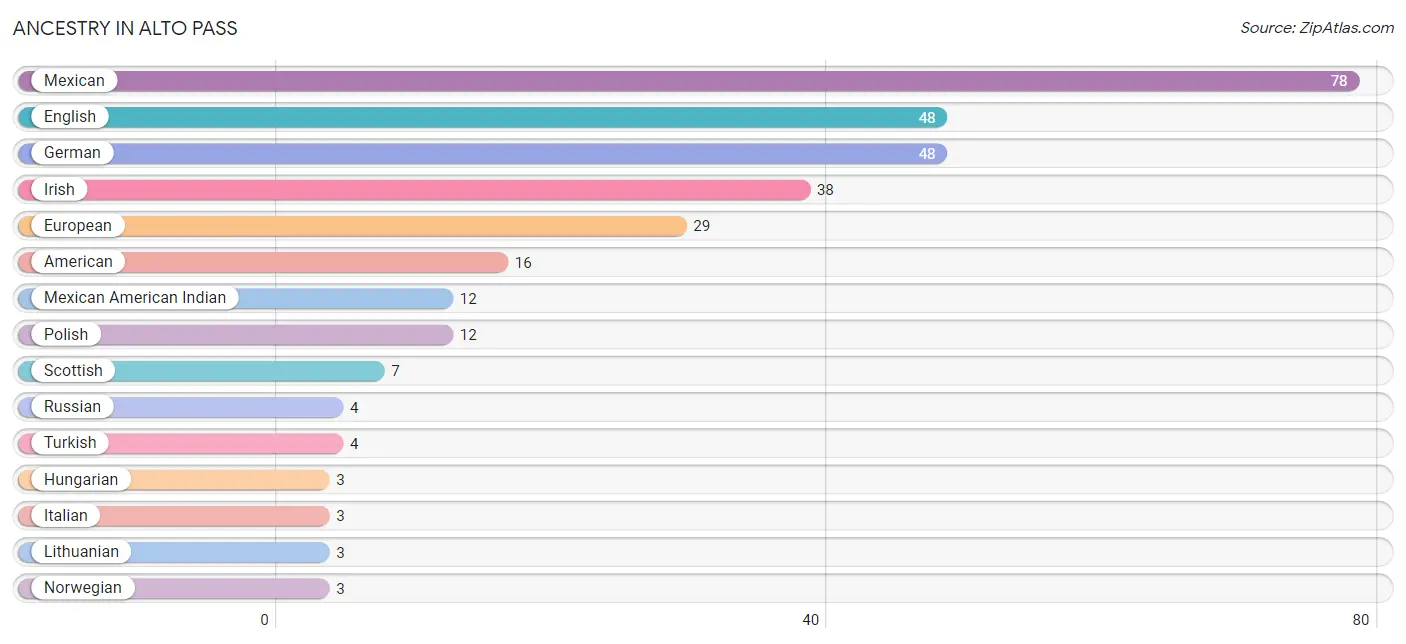
| Ancestry | # Population | % Population |
| American | 16 | 4.2% |
| Austrian | 2 | 0.5% |
| Canadian | 1 | 0.3% |
| Dutch | 2 | 0.5% |
| English | 48 | 12.6% |
| European | 29 | 7.6% |
| German | 48 | 12.6% |
| Hungarian | 3 | 0.8% |
| Irish | 38 | 10.0% |
| Italian | 3 | 0.8% |
| Lithuanian | 3 | 0.8% |
| Mexican | 78 | 20.5% |
| Mexican American Indian | 12 | 3.2% |
| Navajo | 1 | 0.3% |
| Norwegian | 3 | 0.8% |
| Polish | 12 | 3.2% |
| Russian | 4 | 1.1% |
| Scottish | 7 | 1.8% |
| Swedish | 2 | 0.5% |
| Turkish | 4 | 1.1% |
| Welsh | 2 | 0.5% | View All 21 Rows |
Immigrants in Alto Pass
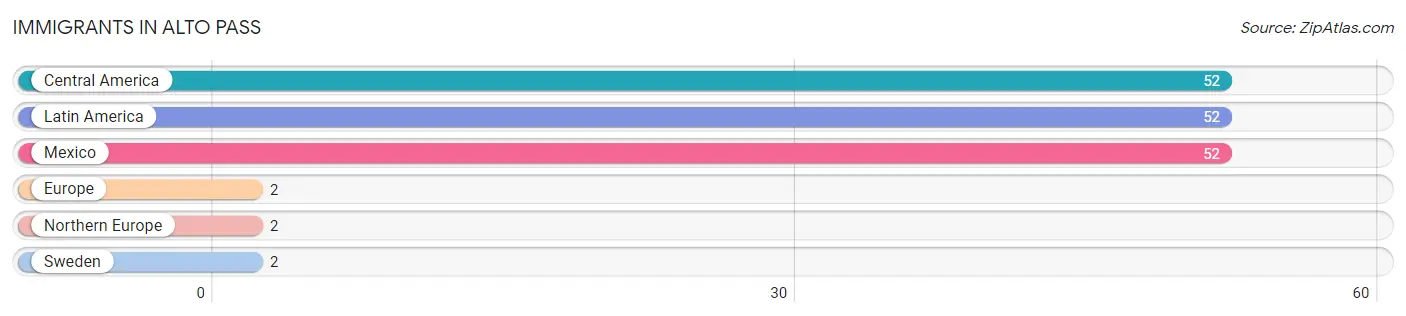
The most numerous immigrant groups reported in Alto Pass came from Central America (52 | 13.7%), Latin America (52 | 13.7%), Mexico (52 | 13.7%), Europe (2 | 0.5%), and Northern Europe (2 | 0.5%), together accounting for 42.0% of all Alto Pass residents.
| Immigration Origin | # Population | % Population |
| Central America | 52 | 13.7% |
| Europe | 2 | 0.5% |
| Latin America | 52 | 13.7% |
| Mexico | 52 | 13.7% |
| Northern Europe | 2 | 0.5% |
| Sweden | 2 | 0.5% | View All 6 Rows |
Sex and Age in Alto Pass
Sex and Age in Alto Pass
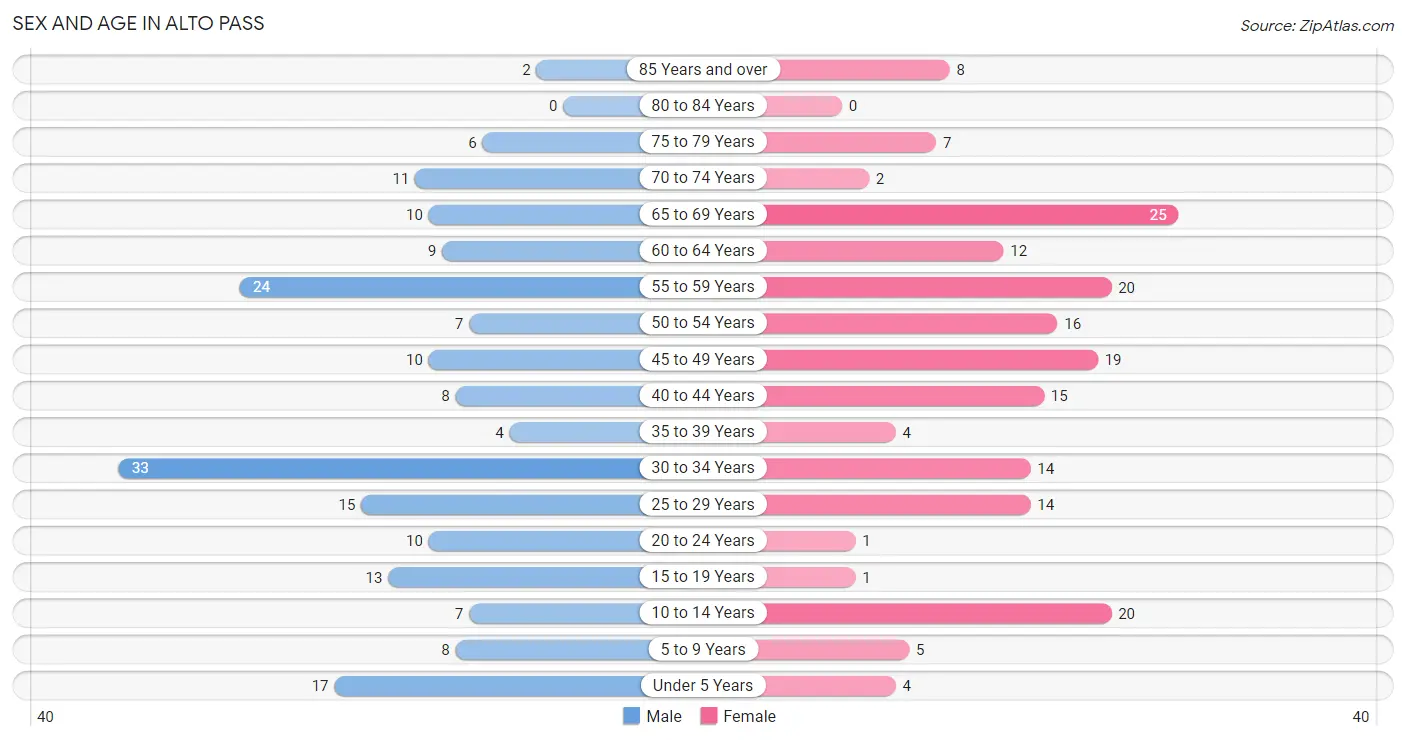
The most populous age groups in Alto Pass are 30 to 34 Years (33 | 17.0%) for men and 65 to 69 Years (25 | 13.4%) for women.
| Age Bracket | Male | Female |
| Under 5 Years | 17 (8.8%) | 4 (2.1%) |
| 5 to 9 Years | 8 (4.1%) | 5 (2.7%) |
| 10 to 14 Years | 7 (3.6%) | 20 (10.7%) |
| 15 to 19 Years | 13 (6.7%) | 1 (0.5%) |
| 20 to 24 Years | 10 (5.1%) | 1 (0.5%) |
| 25 to 29 Years | 15 (7.7%) | 14 (7.5%) |
| 30 to 34 Years | 33 (17.0%) | 14 (7.5%) |
| 35 to 39 Years | 4 (2.1%) | 4 (2.1%) |
| 40 to 44 Years | 8 (4.1%) | 15 (8.0%) |
| 45 to 49 Years | 10 (5.1%) | 19 (10.2%) |
| 50 to 54 Years | 7 (3.6%) | 16 (8.6%) |
| 55 to 59 Years | 24 (12.4%) | 20 (10.7%) |
| 60 to 64 Years | 9 (4.6%) | 12 (6.4%) |
| 65 to 69 Years | 10 (5.1%) | 25 (13.4%) |
| 70 to 74 Years | 11 (5.7%) | 2 (1.1%) |
| 75 to 79 Years | 6 (3.1%) | 7 (3.7%) |
| 80 to 84 Years | 0 (0.0%) | 0 (0.0%) |
| 85 Years and over | 2 (1.0%) | 8 (4.3%) |
| Total | 194 (100.0%) | 187 (100.0%) |
Families and Households in Alto Pass
Median Family Size in Alto Pass
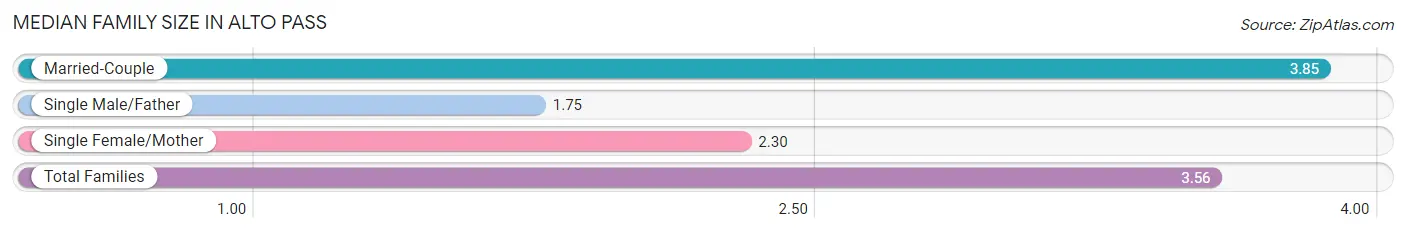
The median family size in Alto Pass is 3.56 persons per family, with married-couple families (71 | 83.5%) accounting for the largest median family size of 3.85 persons per family. On the other hand, single male/father families (4 | 4.7%) represent the smallest median family size with 1.75 persons per family.
| Family Type | # Families | Family Size |
| Married-Couple | 71 (83.5%) | 3.85 |
| Single Male/Father | 4 (4.7%) | 1.75 |
| Single Female/Mother | 10 (11.8%) | 2.30 |
| Total Families | 85 (100.0%) | 3.56 |
Median Household Size in Alto Pass
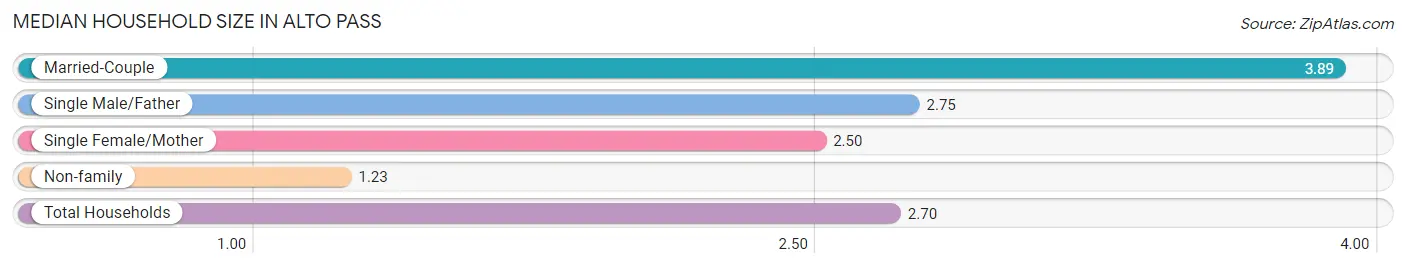
The median household size in Alto Pass is 2.70 persons per household, with married-couple households (71 | 50.3%) accounting for the largest median household size of 3.89 persons per household. non-family households (56 | 39.7%) represent the smallest median household size with 1.23 persons per household.
| Household Type | # Households | Household Size |
| Married-Couple | 71 (50.3%) | 3.89 |
| Single Male/Father | 4 (2.8%) | 2.75 |
| Single Female/Mother | 10 (7.1%) | 2.50 |
| Non-family | 56 (39.7%) | 1.23 |
| Total Households | 141 (100.0%) | 2.70 |
Household Size by Marriage Status in Alto Pass
Out of a total of 141 households in Alto Pass, 85 (60.3%) are family households, while 56 (39.7%) are nonfamily households. The most numerous type of family households are 2-person households, comprising 34, and the most common type of nonfamily households are 1-person households, comprising 47.
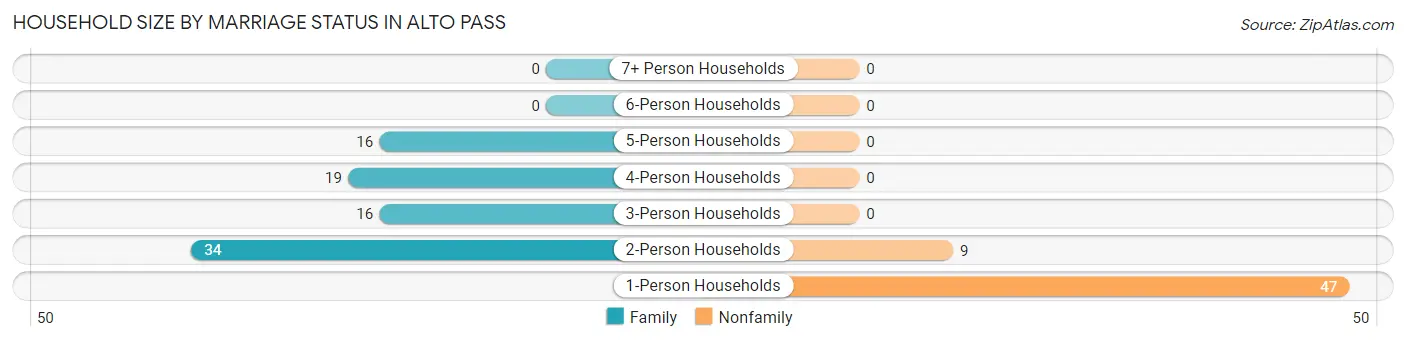
| Household Size | Family Households | Nonfamily Households |
| 1-Person Households | - | 47 (33.3%) |
| 2-Person Households | 34 (24.1%) | 9 (6.4%) |
| 3-Person Households | 16 (11.4%) | 0 (0.0%) |
| 4-Person Households | 19 (13.5%) | 0 (0.0%) |
| 5-Person Households | 16 (11.4%) | 0 (0.0%) |
| 6-Person Households | 0 (0.0%) | 0 (0.0%) |
| 7+ Person Households | 0 (0.0%) | 0 (0.0%) |
| Total | 85 (60.3%) | 56 (39.7%) |
Female Fertility in Alto Pass
Fertility by Age in Alto Pass
Average fertility rate in Alto Pass is 58.0 births per 1,000 women. Women in the age bracket of 20 to 34 years have the highest fertility rate with 138.0 births per 1,000 women. Women in the age bracket of 20 to 34 years acount for 100.0% of all women with births.
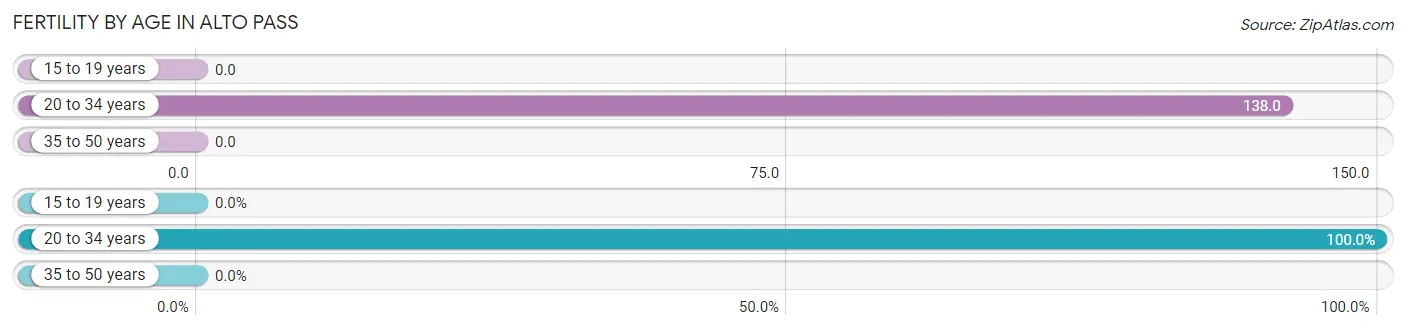
| Age Bracket | Women with Births | Births / 1,000 Women |
| 15 to 19 years | 0 (0.0%) | 0.0 |
| 20 to 34 years | 4 (100.0%) | 138.0 |
| 35 to 50 years | 0 (0.0%) | 0.0 |
| Total | 4 (100.0%) | 58.0 |
Fertility by Age by Marriage Status in Alto Pass
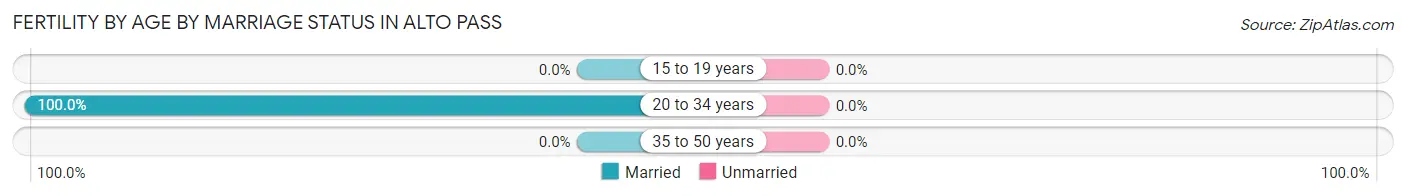
| Age Bracket | Married | Unmarried |
| 15 to 19 years | 0 (0.0%) | 0 (0.0%) |
| 20 to 34 years | 4 (100.0%) | 0 (0.0%) |
| 35 to 50 years | 0 (0.0%) | 0 (0.0%) |
| Total | 4 (100.0%) | 0 (0.0%) |
Fertility by Education in Alto Pass
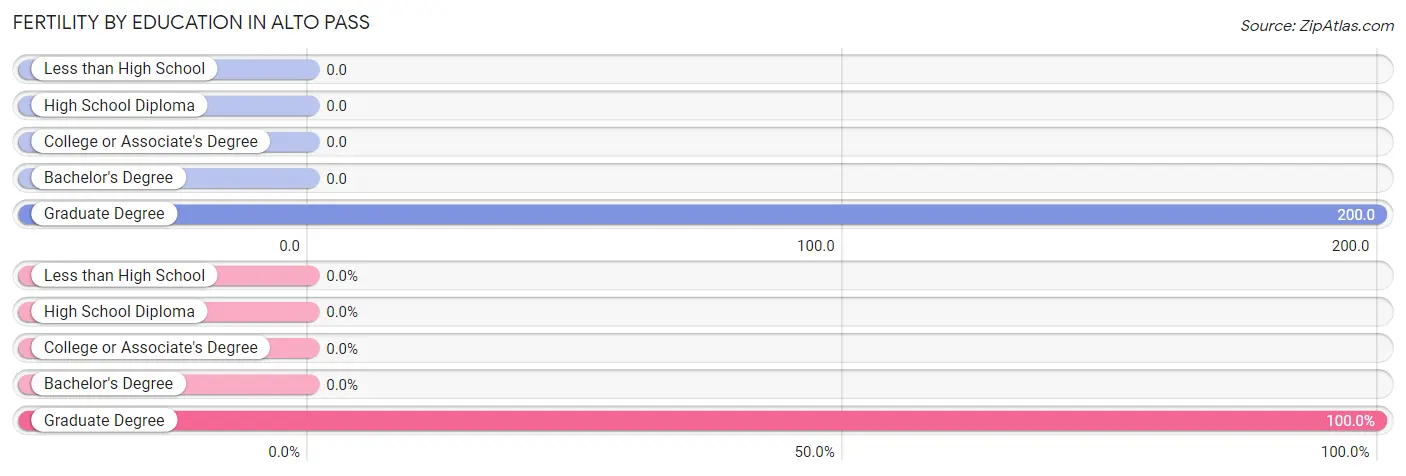
| Educational Attainment | Women with Births | Births / 1,000 Women |
| Less than High School | 0 (0.0%) | 0.0 |
| High School Diploma | 0 (0.0%) | 0.0 |
| College or Associate's Degree | 0 (0.0%) | 0.0 |
| Bachelor's Degree | 0 (0.0%) | 0.0 |
| Graduate Degree | 4 (100.0%) | 200.0 |
| Total | 4 (100.0%) | 58.0 |
Fertility by Education by Marriage Status in Alto Pass
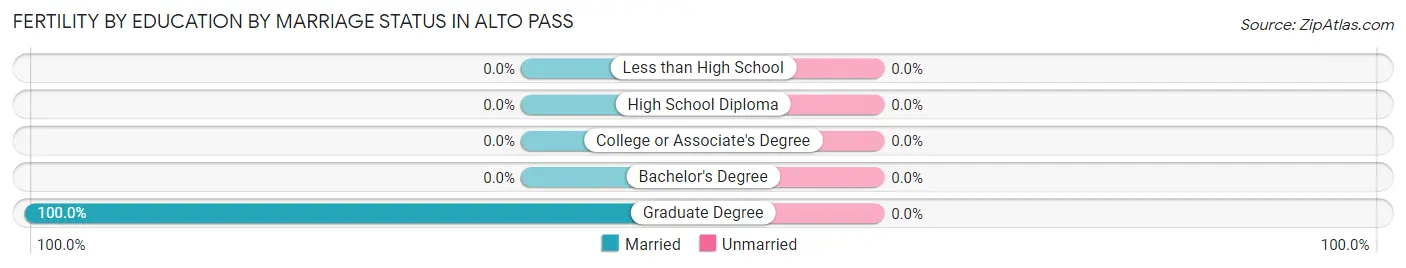
| Educational Attainment | Married | Unmarried |
| Less than High School | 0 (0.0%) | 0 (0.0%) |
| High School Diploma | 0 (0.0%) | 0 (0.0%) |
| College or Associate's Degree | 0 (0.0%) | 0 (0.0%) |
| Bachelor's Degree | 0 (0.0%) | 0 (0.0%) |
| Graduate Degree | 4 (100.0%) | 0 (0.0%) |
| Total | 4 (100.0%) | 0 (0.0%) |
Employment Characteristics in Alto Pass
Employment by Class of Employer in Alto Pass
Among the 176 employed individuals in Alto Pass, private company employees (85 | 48.3%), state government employees (35 | 19.9%), and local government employees (28 | 15.9%) make up the most common classes of employment.
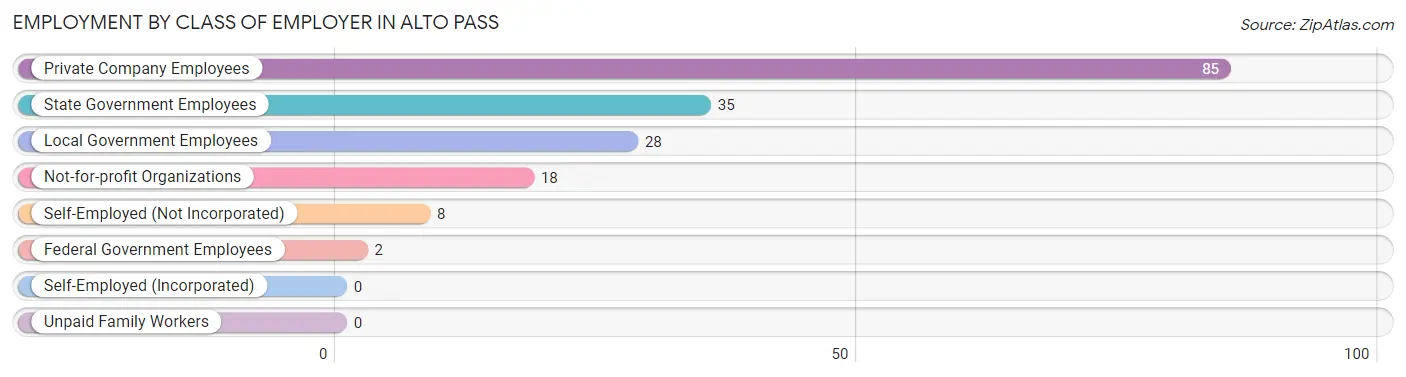
| Employer Class | # Employees | % Employees |
| Private Company Employees | 85 | 48.3% |
| Self-Employed (Incorporated) | 0 | 0.0% |
| Self-Employed (Not Incorporated) | 8 | 4.5% |
| Not-for-profit Organizations | 18 | 10.2% |
| Local Government Employees | 28 | 15.9% |
| State Government Employees | 35 | 19.9% |
| Federal Government Employees | 2 | 1.1% |
| Unpaid Family Workers | 0 | 0.0% |
| Total | 176 | 100.0% |
Employment Status by Age in Alto Pass
According to the labor force statistics for Alto Pass, out of the total population over 16 years of age (311), 59.5% or 185 individuals are in the labor force, with 4.9% or 9 of them unemployed. The age group with the highest labor force participation rate is 35 to 44 years, with 96.8% or 30 individuals in the labor force. Within the labor force, the 16 to 19 years age range has the highest percentage of unemployed individuals, with 100.0% or 2 of them being unemployed.
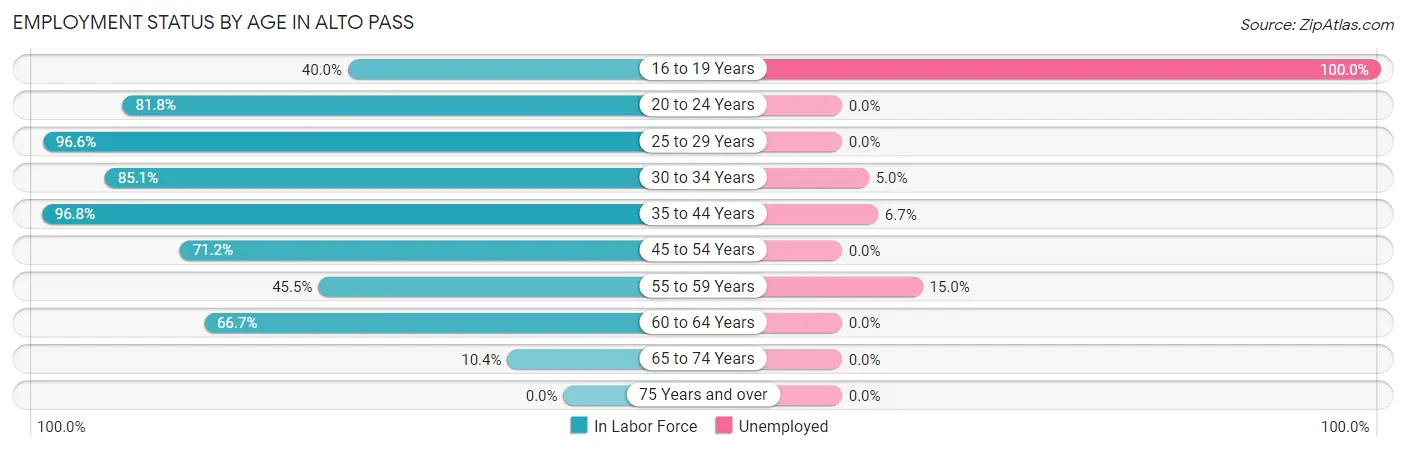
| Age Bracket | In Labor Force | Unemployed |
| 16 to 19 Years | 2 (40.0%) | 2 (100.0%) |
| 20 to 24 Years | 9 (81.8%) | 0 (0.0%) |
| 25 to 29 Years | 28 (96.6%) | 0 (0.0%) |
| 30 to 34 Years | 40 (85.1%) | 2 (5.0%) |
| 35 to 44 Years | 30 (96.8%) | 2 (6.7%) |
| 45 to 54 Years | 37 (71.2%) | 0 (0.0%) |
| 55 to 59 Years | 20 (45.5%) | 3 (15.0%) |
| 60 to 64 Years | 14 (66.7%) | 0 (0.0%) |
| 65 to 74 Years | 5 (10.4%) | 0 (0.0%) |
| 75 Years and over | 0 (0.0%) | 0 (0.0%) |
| Total | 185 (59.5%) | 9 (4.9%) |
Employment Status by Educational Attainment in Alto Pass
According to labor force statistics for Alto Pass, 75.4% of individuals (169) out of the total population between 25 and 64 years of age (224) are in the labor force, with 4.1% or 7 of them being unemployed. The group with the highest labor force participation rate are those with the educational attainment of college / associate degree, with 89.3% or 67 individuals in the labor force. Within the labor force, individuals with high school diploma education have the highest percentage of unemployment, with 5.9% or 2 of them being unemployed.
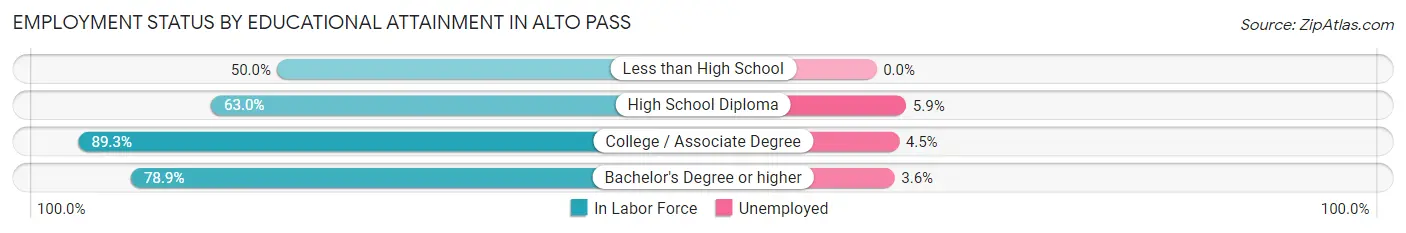
| Educational Attainment | In Labor Force | Unemployed |
| Less than High School | 12 (50.0%) | 0 (0.0%) |
| High School Diploma | 34 (63.0%) | 3 (5.9%) |
| College / Associate Degree | 67 (89.3%) | 3 (4.5%) |
| Bachelor's Degree or higher | 56 (78.9%) | 3 (3.6%) |
| Total | 169 (75.4%) | 9 (4.1%) |
Employment Occupations by Sex in Alto Pass
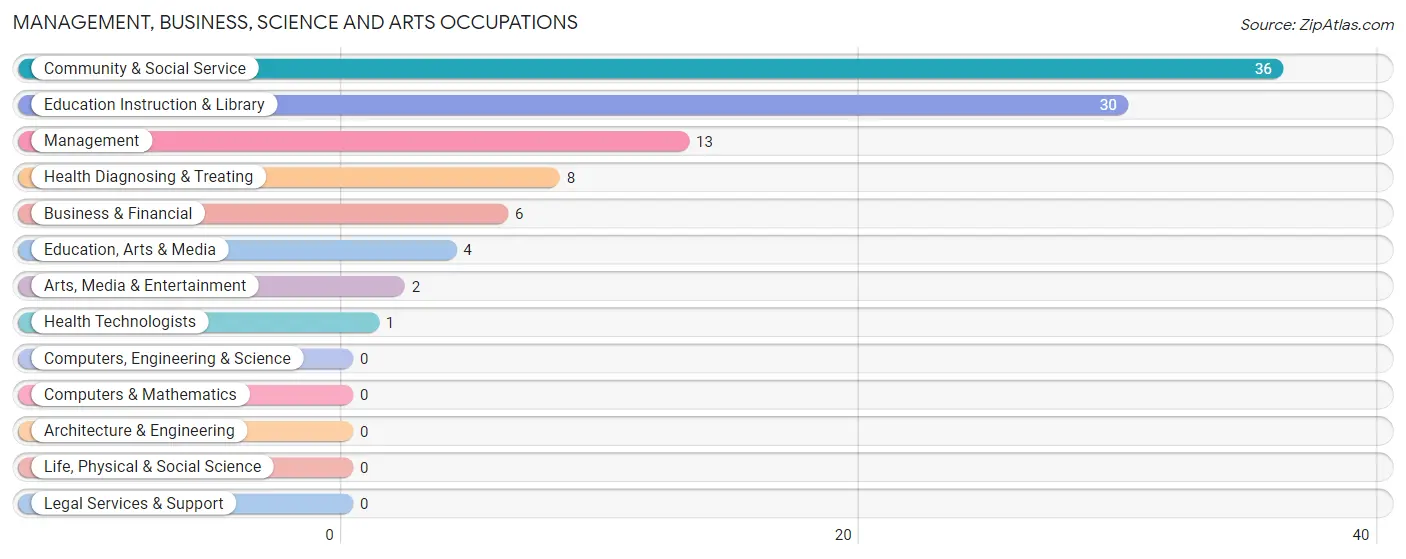
Management, Business, Science and Arts Occupations
The most common Management, Business, Science and Arts occupations in Alto Pass are Community & Social Service (36 | 20.4%), Education Instruction & Library (30 | 17.1%), Management (13 | 7.4%), Health Diagnosing & Treating (8 | 4.5%), and Business & Financial (6 | 3.4%).
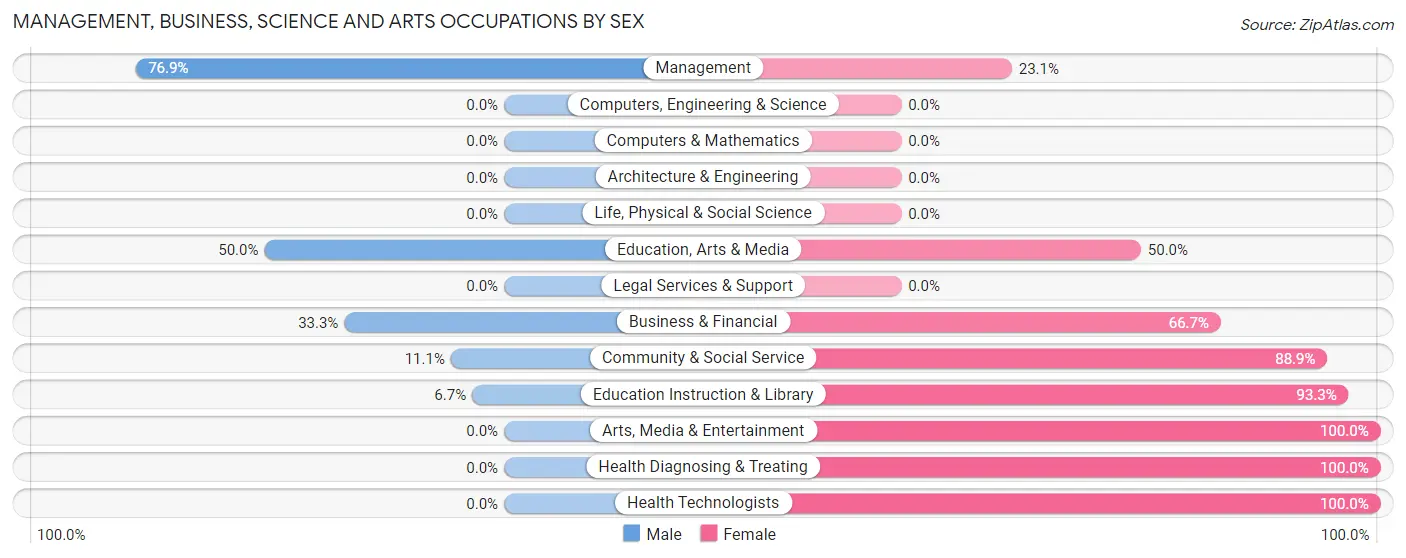
Management, Business, Science and Arts Occupations by Sex
Within the Management, Business, Science and Arts occupations in Alto Pass, the most male-oriented occupations are Management (76.9%), Education, Arts & Media (50.0%), and Business & Financial (33.3%), while the most female-oriented occupations are Arts, Media & Entertainment (100.0%), Health Diagnosing & Treating (100.0%), and Health Technologists (100.0%).
| Occupation | Male | Female |
| Management | 10 (76.9%) | 3 (23.1%) |
| Business & Financial | 2 (33.3%) | 4 (66.7%) |
| Computers, Engineering & Science | 0 (0.0%) | 0 (0.0%) |
| Computers & Mathematics | 0 (0.0%) | 0 (0.0%) |
| Architecture & Engineering | 0 (0.0%) | 0 (0.0%) |
| Life, Physical & Social Science | 0 (0.0%) | 0 (0.0%) |
| Community & Social Service | 4 (11.1%) | 32 (88.9%) |
| Education, Arts & Media | 2 (50.0%) | 2 (50.0%) |
| Legal Services & Support | 0 (0.0%) | 0 (0.0%) |
| Education Instruction & Library | 2 (6.7%) | 28 (93.3%) |
| Arts, Media & Entertainment | 0 (0.0%) | 2 (100.0%) |
| Health Diagnosing & Treating | 0 (0.0%) | 8 (100.0%) |
| Health Technologists | 0 (0.0%) | 1 (100.0%) |
| Total (Category) | 16 (25.4%) | 47 (74.6%) |
| Total (Overall) | 94 (53.4%) | 82 (46.6%) |
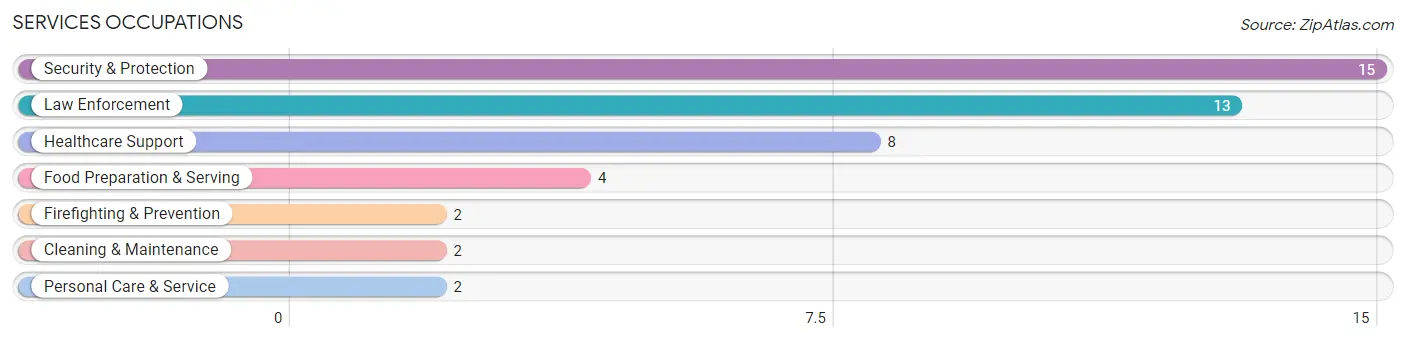
Services Occupations
The most common Services occupations in Alto Pass are Security & Protection (15 | 8.5%), Law Enforcement (13 | 7.4%), Healthcare Support (8 | 4.5%), Food Preparation & Serving (4 | 2.3%), and Firefighting & Prevention (2 | 1.1%).
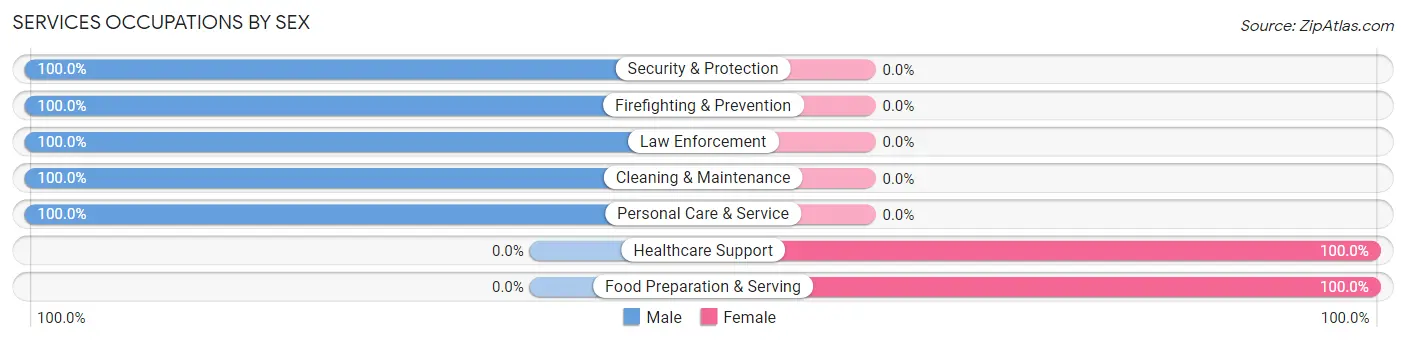
Services Occupations by Sex
Within the Services occupations in Alto Pass, the most male-oriented occupations are Security & Protection (100.0%), Firefighting & Prevention (100.0%), and Law Enforcement (100.0%), while the most female-oriented occupations are Healthcare Support (100.0%), and Food Preparation & Serving (100.0%).
| Occupation | Male | Female |
| Healthcare Support | 0 (0.0%) | 8 (100.0%) |
| Security & Protection | 15 (100.0%) | 0 (0.0%) |
| Firefighting & Prevention | 2 (100.0%) | 0 (0.0%) |
| Law Enforcement | 13 (100.0%) | 0 (0.0%) |
| Food Preparation & Serving | 0 (0.0%) | 4 (100.0%) |
| Cleaning & Maintenance | 2 (100.0%) | 0 (0.0%) |
| Personal Care & Service | 2 (100.0%) | 0 (0.0%) |
| Total (Category) | 19 (61.3%) | 12 (38.7%) |
| Total (Overall) | 94 (53.4%) | 82 (46.6%) |
Sales and Office Occupations
The most common Sales and Office occupations in Alto Pass are Office & Administration (14 | 8.0%), and Sales & Related (13 | 7.4%).
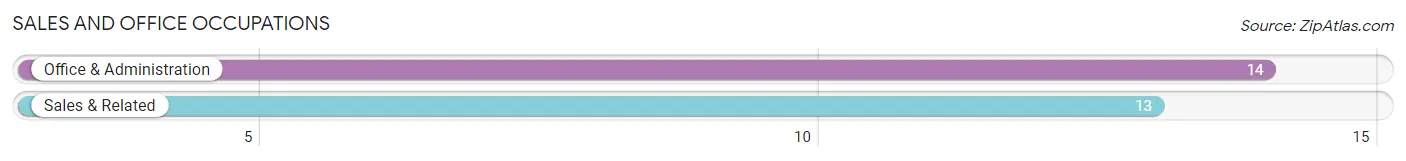
Sales and Office Occupations by Sex
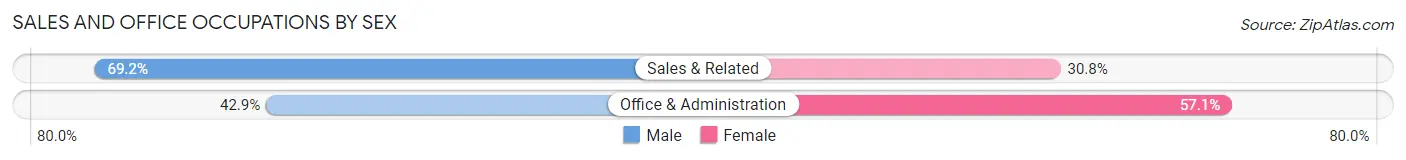
| Occupation | Male | Female |
| Sales & Related | 9 (69.2%) | 4 (30.8%) |
| Office & Administration | 6 (42.9%) | 8 (57.1%) |
| Total (Category) | 15 (55.6%) | 12 (44.4%) |
| Total (Overall) | 94 (53.4%) | 82 (46.6%) |
Natural Resources, Construction and Maintenance Occupations
The most common Natural Resources, Construction and Maintenance occupations in Alto Pass are Installation, Maintenance & Repair (18 | 10.2%), Construction & Extraction (6 | 3.4%), and Farming, Fishing & Forestry (5 | 2.8%).
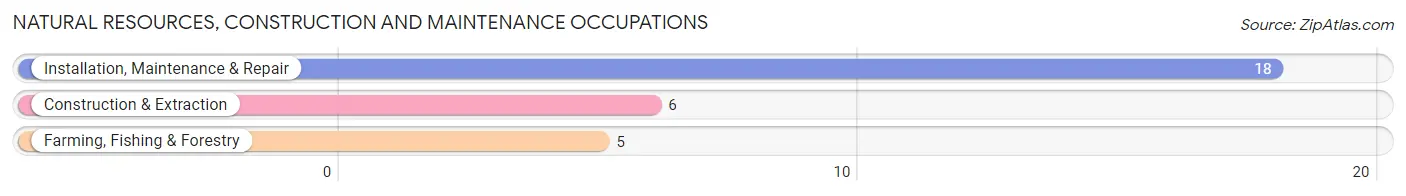
Natural Resources, Construction and Maintenance Occupations by Sex
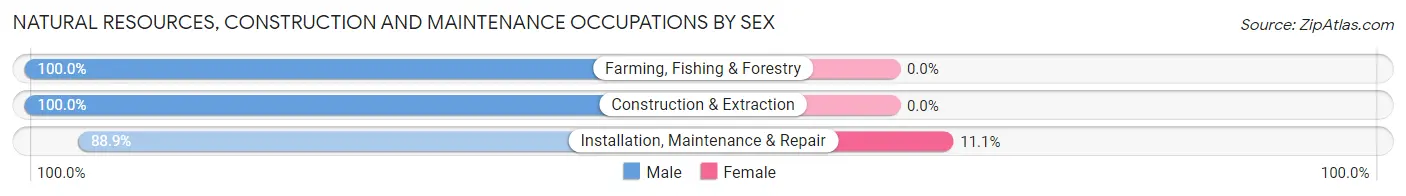
| Occupation | Male | Female |
| Farming, Fishing & Forestry | 5 (100.0%) | 0 (0.0%) |
| Construction & Extraction | 6 (100.0%) | 0 (0.0%) |
| Installation, Maintenance & Repair | 16 (88.9%) | 2 (11.1%) |
| Total (Category) | 27 (93.1%) | 2 (6.9%) |
| Total (Overall) | 94 (53.4%) | 82 (46.6%) |
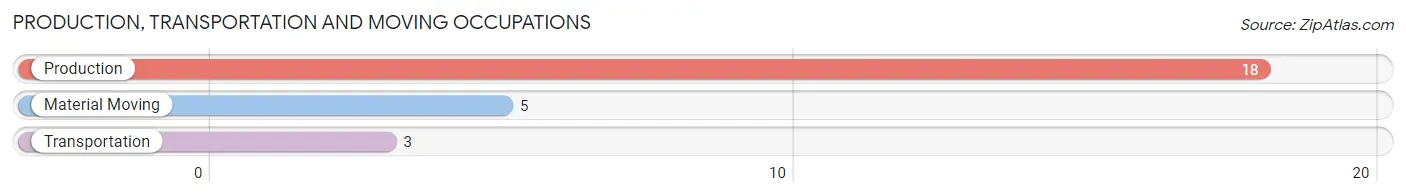
Production, Transportation and Moving Occupations
The most common Production, Transportation and Moving occupations in Alto Pass are Production (18 | 10.2%), Material Moving (5 | 2.8%), and Transportation (3 | 1.7%).
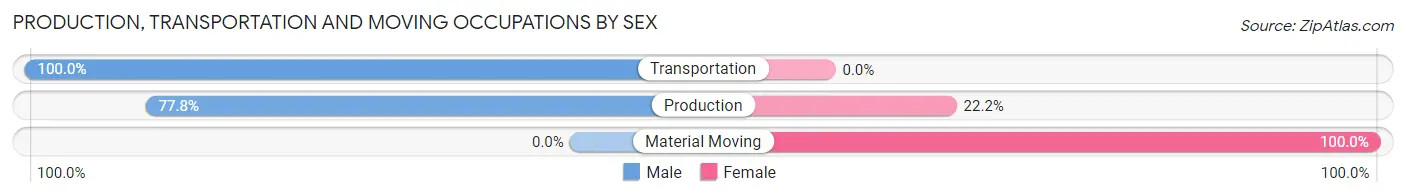
Production, Transportation and Moving Occupations by Sex
| Occupation | Male | Female |
| Production | 14 (77.8%) | 4 (22.2%) |
| Transportation | 3 (100.0%) | 0 (0.0%) |
| Material Moving | 0 (0.0%) | 5 (100.0%) |
| Total (Category) | 17 (65.4%) | 9 (34.6%) |
| Total (Overall) | 94 (53.4%) | 82 (46.6%) |
Employment Industries by Sex in Alto Pass
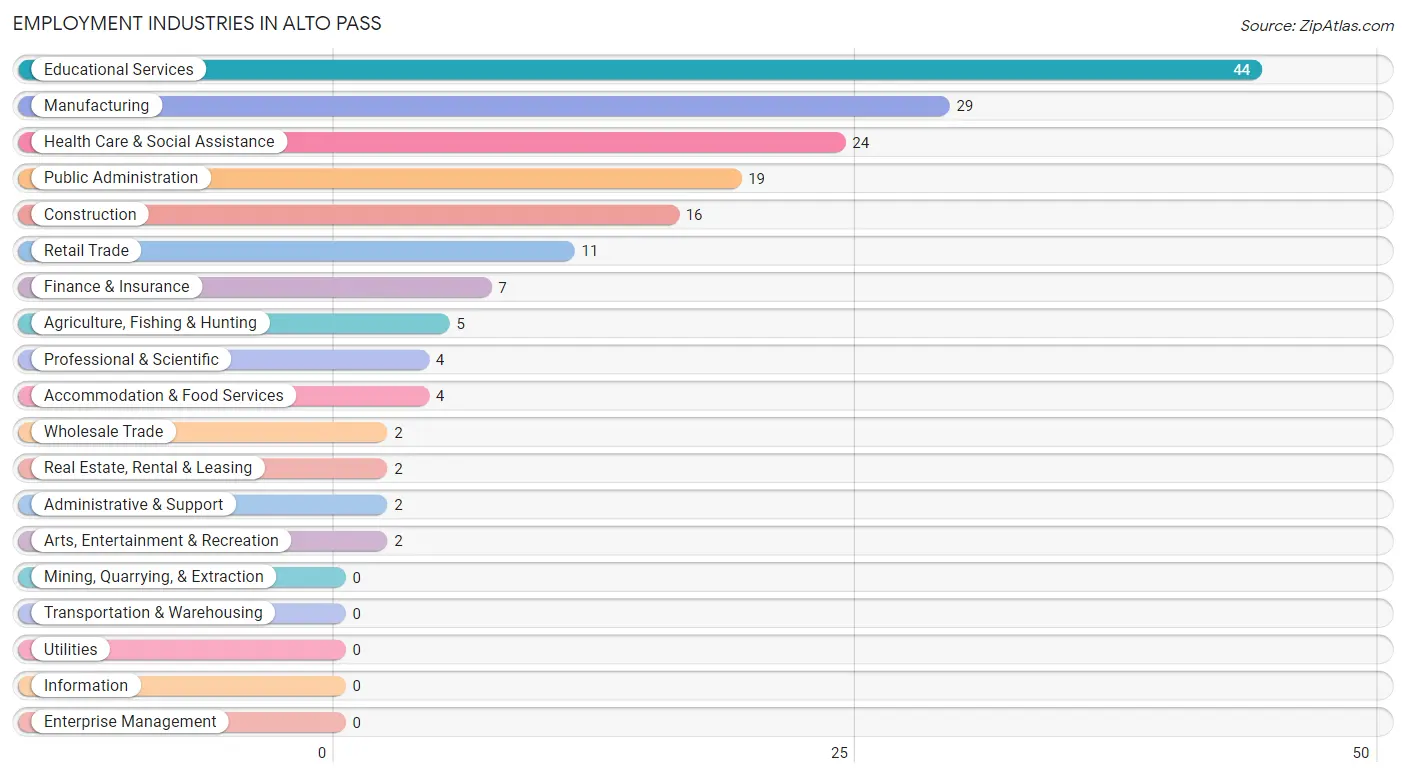
Employment Industries in Alto Pass
The major employment industries in Alto Pass include Educational Services (44 | 25.0%), Manufacturing (29 | 16.5%), Health Care & Social Assistance (24 | 13.6%), Public Administration (19 | 10.8%), and Construction (16 | 9.1%).
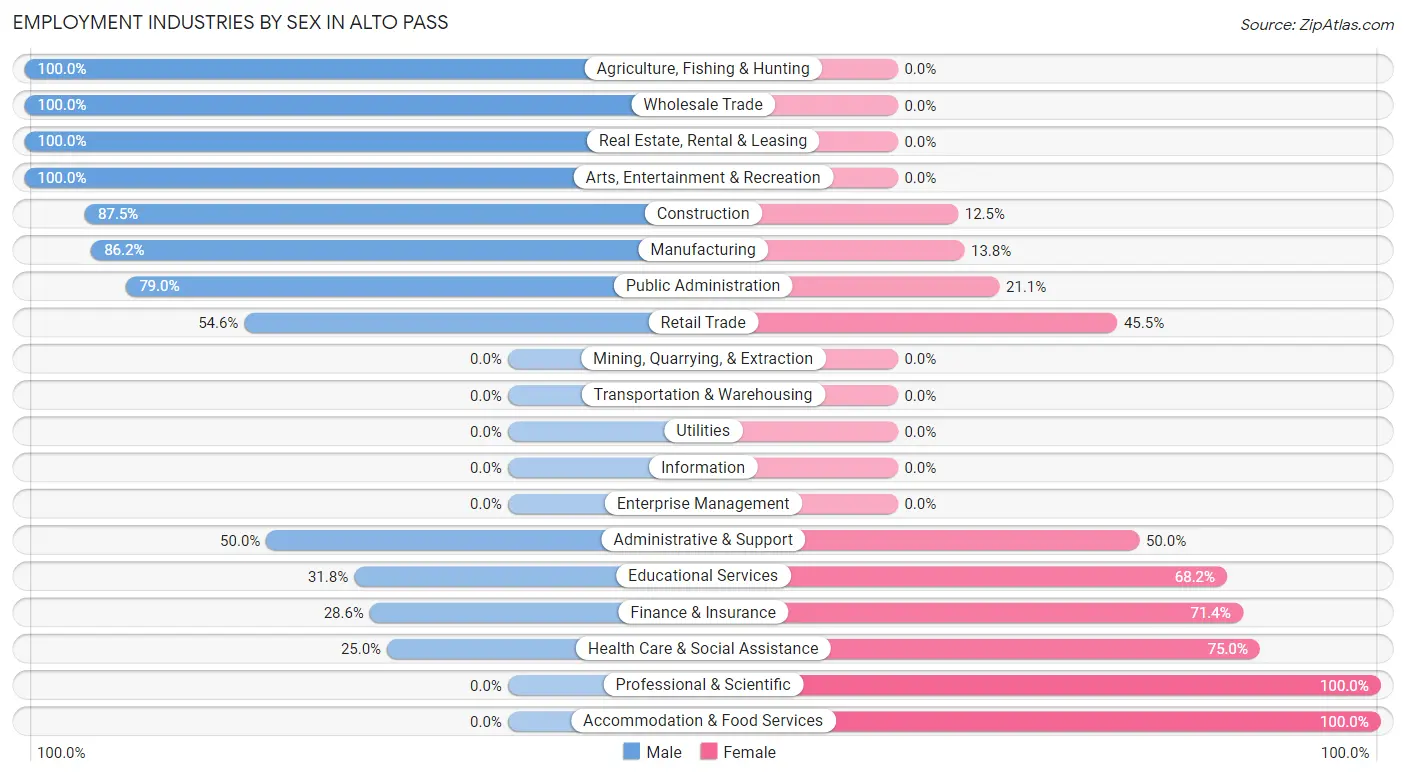
Employment Industries by Sex in Alto Pass
The Alto Pass industries that see more men than women are Agriculture, Fishing & Hunting (100.0%), Wholesale Trade (100.0%), and Real Estate, Rental & Leasing (100.0%), whereas the industries that tend to have a higher number of women are Professional & Scientific (100.0%), Accommodation & Food Services (100.0%), and Health Care & Social Assistance (75.0%).
| Industry | Male | Female |
| Agriculture, Fishing & Hunting | 5 (100.0%) | 0 (0.0%) |
| Mining, Quarrying, & Extraction | 0 (0.0%) | 0 (0.0%) |
| Construction | 14 (87.5%) | 2 (12.5%) |
| Manufacturing | 25 (86.2%) | 4 (13.8%) |
| Wholesale Trade | 2 (100.0%) | 0 (0.0%) |
| Retail Trade | 6 (54.5%) | 5 (45.5%) |
| Transportation & Warehousing | 0 (0.0%) | 0 (0.0%) |
| Utilities | 0 (0.0%) | 0 (0.0%) |
| Information | 0 (0.0%) | 0 (0.0%) |
| Finance & Insurance | 2 (28.6%) | 5 (71.4%) |
| Real Estate, Rental & Leasing | 2 (100.0%) | 0 (0.0%) |
| Professional & Scientific | 0 (0.0%) | 4 (100.0%) |
| Enterprise Management | 0 (0.0%) | 0 (0.0%) |
| Administrative & Support | 1 (50.0%) | 1 (50.0%) |
| Educational Services | 14 (31.8%) | 30 (68.2%) |
| Health Care & Social Assistance | 6 (25.0%) | 18 (75.0%) |
| Arts, Entertainment & Recreation | 2 (100.0%) | 0 (0.0%) |
| Accommodation & Food Services | 0 (0.0%) | 4 (100.0%) |
| Public Administration | 15 (78.9%) | 4 (21.0%) |
| Total | 94 (53.4%) | 82 (46.6%) |
Education in Alto Pass
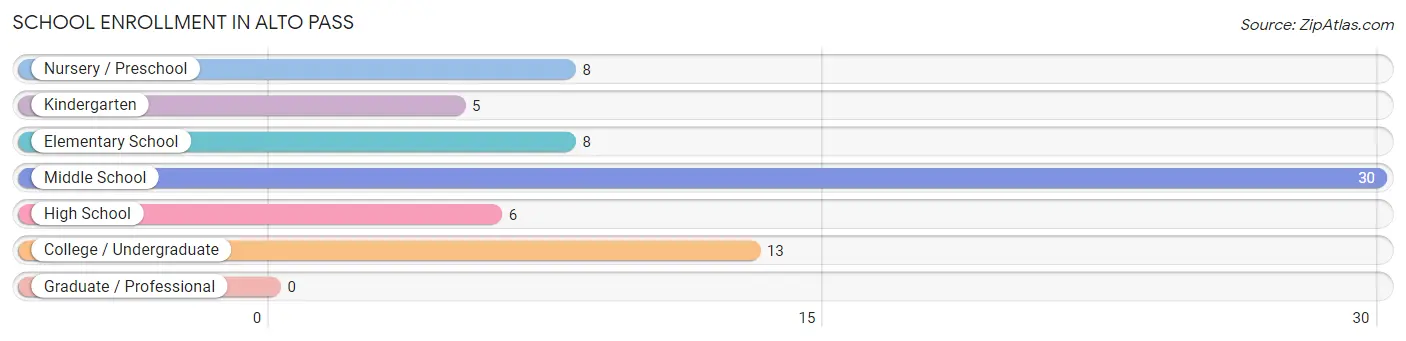
School Enrollment in Alto Pass
The most common levels of schooling among the 70 students in Alto Pass are middle school (30 | 42.9%), college / undergraduate (13 | 18.6%), and nursery / preschool (8 | 11.4%).
| School Level | # Students | % Students |
| Nursery / Preschool | 8 | 11.4% |
| Kindergarten | 5 | 7.1% |
| Elementary School | 8 | 11.4% |
| Middle School | 30 | 42.9% |
| High School | 6 | 8.6% |
| College / Undergraduate | 13 | 18.6% |
| Graduate / Professional | 0 | 0.0% |
| Total | 70 | 100.0% |
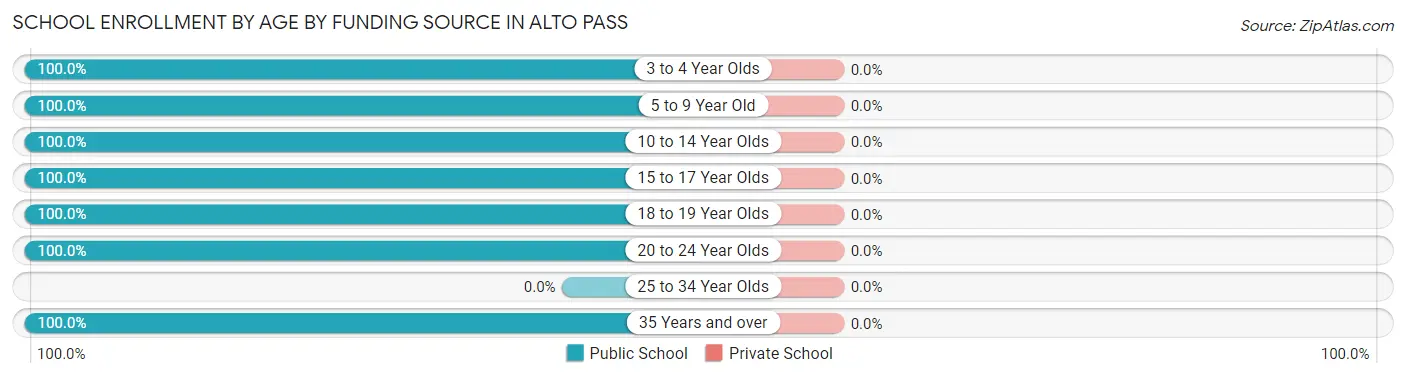
School Enrollment by Age by Funding Source in Alto Pass
| Age Bracket | Public School | Private School |
| 3 to 4 Year Olds | 8 (100.0%) | 0 (0.0%) |
| 5 to 9 Year Old | 13 (100.0%) | 0 (0.0%) |
| 10 to 14 Year Olds | 27 (100.0%) | 0 (0.0%) |
| 15 to 17 Year Olds | 9 (100.0%) | 0 (0.0%) |
| 18 to 19 Year Olds | 3 (100.0%) | 0 (0.0%) |
| 20 to 24 Year Olds | 8 (100.0%) | 0 (0.0%) |
| 25 to 34 Year Olds | 0 (0.0%) | 0 (0.0%) |
| 35 Years and over | 2 (100.0%) | 0 (0.0%) |
| Total | 70 (100.0%) | 0 (0.0%) |
Educational Attainment by Field of Study in Alto Pass
Education (36 | 32.7%), science & technology (19 | 17.3%), business (10 | 9.1%), engineering (9 | 8.2%), and arts & humanities (9 | 8.2%) are the most common fields of study among 110 individuals in Alto Pass who have obtained a bachelor's degree or higher.
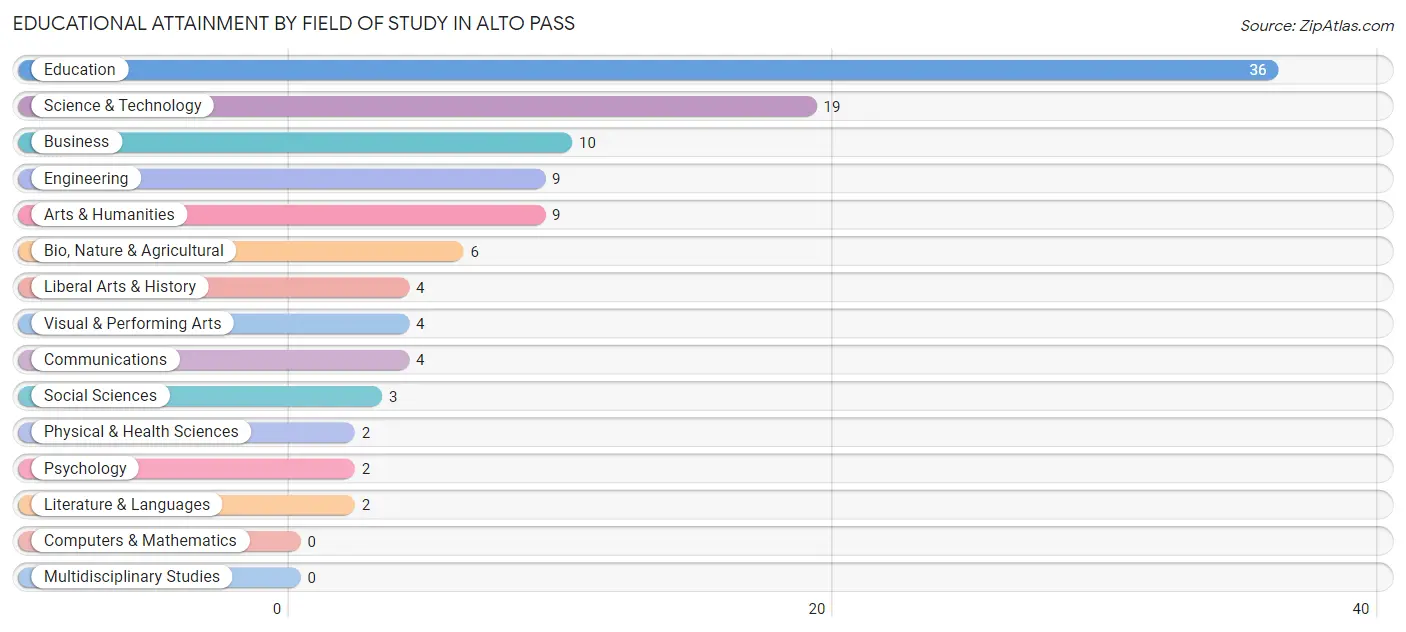
| Field of Study | # Graduates | % Graduates |
| Computers & Mathematics | 0 | 0.0% |
| Bio, Nature & Agricultural | 6 | 5.4% |
| Physical & Health Sciences | 2 | 1.8% |
| Psychology | 2 | 1.8% |
| Social Sciences | 3 | 2.7% |
| Engineering | 9 | 8.2% |
| Multidisciplinary Studies | 0 | 0.0% |
| Science & Technology | 19 | 17.3% |
| Business | 10 | 9.1% |
| Education | 36 | 32.7% |
| Literature & Languages | 2 | 1.8% |
| Liberal Arts & History | 4 | 3.6% |
| Visual & Performing Arts | 4 | 3.6% |
| Communications | 4 | 3.6% |
| Arts & Humanities | 9 | 8.2% |
| Total | 110 | 100.0% |
Transportation & Commute in Alto Pass
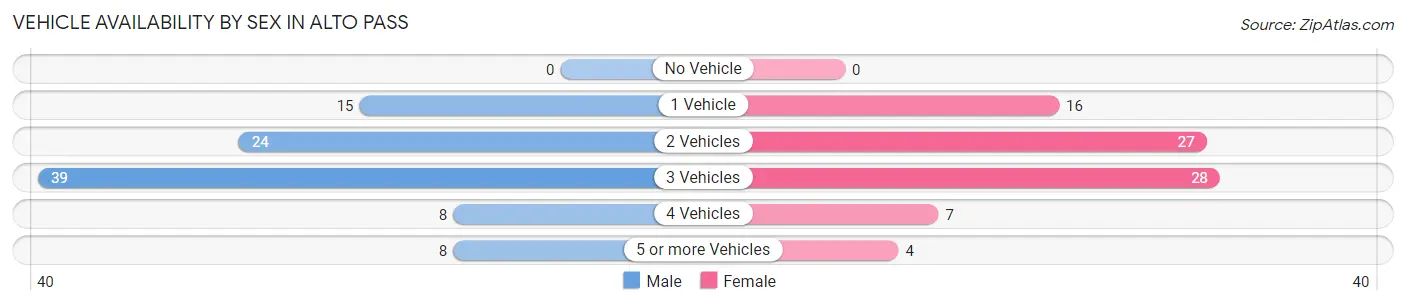
Vehicle Availability by Sex in Alto Pass
The most prevalent vehicle ownership categories in Alto Pass are males with 3 vehicles (39, accounting for 41.5%) and females with 3 vehicles (28, making up 47.6%).
| Vehicles Available | Male | Female |
| No Vehicle | 0 (0.0%) | 0 (0.0%) |
| 1 Vehicle | 15 (16.0%) | 16 (19.5%) |
| 2 Vehicles | 24 (25.5%) | 27 (32.9%) |
| 3 Vehicles | 39 (41.5%) | 28 (34.2%) |
| 4 Vehicles | 8 (8.5%) | 7 (8.5%) |
| 5 or more Vehicles | 8 (8.5%) | 4 (4.9%) |
| Total | 94 (100.0%) | 82 (100.0%) |
Commute Time in Alto Pass
The most frequently occuring commute durations in Alto Pass are 25 to 29 minutes (32 commuters, 19.3%), 20 to 24 minutes (30 commuters, 18.1%), and 45 to 59 minutes (27 commuters, 16.3%).
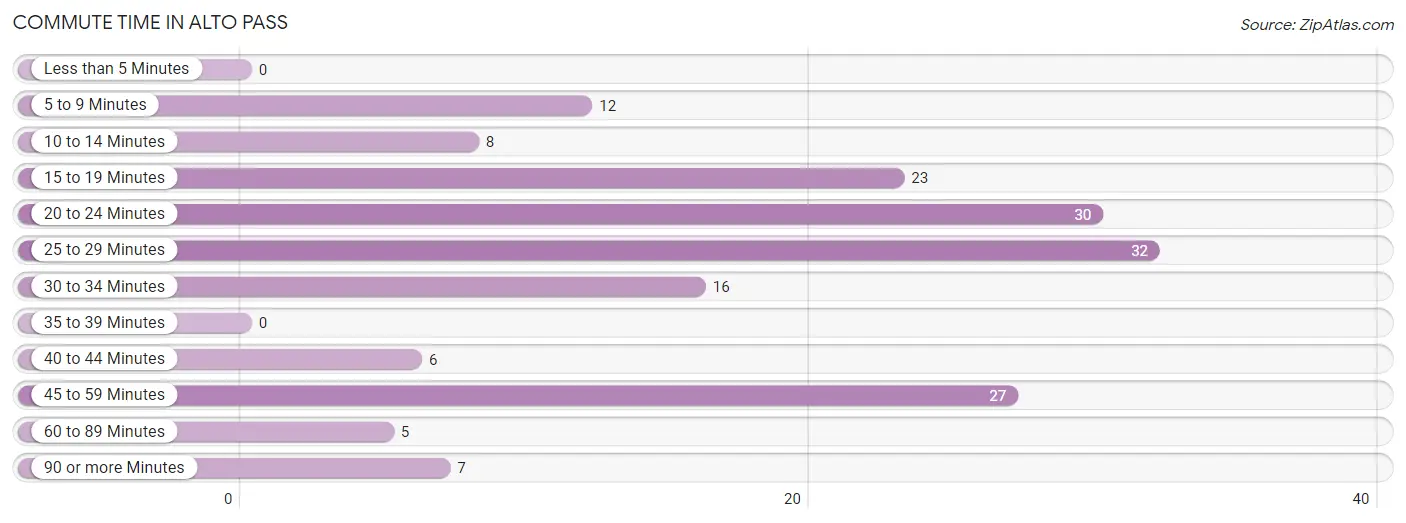
| Commute Time | # Commuters | % Commuters |
| Less than 5 Minutes | 0 | 0.0% |
| 5 to 9 Minutes | 12 | 7.2% |
| 10 to 14 Minutes | 8 | 4.8% |
| 15 to 19 Minutes | 23 | 13.9% |
| 20 to 24 Minutes | 30 | 18.1% |
| 25 to 29 Minutes | 32 | 19.3% |
| 30 to 34 Minutes | 16 | 9.6% |
| 35 to 39 Minutes | 0 | 0.0% |
| 40 to 44 Minutes | 6 | 3.6% |
| 45 to 59 Minutes | 27 | 16.3% |
| 60 to 89 Minutes | 5 | 3.0% |
| 90 or more Minutes | 7 | 4.2% |
Commute Time by Sex in Alto Pass
The most common commute times in Alto Pass are 45 to 59 minutes (22 commuters, 24.4%) for males and 25 to 29 minutes (23 commuters, 30.3%) for females.
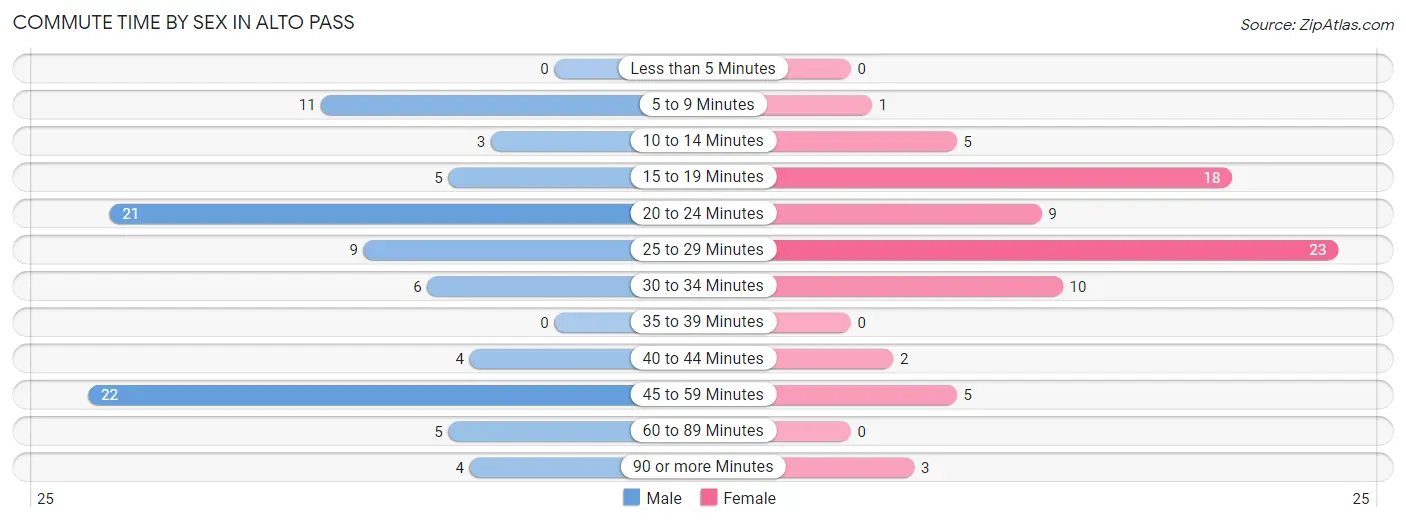
| Commute Time | Male | Female |
| Less than 5 Minutes | 0 (0.0%) | 0 (0.0%) |
| 5 to 9 Minutes | 11 (12.2%) | 1 (1.3%) |
| 10 to 14 Minutes | 3 (3.3%) | 5 (6.6%) |
| 15 to 19 Minutes | 5 (5.6%) | 18 (23.7%) |
| 20 to 24 Minutes | 21 (23.3%) | 9 (11.8%) |
| 25 to 29 Minutes | 9 (10.0%) | 23 (30.3%) |
| 30 to 34 Minutes | 6 (6.7%) | 10 (13.2%) |
| 35 to 39 Minutes | 0 (0.0%) | 0 (0.0%) |
| 40 to 44 Minutes | 4 (4.4%) | 2 (2.6%) |
| 45 to 59 Minutes | 22 (24.4%) | 5 (6.6%) |
| 60 to 89 Minutes | 5 (5.6%) | 0 (0.0%) |
| 90 or more Minutes | 4 (4.4%) | 3 (4.0%) |
Time of Departure to Work by Sex in Alto Pass
The most frequent times of departure to work in Alto Pass are 7:30 AM to 7:59 AM (16, 17.8%) for males and 7:30 AM to 7:59 AM (26, 34.2%) for females.
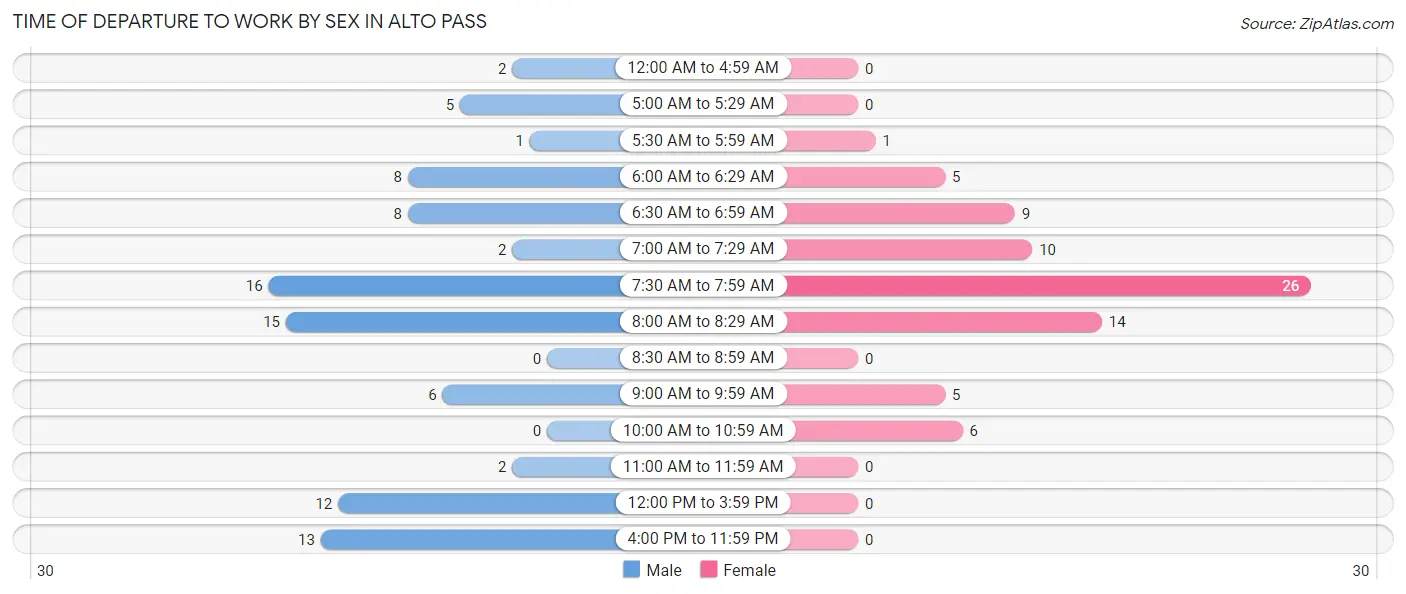
| Time of Departure | Male | Female |
| 12:00 AM to 4:59 AM | 2 (2.2%) | 0 (0.0%) |
| 5:00 AM to 5:29 AM | 5 (5.6%) | 0 (0.0%) |
| 5:30 AM to 5:59 AM | 1 (1.1%) | 1 (1.3%) |
| 6:00 AM to 6:29 AM | 8 (8.9%) | 5 (6.6%) |
| 6:30 AM to 6:59 AM | 8 (8.9%) | 9 (11.8%) |
| 7:00 AM to 7:29 AM | 2 (2.2%) | 10 (13.2%) |
| 7:30 AM to 7:59 AM | 16 (17.8%) | 26 (34.2%) |
| 8:00 AM to 8:29 AM | 15 (16.7%) | 14 (18.4%) |
| 8:30 AM to 8:59 AM | 0 (0.0%) | 0 (0.0%) |
| 9:00 AM to 9:59 AM | 6 (6.7%) | 5 (6.6%) |
| 10:00 AM to 10:59 AM | 0 (0.0%) | 6 (7.9%) |
| 11:00 AM to 11:59 AM | 2 (2.2%) | 0 (0.0%) |
| 12:00 PM to 3:59 PM | 12 (13.3%) | 0 (0.0%) |
| 4:00 PM to 11:59 PM | 13 (14.4%) | 0 (0.0%) |
| Total | 90 (100.0%) | 76 (100.0%) |
Housing Occupancy in Alto Pass
Occupancy by Ownership in Alto Pass
Of the total 141 dwellings in Alto Pass, owner-occupied units account for 126 (89.4%), while renter-occupied units make up 15 (10.6%).
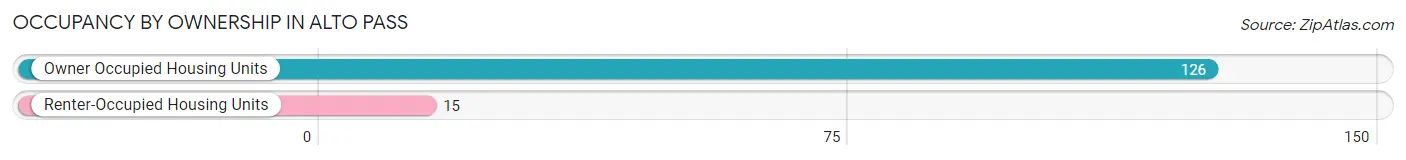
| Occupancy | # Housing Units | % Housing Units |
| Owner Occupied Housing Units | 126 | 89.4% |
| Renter-Occupied Housing Units | 15 | 10.6% |
| Total Occupied Housing Units | 141 | 100.0% |
Occupancy by Household Size in Alto Pass
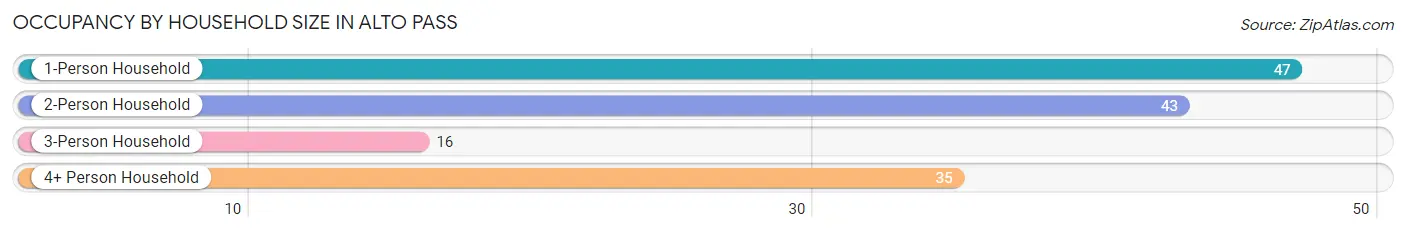
| Household Size | # Housing Units | % Housing Units |
| 1-Person Household | 47 | 33.3% |
| 2-Person Household | 43 | 30.5% |
| 3-Person Household | 16 | 11.4% |
| 4+ Person Household | 35 | 24.8% |
| Total Housing Units | 141 | 100.0% |
Occupancy by Ownership by Household Size in Alto Pass
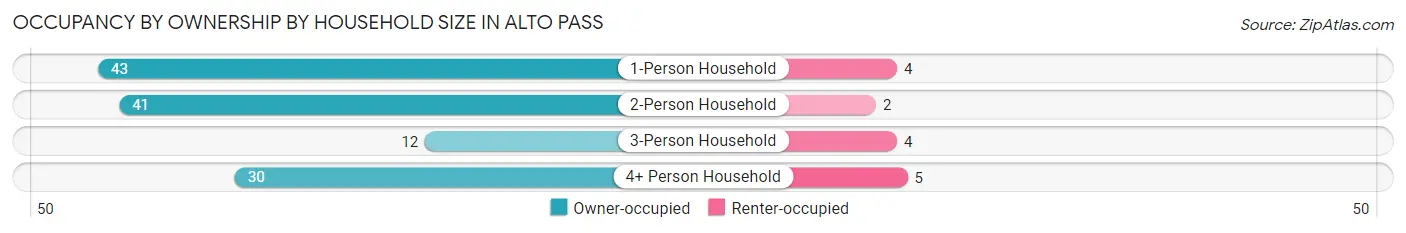
| Household Size | Owner-occupied | Renter-occupied |
| 1-Person Household | 43 (91.5%) | 4 (8.5%) |
| 2-Person Household | 41 (95.4%) | 2 (4.6%) |
| 3-Person Household | 12 (75.0%) | 4 (25.0%) |
| 4+ Person Household | 30 (85.7%) | 5 (14.3%) |
| Total Housing Units | 126 (89.4%) | 15 (10.6%) |
Occupancy by Educational Attainment in Alto Pass
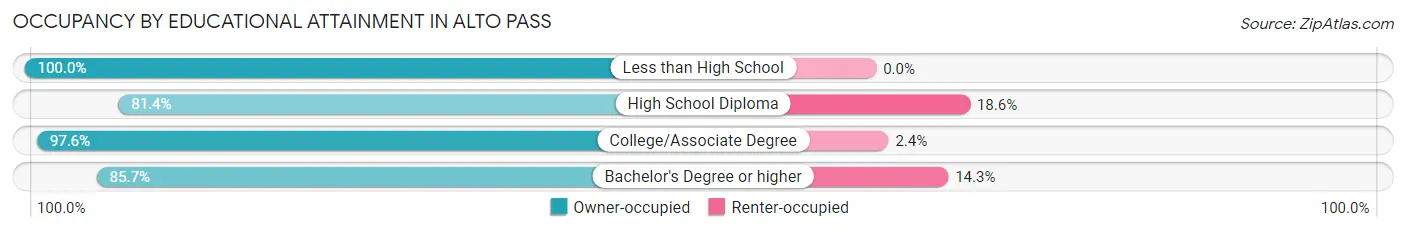
| Household Size | Owner-occupied | Renter-occupied |
| Less than High School | 15 (100.0%) | 0 (0.0%) |
| High School Diploma | 35 (81.4%) | 8 (18.6%) |
| College/Associate Degree | 40 (97.6%) | 1 (2.4%) |
| Bachelor's Degree or higher | 36 (85.7%) | 6 (14.3%) |
Occupancy by Age of Householder in Alto Pass
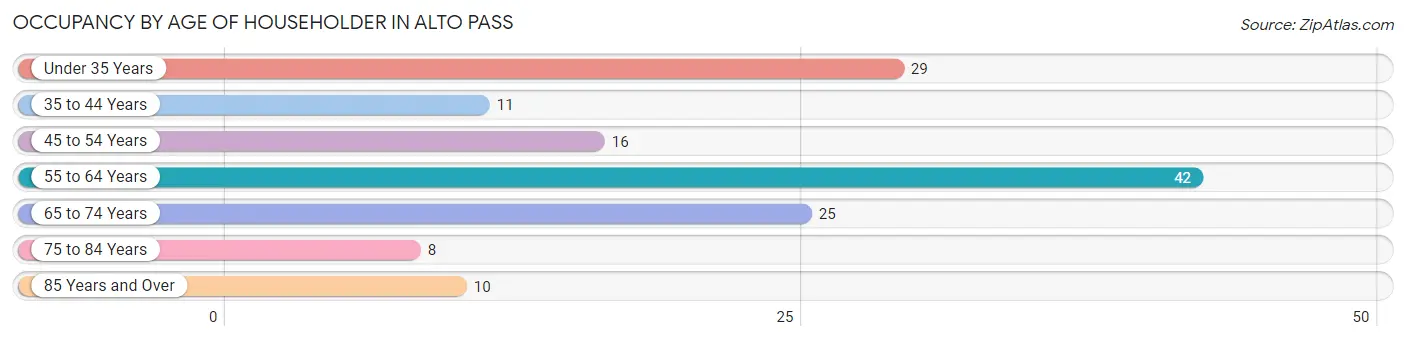
| Age Bracket | # Households | % Households |
| Under 35 Years | 29 | 20.6% |
| 35 to 44 Years | 11 | 7.8% |
| 45 to 54 Years | 16 | 11.4% |
| 55 to 64 Years | 42 | 29.8% |
| 65 to 74 Years | 25 | 17.7% |
| 75 to 84 Years | 8 | 5.7% |
| 85 Years and Over | 10 | 7.1% |
| Total | 141 | 100.0% |
Housing Finances in Alto Pass
Median Income by Occupancy in Alto Pass
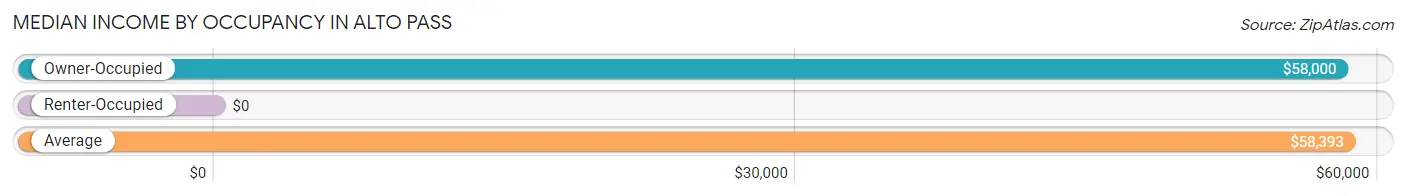
| Occupancy Type | # Households | Median Income |
| Owner-Occupied | 126 (89.4%) | $58,000 |
| Renter-Occupied | 15 (10.6%) | $0 |
| Average | 141 (100.0%) | $58,393 |
Occupancy by Householder Income Bracket in Alto Pass
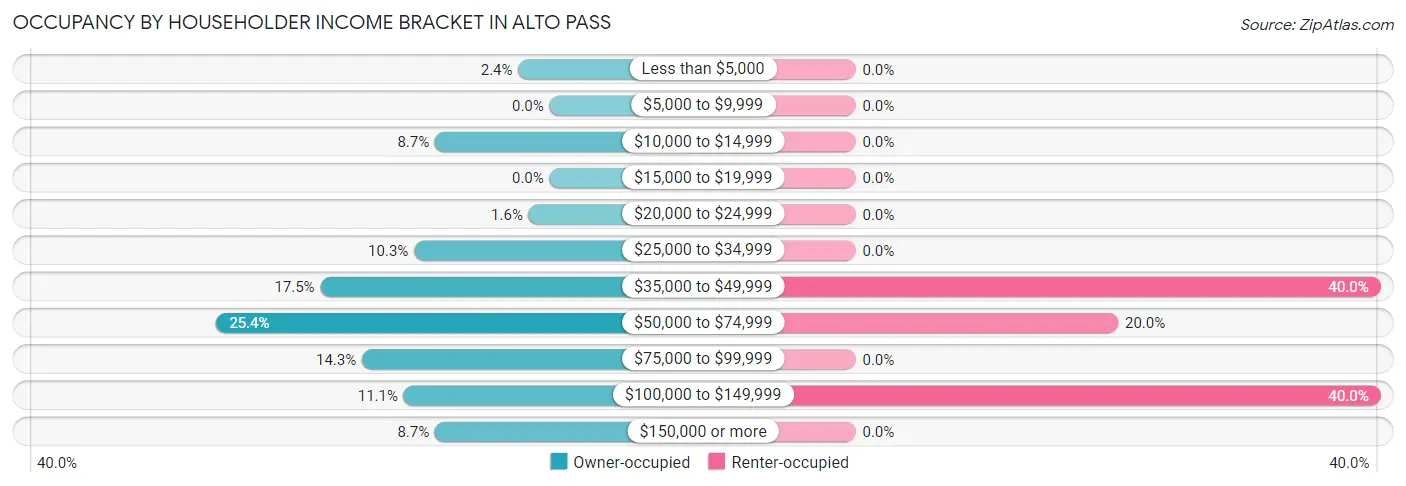
| Income Bracket | Owner-occupied | Renter-occupied |
| Less than $5,000 | 3 (2.4%) | 0 (0.0%) |
| $5,000 to $9,999 | 0 (0.0%) | 0 (0.0%) |
| $10,000 to $14,999 | 11 (8.7%) | 0 (0.0%) |
| $15,000 to $19,999 | 0 (0.0%) | 0 (0.0%) |
| $20,000 to $24,999 | 2 (1.6%) | 0 (0.0%) |
| $25,000 to $34,999 | 13 (10.3%) | 0 (0.0%) |
| $35,000 to $49,999 | 22 (17.5%) | 6 (40.0%) |
| $50,000 to $74,999 | 32 (25.4%) | 3 (20.0%) |
| $75,000 to $99,999 | 18 (14.3%) | 0 (0.0%) |
| $100,000 to $149,999 | 14 (11.1%) | 6 (40.0%) |
| $150,000 or more | 11 (8.7%) | 0 (0.0%) |
| Total | 126 (100.0%) | 15 (100.0%) |
Monthly Housing Cost Tiers in Alto Pass
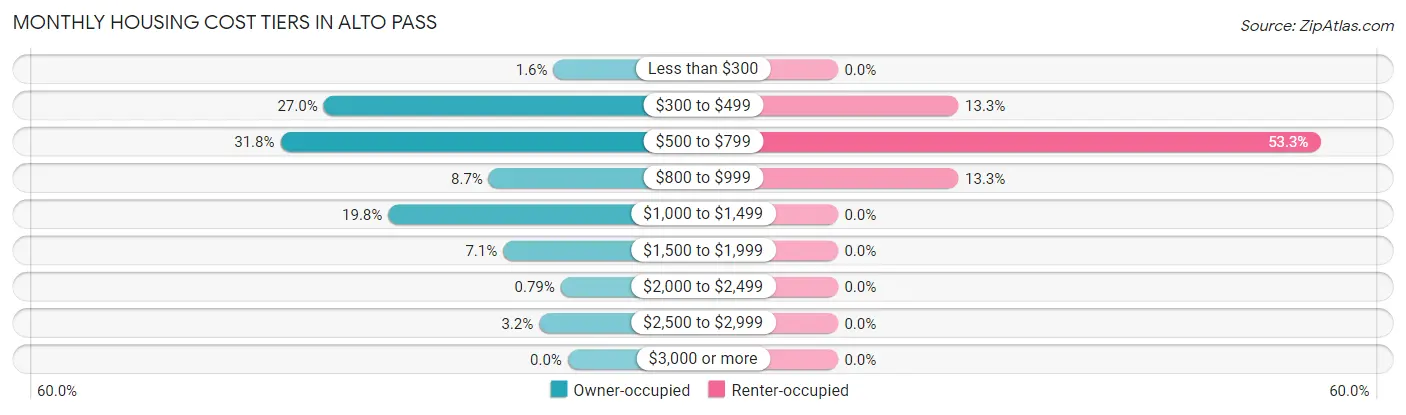
| Monthly Cost | Owner-occupied | Renter-occupied |
| Less than $300 | 2 (1.6%) | 0 (0.0%) |
| $300 to $499 | 34 (27.0%) | 2 (13.3%) |
| $500 to $799 | 40 (31.8%) | 8 (53.3%) |
| $800 to $999 | 11 (8.7%) | 2 (13.3%) |
| $1,000 to $1,499 | 25 (19.8%) | 0 (0.0%) |
| $1,500 to $1,999 | 9 (7.1%) | 0 (0.0%) |
| $2,000 to $2,499 | 1 (0.8%) | 0 (0.0%) |
| $2,500 to $2,999 | 4 (3.2%) | 0 (0.0%) |
| $3,000 or more | 0 (0.0%) | 0 (0.0%) |
| Total | 126 (100.0%) | 15 (100.0%) |
Physical Housing Characteristics in Alto Pass
Housing Structures in Alto Pass
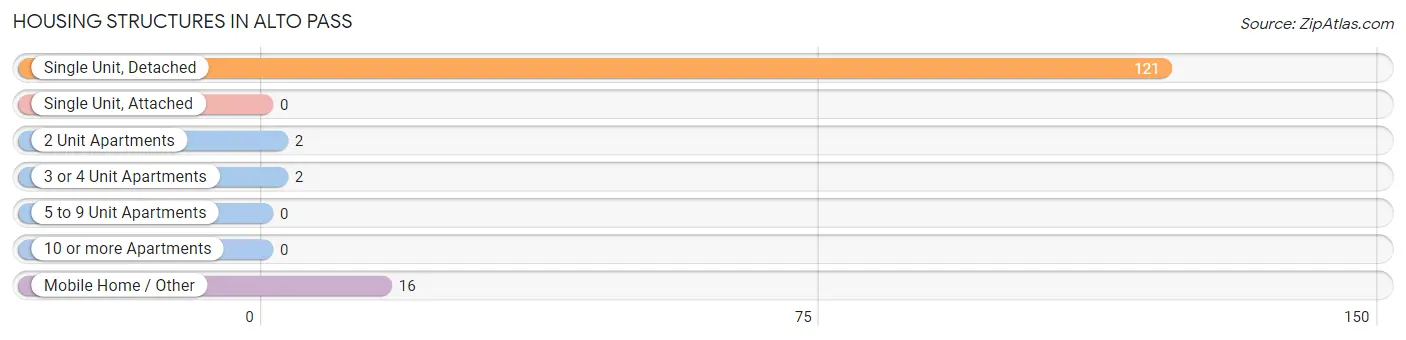
| Structure Type | # Housing Units | % Housing Units |
| Single Unit, Detached | 121 | 85.8% |
| Single Unit, Attached | 0 | 0.0% |
| 2 Unit Apartments | 2 | 1.4% |
| 3 or 4 Unit Apartments | 2 | 1.4% |
| 5 to 9 Unit Apartments | 0 | 0.0% |
| 10 or more Apartments | 0 | 0.0% |
| Mobile Home / Other | 16 | 11.4% |
| Total | 141 | 100.0% |
Housing Structures by Occupancy in Alto Pass
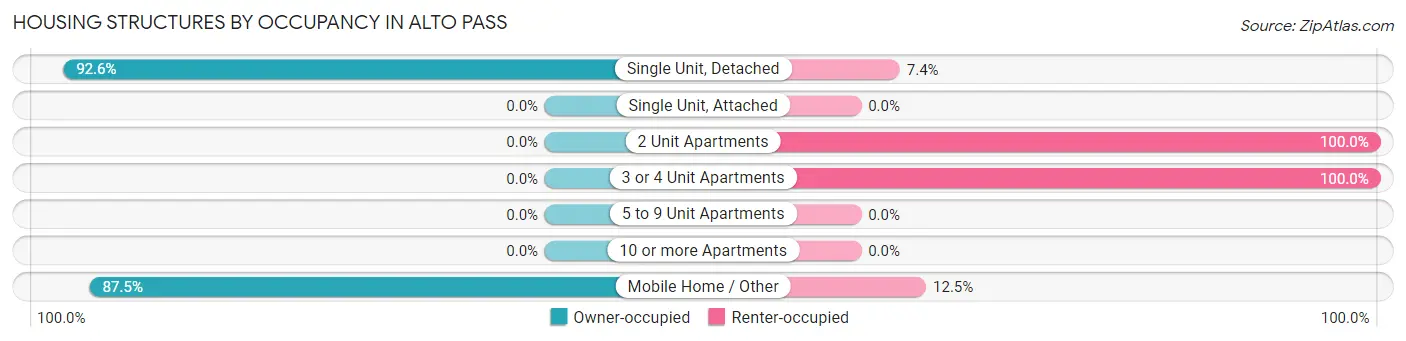
| Structure Type | Owner-occupied | Renter-occupied |
| Single Unit, Detached | 112 (92.6%) | 9 (7.4%) |
| Single Unit, Attached | 0 (0.0%) | 0 (0.0%) |
| 2 Unit Apartments | 0 (0.0%) | 2 (100.0%) |
| 3 or 4 Unit Apartments | 0 (0.0%) | 2 (100.0%) |
| 5 to 9 Unit Apartments | 0 (0.0%) | 0 (0.0%) |
| 10 or more Apartments | 0 (0.0%) | 0 (0.0%) |
| Mobile Home / Other | 14 (87.5%) | 2 (12.5%) |
| Total | 126 (89.4%) | 15 (10.6%) |
Housing Structures by Number of Rooms in Alto Pass
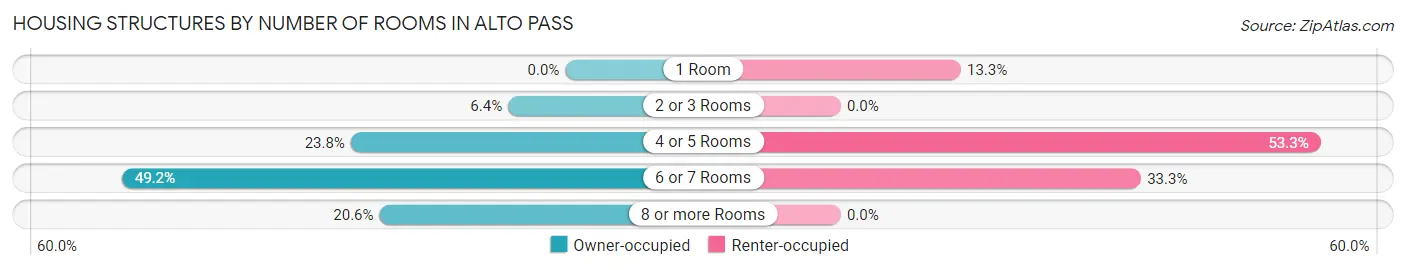
| Number of Rooms | Owner-occupied | Renter-occupied |
| 1 Room | 0 (0.0%) | 2 (13.3%) |
| 2 or 3 Rooms | 8 (6.4%) | 0 (0.0%) |
| 4 or 5 Rooms | 30 (23.8%) | 8 (53.3%) |
| 6 or 7 Rooms | 62 (49.2%) | 5 (33.3%) |
| 8 or more Rooms | 26 (20.6%) | 0 (0.0%) |
| Total | 126 (100.0%) | 15 (100.0%) |
Housing Structure by Heating Type in Alto Pass
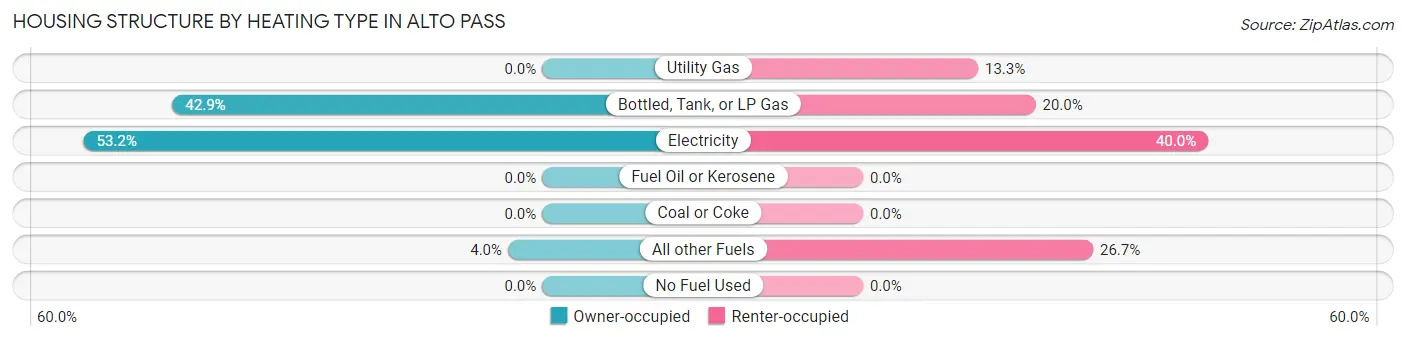
| Heating Type | Owner-occupied | Renter-occupied |
| Utility Gas | 0 (0.0%) | 2 (13.3%) |
| Bottled, Tank, or LP Gas | 54 (42.9%) | 3 (20.0%) |
| Electricity | 67 (53.2%) | 6 (40.0%) |
| Fuel Oil or Kerosene | 0 (0.0%) | 0 (0.0%) |
| Coal or Coke | 0 (0.0%) | 0 (0.0%) |
| All other Fuels | 5 (4.0%) | 4 (26.7%) |
| No Fuel Used | 0 (0.0%) | 0 (0.0%) |
| Total | 126 (100.0%) | 15 (100.0%) |
Household Vehicle Usage in Alto Pass
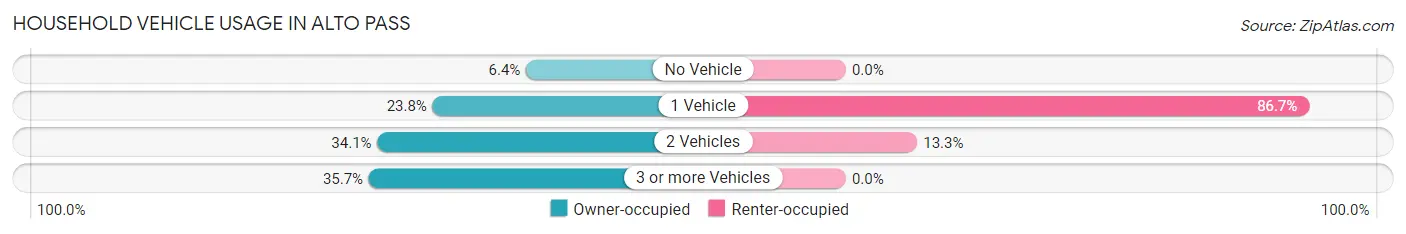
| Vehicles per Household | Owner-occupied | Renter-occupied |
| No Vehicle | 8 (6.4%) | 0 (0.0%) |
| 1 Vehicle | 30 (23.8%) | 13 (86.7%) |
| 2 Vehicles | 43 (34.1%) | 2 (13.3%) |
| 3 or more Vehicles | 45 (35.7%) | 0 (0.0%) |
| Total | 126 (100.0%) | 15 (100.0%) |
Real Estate & Mortgages in Alto Pass
Real Estate and Mortgage Overview in Alto Pass
| Characteristic | Without Mortgage | With Mortgage |
| Housing Units | 71 | 55 |
| Median Property Value | - | - |
| Median Household Income | $47,250 | $11 |
| Monthly Housing Costs | $498 | $0 |
| Real Estate Taxes | $1,080 | $6 |
Property Value by Mortgage Status in Alto Pass
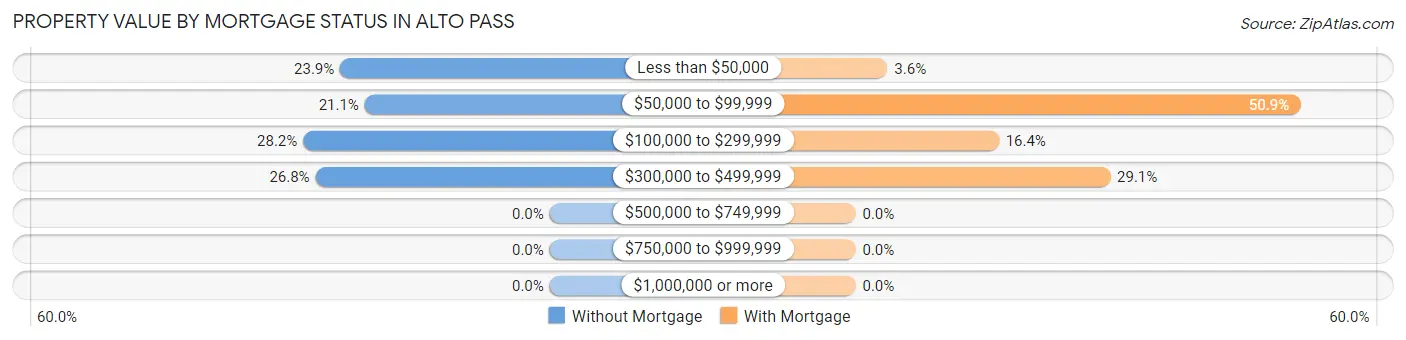
| Property Value | Without Mortgage | With Mortgage |
| Less than $50,000 | 17 (23.9%) | 2 (3.6%) |
| $50,000 to $99,999 | 15 (21.1%) | 28 (50.9%) |
| $100,000 to $299,999 | 20 (28.2%) | 9 (16.4%) |
| $300,000 to $499,999 | 19 (26.8%) | 16 (29.1%) |
| $500,000 to $749,999 | 0 (0.0%) | 0 (0.0%) |
| $750,000 to $999,999 | 0 (0.0%) | 0 (0.0%) |
| $1,000,000 or more | 0 (0.0%) | 0 (0.0%) |
| Total | 71 (100.0%) | 55 (100.0%) |
Household Income by Mortgage Status in Alto Pass
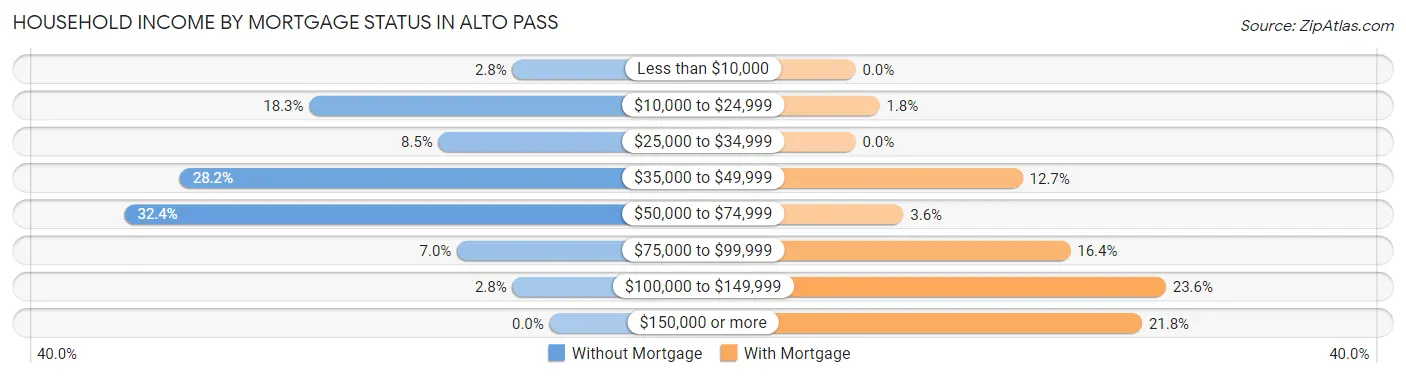
| Household Income | Without Mortgage | With Mortgage |
| Less than $10,000 | 2 (2.8%) | 0 (0.0%) |
| $10,000 to $24,999 | 13 (18.3%) | 1 (1.8%) |
| $25,000 to $34,999 | 6 (8.5%) | 0 (0.0%) |
| $35,000 to $49,999 | 20 (28.2%) | 7 (12.7%) |
| $50,000 to $74,999 | 23 (32.4%) | 2 (3.6%) |
| $75,000 to $99,999 | 5 (7.0%) | 9 (16.4%) |
| $100,000 to $149,999 | 2 (2.8%) | 13 (23.6%) |
| $150,000 or more | 0 (0.0%) | 12 (21.8%) |
| Total | 71 (100.0%) | 55 (100.0%) |
Property Value to Household Income Ratio in Alto Pass
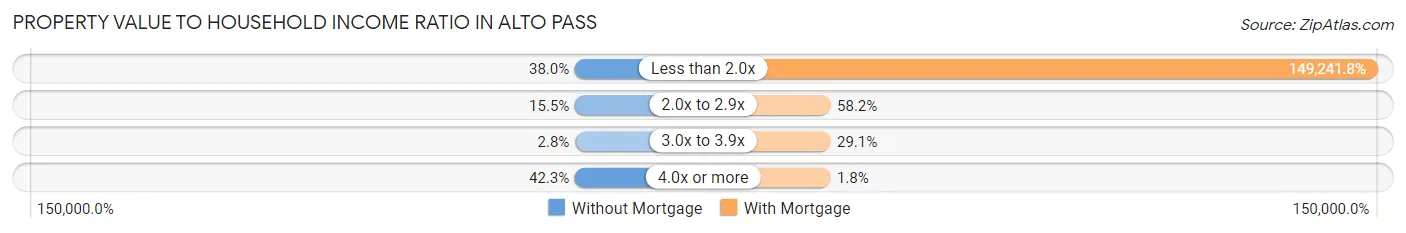
| Value-to-Income Ratio | Without Mortgage | With Mortgage |
| Less than 2.0x | 27 (38.0%) | 82,083 (149,241.8%) |
| 2.0x to 2.9x | 11 (15.5%) | 32 (58.2%) |
| 3.0x to 3.9x | 2 (2.8%) | 16 (29.1%) |
| 4.0x or more | 30 (42.2%) | 1 (1.8%) |
| Total | 71 (100.0%) | 55 (100.0%) |
Real Estate Taxes by Mortgage Status in Alto Pass
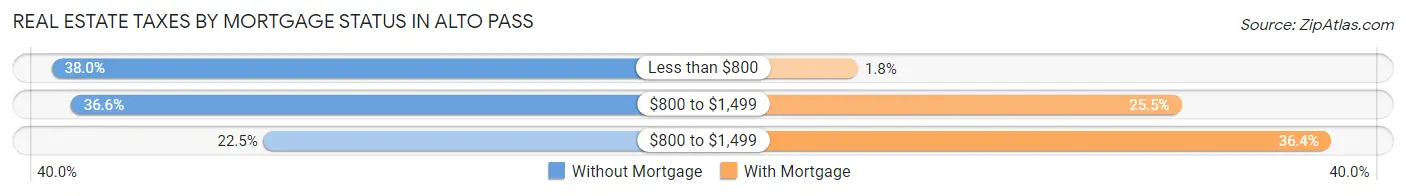
| Property Taxes | Without Mortgage | With Mortgage |
| Less than $800 | 27 (38.0%) | 1 (1.8%) |
| $800 to $1,499 | 26 (36.6%) | 14 (25.5%) |
| $800 to $1,499 | 16 (22.5%) | 20 (36.4%) |
| Total | 71 (100.0%) | 55 (100.0%) |
Health & Disability in Alto Pass
Health Insurance Coverage by Age in Alto Pass
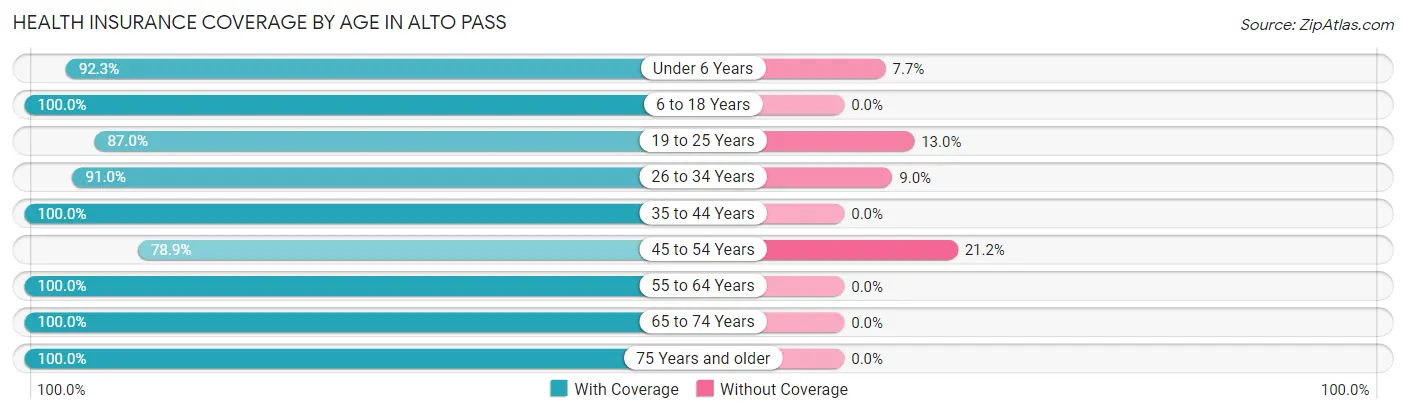
| Age Bracket | With Coverage | Without Coverage |
| Under 6 Years | 24 (92.3%) | 2 (7.7%) |
| 6 to 18 Years | 46 (100.0%) | 0 (0.0%) |
| 19 to 25 Years | 20 (87.0%) | 3 (13.0%) |
| 26 to 34 Years | 61 (91.0%) | 6 (9.0%) |
| 35 to 44 Years | 31 (100.0%) | 0 (0.0%) |
| 45 to 54 Years | 41 (78.8%) | 11 (21.1%) |
| 55 to 64 Years | 65 (100.0%) | 0 (0.0%) |
| 65 to 74 Years | 48 (100.0%) | 0 (0.0%) |
| 75 Years and older | 23 (100.0%) | 0 (0.0%) |
| Total | 359 (94.2%) | 22 (5.8%) |
Health Insurance Coverage by Citizenship Status in Alto Pass
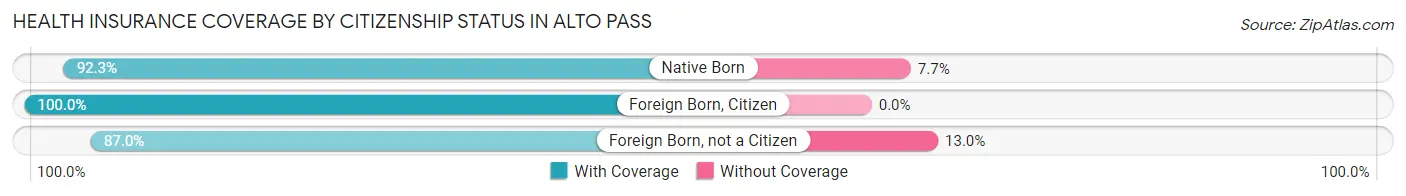
| Citizenship Status | With Coverage | Without Coverage |
| Native Born | 24 (92.3%) | 2 (7.7%) |
| Foreign Born, Citizen | 46 (100.0%) | 0 (0.0%) |
| Foreign Born, not a Citizen | 20 (87.0%) | 3 (13.0%) |
Health Insurance Coverage by Household Income in Alto Pass
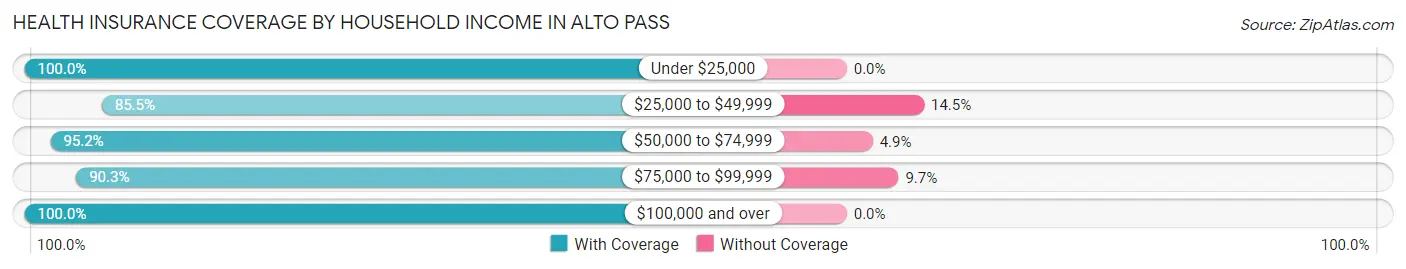
| Household Income | With Coverage | Without Coverage |
| Under $25,000 | 16 (100.0%) | 0 (0.0%) |
| $25,000 to $49,999 | 65 (85.5%) | 11 (14.5%) |
| $50,000 to $74,999 | 98 (95.2%) | 5 (4.9%) |
| $75,000 to $99,999 | 56 (90.3%) | 6 (9.7%) |
| $100,000 and over | 124 (100.0%) | 0 (0.0%) |
Public vs Private Health Insurance Coverage by Age in Alto Pass
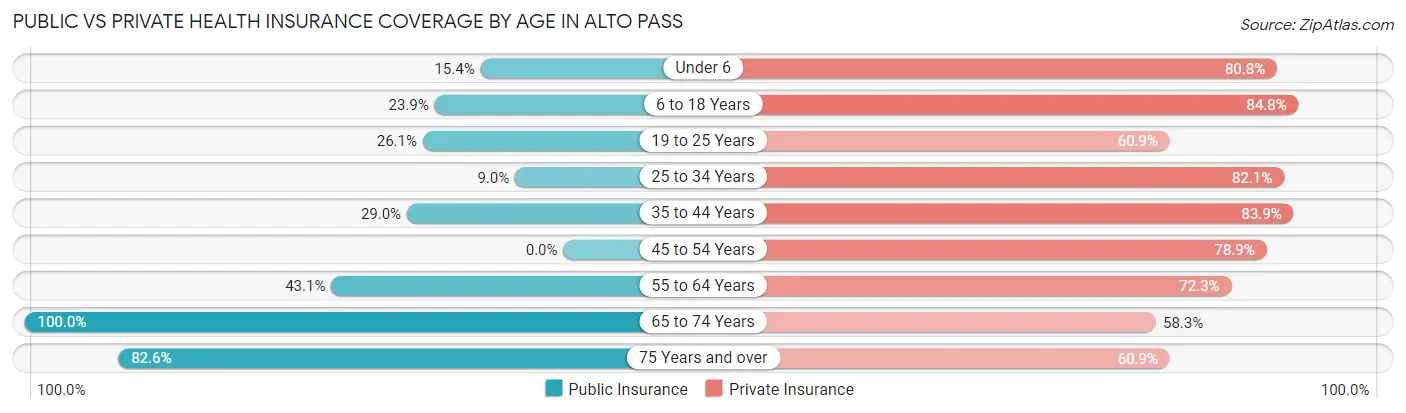
| Age Bracket | Public Insurance | Private Insurance |
| Under 6 | 4 (15.4%) | 21 (80.8%) |
| 6 to 18 Years | 11 (23.9%) | 39 (84.8%) |
| 19 to 25 Years | 6 (26.1%) | 14 (60.9%) |
| 25 to 34 Years | 6 (9.0%) | 55 (82.1%) |
| 35 to 44 Years | 9 (29.0%) | 26 (83.9%) |
| 45 to 54 Years | 0 (0.0%) | 41 (78.8%) |
| 55 to 64 Years | 28 (43.1%) | 47 (72.3%) |
| 65 to 74 Years | 48 (100.0%) | 28 (58.3%) |
| 75 Years and over | 19 (82.6%) | 14 (60.9%) |
| Total | 131 (34.4%) | 285 (74.8%) |
Disability Status by Sex by Age in Alto Pass
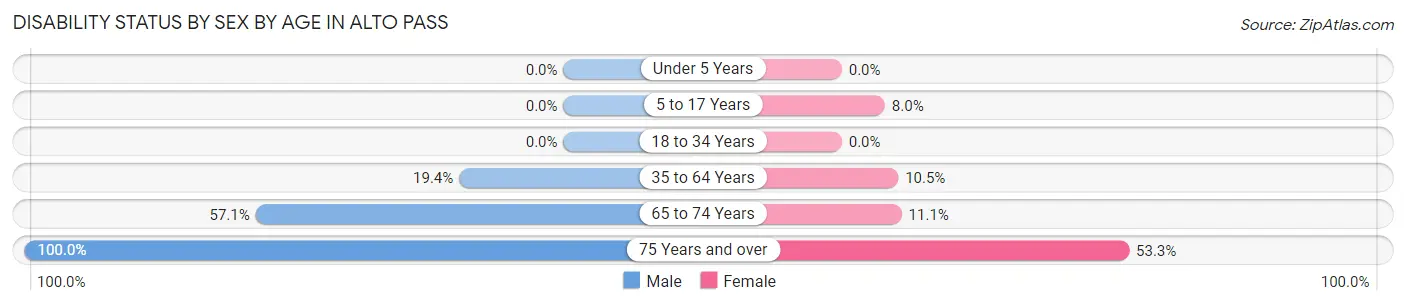
| Age Bracket | Male | Female |
| Under 5 Years | 0 (0.0%) | 0 (0.0%) |
| 5 to 17 Years | 0 (0.0%) | 2 (8.0%) |
| 18 to 34 Years | 0 (0.0%) | 0 (0.0%) |
| 35 to 64 Years | 12 (19.4%) | 9 (10.5%) |
| 65 to 74 Years | 12 (57.1%) | 3 (11.1%) |
| 75 Years and over | 8 (100.0%) | 8 (53.3%) |
Disability Class by Sex by Age in Alto Pass
Disability Class: Hearing Difficulty
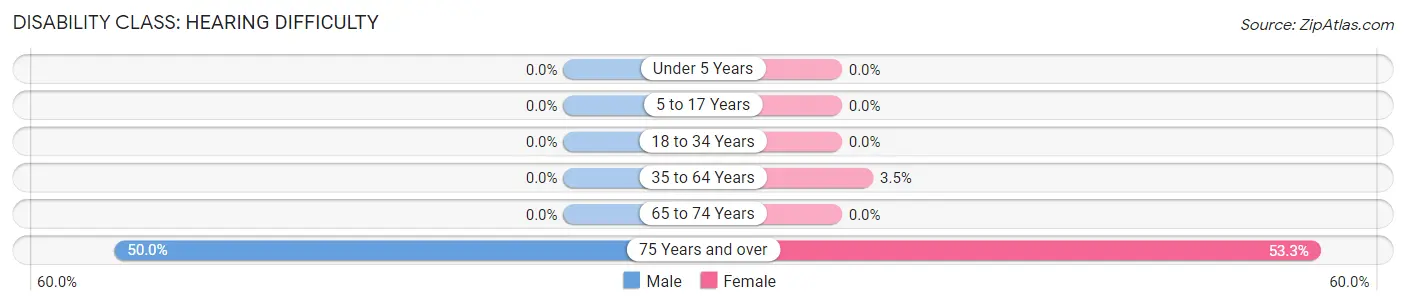
| Age Bracket | Male | Female |
| Under 5 Years | 0 (0.0%) | 0 (0.0%) |
| 5 to 17 Years | 0 (0.0%) | 0 (0.0%) |
| 18 to 34 Years | 0 (0.0%) | 0 (0.0%) |
| 35 to 64 Years | 0 (0.0%) | 3 (3.5%) |
| 65 to 74 Years | 0 (0.0%) | 0 (0.0%) |
| 75 Years and over | 4 (50.0%) | 8 (53.3%) |
Disability Class: Vision Difficulty
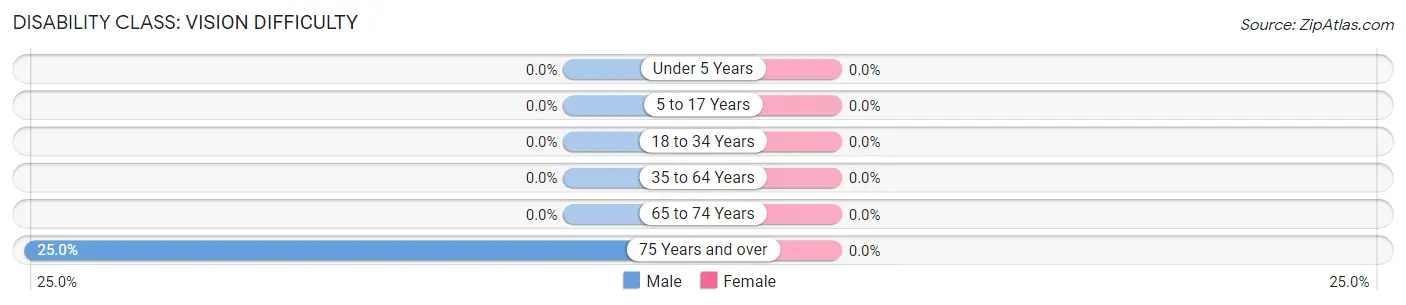
| Age Bracket | Male | Female |
| Under 5 Years | 0 (0.0%) | 0 (0.0%) |
| 5 to 17 Years | 0 (0.0%) | 0 (0.0%) |
| 18 to 34 Years | 0 (0.0%) | 0 (0.0%) |
| 35 to 64 Years | 0 (0.0%) | 0 (0.0%) |
| 65 to 74 Years | 0 (0.0%) | 0 (0.0%) |
| 75 Years and over | 2 (25.0%) | 0 (0.0%) |
Disability Class: Cognitive Difficulty
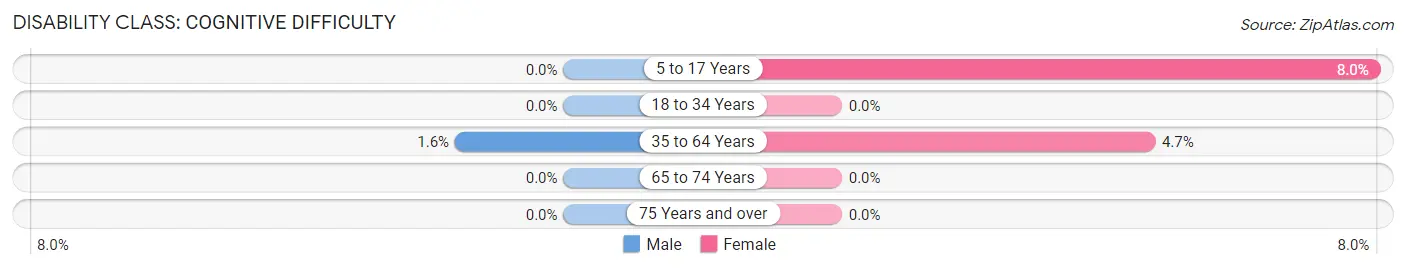
| Age Bracket | Male | Female |
| 5 to 17 Years | 0 (0.0%) | 2 (8.0%) |
| 18 to 34 Years | 0 (0.0%) | 0 (0.0%) |
| 35 to 64 Years | 1 (1.6%) | 4 (4.6%) |
| 65 to 74 Years | 0 (0.0%) | 0 (0.0%) |
| 75 Years and over | 0 (0.0%) | 0 (0.0%) |
Disability Class: Ambulatory Difficulty
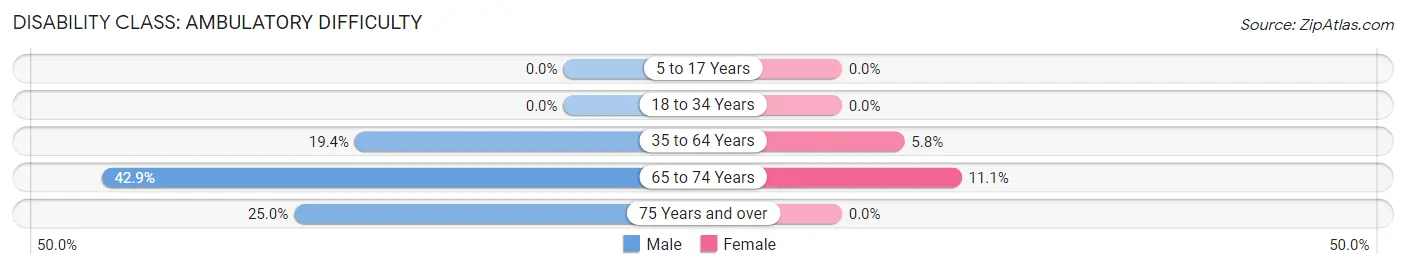
| Age Bracket | Male | Female |
| 5 to 17 Years | 0 (0.0%) | 0 (0.0%) |
| 18 to 34 Years | 0 (0.0%) | 0 (0.0%) |
| 35 to 64 Years | 12 (19.4%) | 5 (5.8%) |
| 65 to 74 Years | 9 (42.9%) | 3 (11.1%) |
| 75 Years and over | 2 (25.0%) | 0 (0.0%) |
Disability Class: Self-Care Difficulty
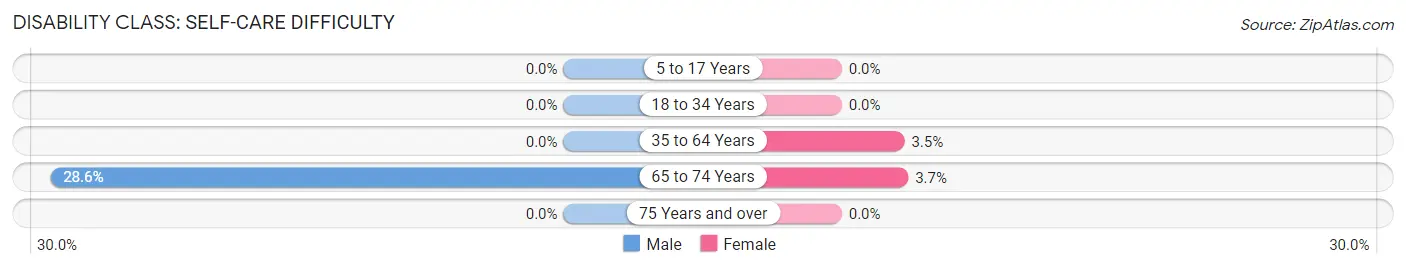
| Age Bracket | Male | Female |
| 5 to 17 Years | 0 (0.0%) | 0 (0.0%) |
| 18 to 34 Years | 0 (0.0%) | 0 (0.0%) |
| 35 to 64 Years | 0 (0.0%) | 3 (3.5%) |
| 65 to 74 Years | 6 (28.6%) | 1 (3.7%) |
| 75 Years and over | 0 (0.0%) | 0 (0.0%) |
Technology Access in Alto Pass
Computing Device Access in Alto Pass
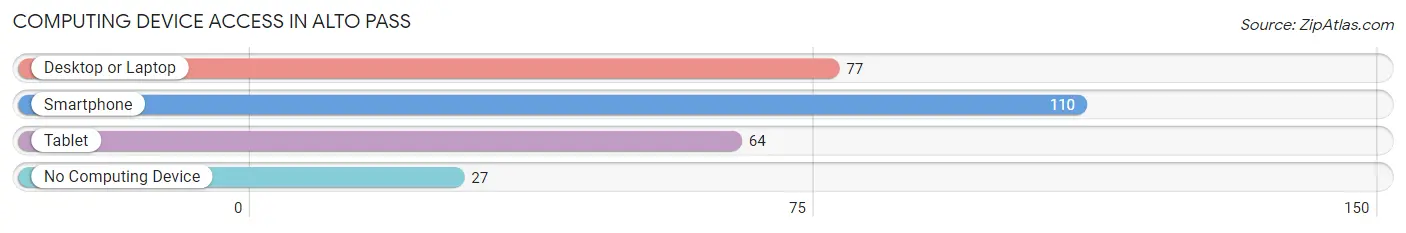
| Device Type | # Households | % Households |
| Desktop or Laptop | 77 | 54.6% |
| Smartphone | 110 | 78.0% |
| Tablet | 64 | 45.4% |
| No Computing Device | 27 | 19.2% |
| Total | 141 | 100.0% |
Internet Access in Alto Pass
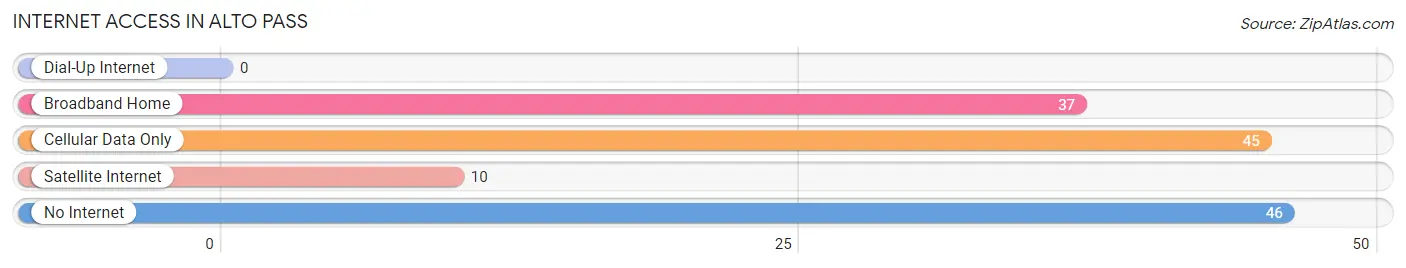
| Internet Type | # Households | % Households |
| Dial-Up Internet | 0 | 0.0% |
| Broadband Home | 37 | 26.2% |
| Cellular Data Only | 45 | 31.9% |
| Satellite Internet | 10 | 7.1% |
| No Internet | 46 | 32.6% |
| Total | 141 | 100.0% |
Alto Pass Summary
Alto Pass is a small village located in Union County, Illinois, United States. It is situated in the Shawnee National Forest, and is part of the Carbondale-Marion-Herrin, IL Metropolitan Statistical Area. The population of Alto Pass was 545 at the 2010 census.
History
Alto Pass was founded in 1853 by a group of German immigrants who had settled in the area. The village was originally known as “Alto”, which is German for “high”, and was named for its location on a high ridge. The name was later changed to Alto Pass when the railroad was built through the area in 1872.
The village was incorporated in 1876 and has remained a small, rural community ever since. The village was home to a number of businesses, including a general store, a blacksmith shop, a sawmill, and a grist mill.
Geography
Alto Pass is located at 37°45'25" North, 89°14'45" West (37.756944, -89.245833). It is situated in the Shawnee National Forest, and is part of the Carbondale-Marion-Herrin, IL Metropolitan Statistical Area.
The village is located on a high ridge, and is surrounded by rolling hills and forests. The nearest major city is Carbondale, which is located about 25 miles to the north.
Economy
The economy of Alto Pass is largely based on agriculture and tourism. The village is home to a number of small businesses, including a general store, a restaurant, and a bed and breakfast.
The village is also home to a number of wineries, including Alto Vineyards, which produces a variety of wines from locally grown grapes. The village also hosts a number of festivals and events throughout the year, including the annual Alto Pass Wine Festival.
Demographics
As of the 2010 census, the population of Alto Pass was 545. The racial makeup of the village was 97.3% White, 0.2% African American, 0.2% Native American, 0.2% Asian, 0.4% from other races, and 1.9% from two or more races. Hispanic or Latino of any race were 1.3% of the population.
The median income for a household in the village was $37,500, and the median income for a family was $45,000. The per capita income for the village was $17,845. About 10.3% of families and 13.2% of the population were below the poverty line, including 16.7% of those under age 18 and 8.3% of those age 65 or over.
Conclusion
Alto Pass is a small village located in Union County, Illinois. It was founded in 1853 by a group of German immigrants and has remained a small, rural community ever since. The economy of Alto Pass is largely based on agriculture and tourism, and the village is home to a number of small businesses, wineries, and festivals. The population of Alto Pass was 545 at the 2010 census, and the median income for a household in the village was $37,500.
Common Questions
What is Per Capita Income in Alto Pass?
Per Capita income in Alto Pass is $30,113.
What is the Median Family Income in Alto Pass?
Median Family Income in Alto Pass is $75,536.
What is the Median Household income in Alto Pass?
Median Household Income in Alto Pass is $58,393.
What is Income or Wage Gap in Alto Pass?
Income or Wage Gap in Alto Pass is 16.5%.
Women in Alto Pass earn 83.5 cents for every dollar earned by a man.
What is Inequality or Gini Index in Alto Pass?
Inequality or Gini Index in Alto Pass is 0.36.
What is the Total Population of Alto Pass?
Total Population of Alto Pass is 381.
What is the Total Male Population of Alto Pass?
Total Male Population of Alto Pass is 194.
What is the Total Female Population of Alto Pass?
Total Female Population of Alto Pass is 187.
What is the Ratio of Males per 100 Females in Alto Pass?
There are 103.74 Males per 100 Females in Alto Pass.
What is the Ratio of Females per 100 Males in Alto Pass?
There are 96.39 Females per 100 Males in Alto Pass.
What is the Median Population Age in Alto Pass?
Median Population Age in Alto Pass is 44.4 Years.
What is the Average Family Size in Alto Pass
Average Family Size in Alto Pass is 3.6 People.
What is the Average Household Size in Alto Pass
Average Household Size in Alto Pass is 2.7 People.
How Large is the Labor Force in Alto Pass?
There are 185 People in the Labor Forcein in Alto Pass.
What is the Percentage of People in the Labor Force in Alto Pass?
59.5% of People are in the Labor Force in Alto Pass.
What is the Unemployment Rate in Alto Pass?
Unemployment Rate in Alto Pass is 4.9%.