Ellisville, IL Map & Demographics
Ellisville Map
Ellisville Overview
$22,837
PER CAPITA INCOME
$48,846
AVG FAMILY INCOME
$47,981
AVG HOUSEHOLD INCOME
0.28
INEQUALITY / GINI INDEX
86
TOTAL POPULATION
44
MALE POPULATION
42
FEMALE POPULATION
104.76
MALES / 100 FEMALES
95.45
FEMALES / 100 MALES
64.5
MEDIAN AGE
2.6
AVG FAMILY SIZE
2.3
AVG HOUSEHOLD SIZE
20
LABOR FORCE [ PEOPLE ]
26.0%
PERCENT IN LABOR FORCE
5.0%
UNEMPLOYMENT RATE
Ellisville Zip Codes
Ellisville Area Codes
Income in Ellisville
Income Overview in Ellisville
Per Capita Income in Ellisville is $22,837, while median incomes of families and households are $48,846 and $47,981 respectively.
| Characteristic | Number | Measure |
| Per Capita Income | 86 | $22,837 |
| Median Family Income | 28 | $48,846 |
| Mean Family Income | 28 | $59,982 |
| Median Household Income | 37 | $47,981 |
| Mean Household Income | 37 | $53,389 |
| Income Deficit | 28 | $0 |
| Wage / Income Gap (%) | 86 | 0.00% |
| Wage / Income Gap ($) | 86 | 100.00¢ per $1 |
| Gini / Inequality Index | 86 | 0.28 |
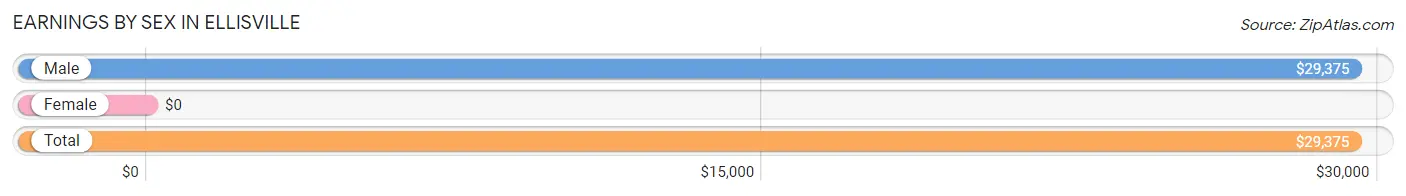
Earnings by Sex in Ellisville
| Sex | Number | Average Earnings |
| Male | 5 (26.3%) | $29,375 |
| Female | 14 (73.7%) | $0 |
| Total | 19 (100.0%) | $29,375 |
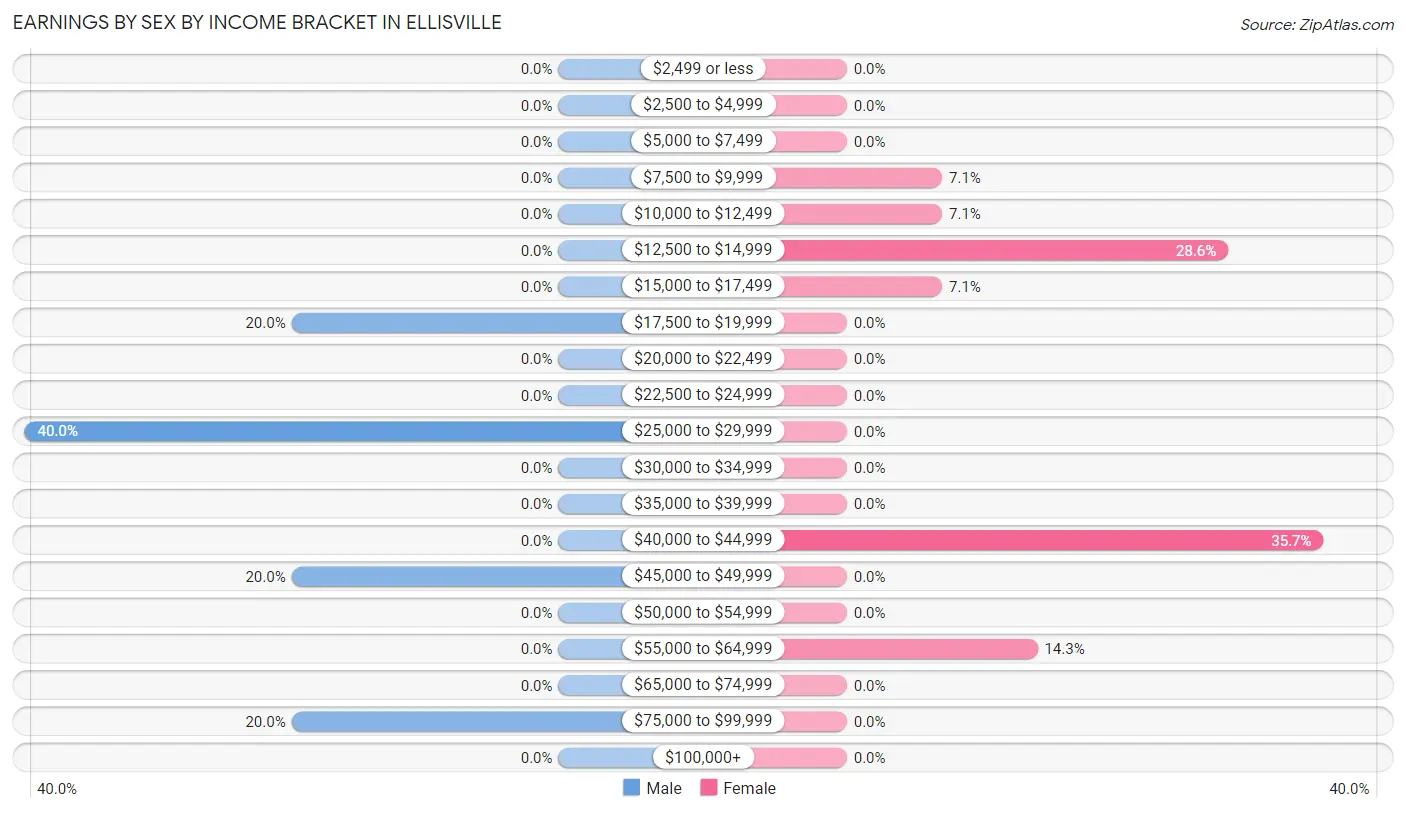
Earnings by Sex by Income Bracket in Ellisville
The most common earnings brackets in Ellisville are $25,000 to $29,999 for men (2 | 40.0%) and $40,000 to $44,999 for women (5 | 35.7%).
| Income | Male | Female |
| $2,499 or less | 0 (0.0%) | 0 (0.0%) |
| $2,500 to $4,999 | 0 (0.0%) | 0 (0.0%) |
| $5,000 to $7,499 | 0 (0.0%) | 0 (0.0%) |
| $7,500 to $9,999 | 0 (0.0%) | 1 (7.1%) |
| $10,000 to $12,499 | 0 (0.0%) | 1 (7.1%) |
| $12,500 to $14,999 | 0 (0.0%) | 4 (28.6%) |
| $15,000 to $17,499 | 0 (0.0%) | 1 (7.1%) |
| $17,500 to $19,999 | 1 (20.0%) | 0 (0.0%) |
| $20,000 to $22,499 | 0 (0.0%) | 0 (0.0%) |
| $22,500 to $24,999 | 0 (0.0%) | 0 (0.0%) |
| $25,000 to $29,999 | 2 (40.0%) | 0 (0.0%) |
| $30,000 to $34,999 | 0 (0.0%) | 0 (0.0%) |
| $35,000 to $39,999 | 0 (0.0%) | 0 (0.0%) |
| $40,000 to $44,999 | 0 (0.0%) | 5 (35.7%) |
| $45,000 to $49,999 | 1 (20.0%) | 0 (0.0%) |
| $50,000 to $54,999 | 0 (0.0%) | 0 (0.0%) |
| $55,000 to $64,999 | 0 (0.0%) | 2 (14.3%) |
| $65,000 to $74,999 | 0 (0.0%) | 0 (0.0%) |
| $75,000 to $99,999 | 1 (20.0%) | 0 (0.0%) |
| $100,000+ | 0 (0.0%) | 0 (0.0%) |
| Total | 5 (100.0%) | 14 (100.0%) |
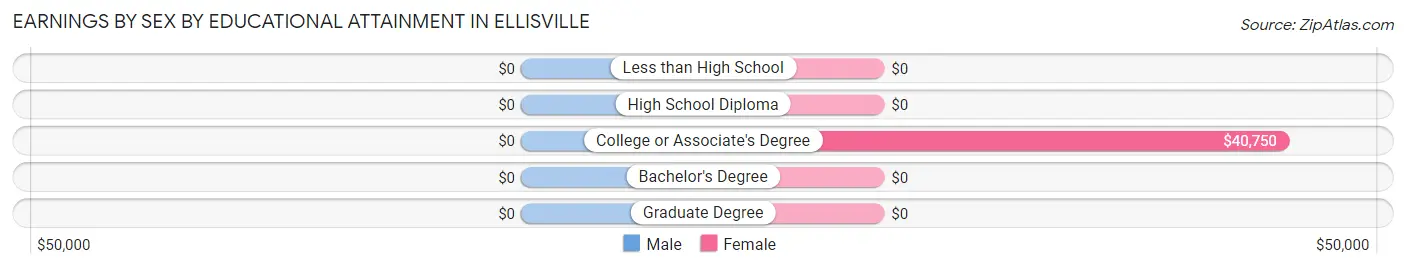
Earnings by Sex by Educational Attainment in Ellisville
| Educational Attainment | Male Income | Female Income |
| Less than High School | - | - |
| High School Diploma | - | - |
| College or Associate's Degree | - | - |
| Bachelor's Degree | - | - |
| Graduate Degree | - | - |
| Total | $29,375 | $0 |
Family Income in Ellisville
Family Income Brackets in Ellisville
According to the Ellisville family income data, there are 14 families falling into the $35,000 to $49,999 income range, which is the most common income bracket and makes up 50.0% of all families.
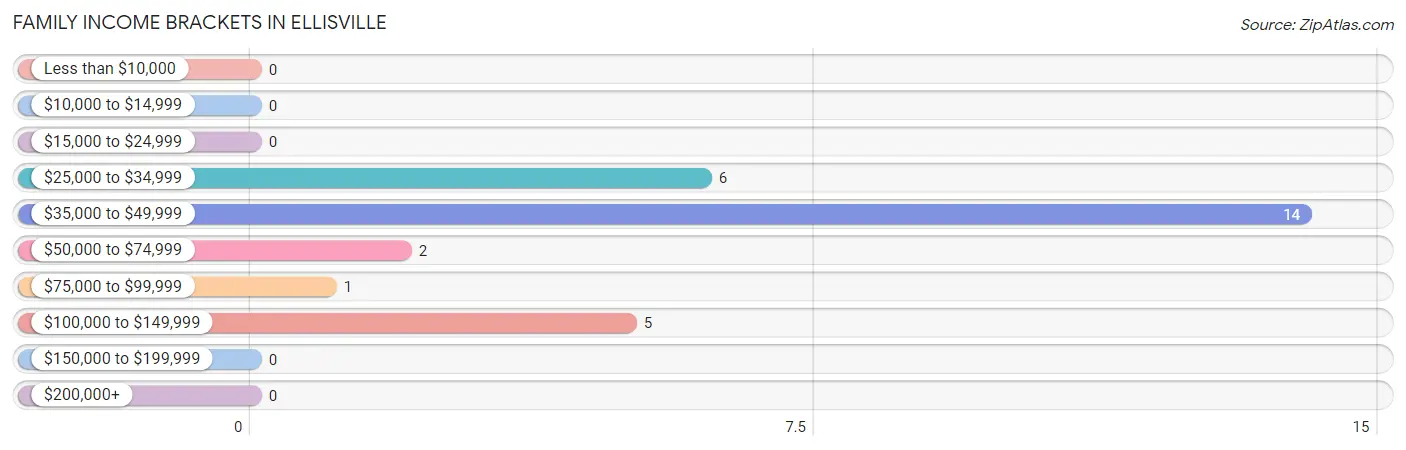
| Income Bracket | # Families | % Families |
| Less than $10,000 | 0 | 0.0% |
| $10,000 to $14,999 | 0 | 0.0% |
| $15,000 to $24,999 | 0 | 0.0% |
| $25,000 to $34,999 | 6 | 21.4% |
| $35,000 to $49,999 | 14 | 50.0% |
| $50,000 to $74,999 | 2 | 7.1% |
| $75,000 to $99,999 | 1 | 3.6% |
| $100,000 to $149,999 | 5 | 17.9% |
| $150,000 to $199,999 | 0 | 0.0% |
| $200,000+ | 0 | 0.0% |
Family Income by Famaliy Size in Ellisville
2-person families (20 | 71.4%) account for the highest median family income in Ellisville with $48,654 per family, while 2-person families (20 | 71.4%) have the highest median income of $24,327 per family member.
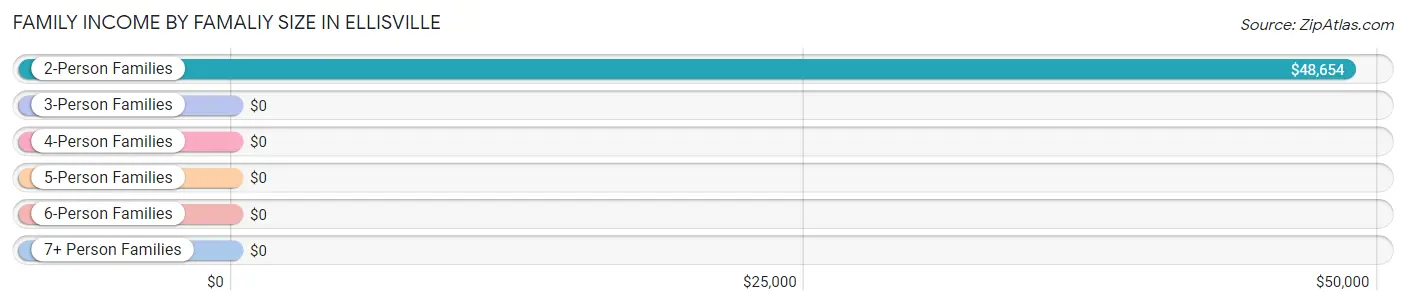
| Income Bracket | # Families | Median Income |
| 2-Person Families | 20 (71.4%) | $48,654 |
| 3-Person Families | 5 (17.9%) | $0 |
| 4-Person Families | 0 (0.0%) | $0 |
| 5-Person Families | 0 (0.0%) | $0 |
| 6-Person Families | 2 (7.1%) | $0 |
| 7+ Person Families | 1 (3.6%) | $0 |
| Total | 28 (100.0%) | $48,846 |
Family Income by Number of Earners in Ellisville
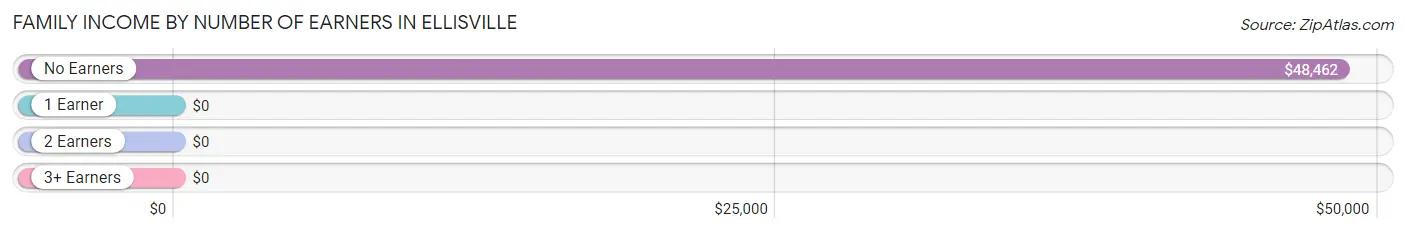
| Number of Earners | # Families | Median Income |
| No Earners | 22 (78.6%) | $48,462 |
| 1 Earner | 2 (7.1%) | $0 |
| 2 Earners | 1 (3.6%) | $0 |
| 3+ Earners | 3 (10.7%) | $0 |
| Total | 28 (100.0%) | $48,846 |
Household Income in Ellisville
Household Income Brackets in Ellisville
With 23 households falling in the category, the $35,000 to $49,999 income range is the most frequent in Ellisville, accounting for 62.2% of all households.
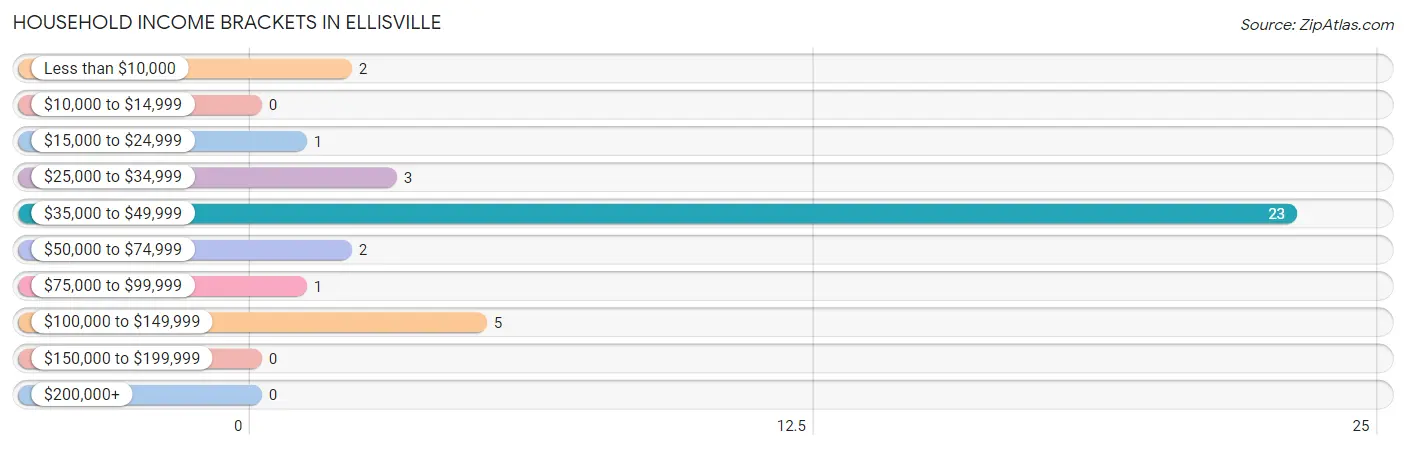
| Income Bracket | # Households | % Households |
| Less than $10,000 | 2 | 5.4% |
| $10,000 to $14,999 | 0 | 0.0% |
| $15,000 to $24,999 | 1 | 2.7% |
| $25,000 to $34,999 | 3 | 8.1% |
| $35,000 to $49,999 | 23 | 62.2% |
| $50,000 to $74,999 | 2 | 5.4% |
| $75,000 to $99,999 | 1 | 2.7% |
| $100,000 to $149,999 | 5 | 13.5% |
| $150,000 to $199,999 | 0 | 0.0% |
| $200,000+ | 0 | 0.0% |
Household Income by Householder Age in Ellisville
The median household income in Ellisville is $47,981, with the highest median household income of $48,365 found in the 65+ years age bracket for the primary householder. A total of 25 households (67.6%) fall into this category.
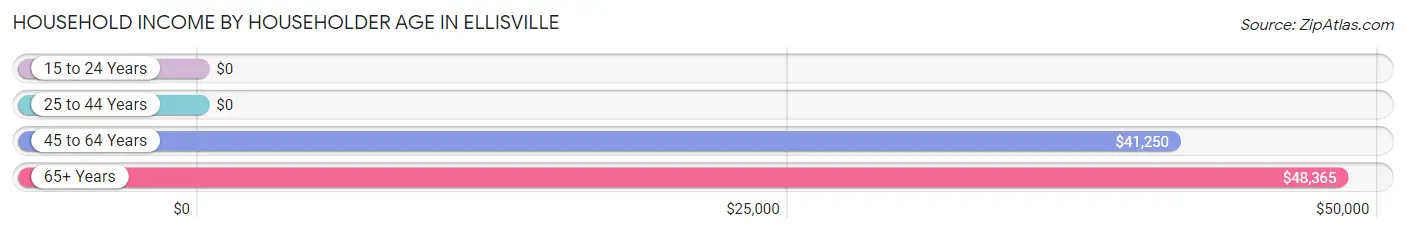
| Income Bracket | # Households | Median Income |
| 15 to 24 Years | 0 (0.0%) | $0 |
| 25 to 44 Years | 3 (8.1%) | $0 |
| 45 to 64 Years | 9 (24.3%) | $41,250 |
| 65+ Years | 25 (67.6%) | $48,365 |
| Total | 37 (100.0%) | $47,981 |
Poverty in Ellisville
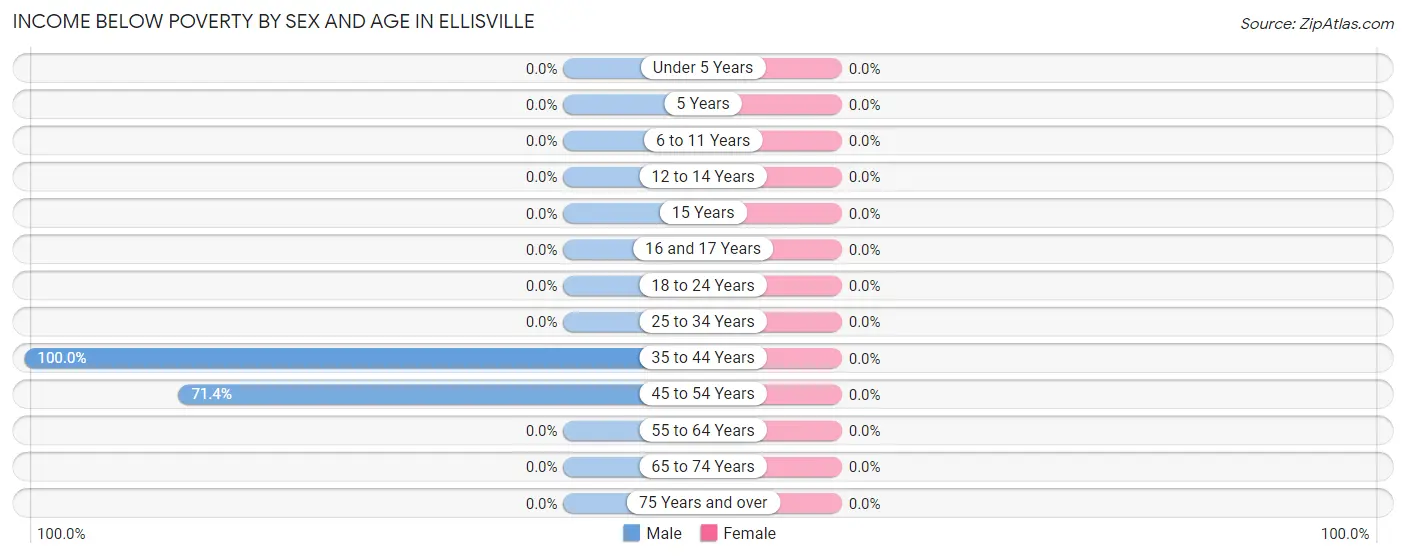
Income Below Poverty by Sex and Age in Ellisville
| Age Bracket | Male | Female |
| Under 5 Years | 0 (0.0%) | 0 (0.0%) |
| 5 Years | 0 (0.0%) | 0 (0.0%) |
| 6 to 11 Years | 0 (0.0%) | 0 (0.0%) |
| 12 to 14 Years | 0 (0.0%) | 0 (0.0%) |
| 15 Years | 0 (0.0%) | 0 (0.0%) |
| 16 and 17 Years | 0 (0.0%) | 0 (0.0%) |
| 18 to 24 Years | 0 (0.0%) | 0 (0.0%) |
| 25 to 34 Years | 0 (0.0%) | 0 (0.0%) |
| 35 to 44 Years | 2 (100.0%) | 0 (0.0%) |
| 45 to 54 Years | 5 (71.4%) | 0 (0.0%) |
| 55 to 64 Years | 0 (0.0%) | 0 (0.0%) |
| 65 to 74 Years | 0 (0.0%) | 0 (0.0%) |
| 75 Years and over | 0 (0.0%) | 0 (0.0%) |
| Total | 7 (15.9%) | 0 (0.0%) |
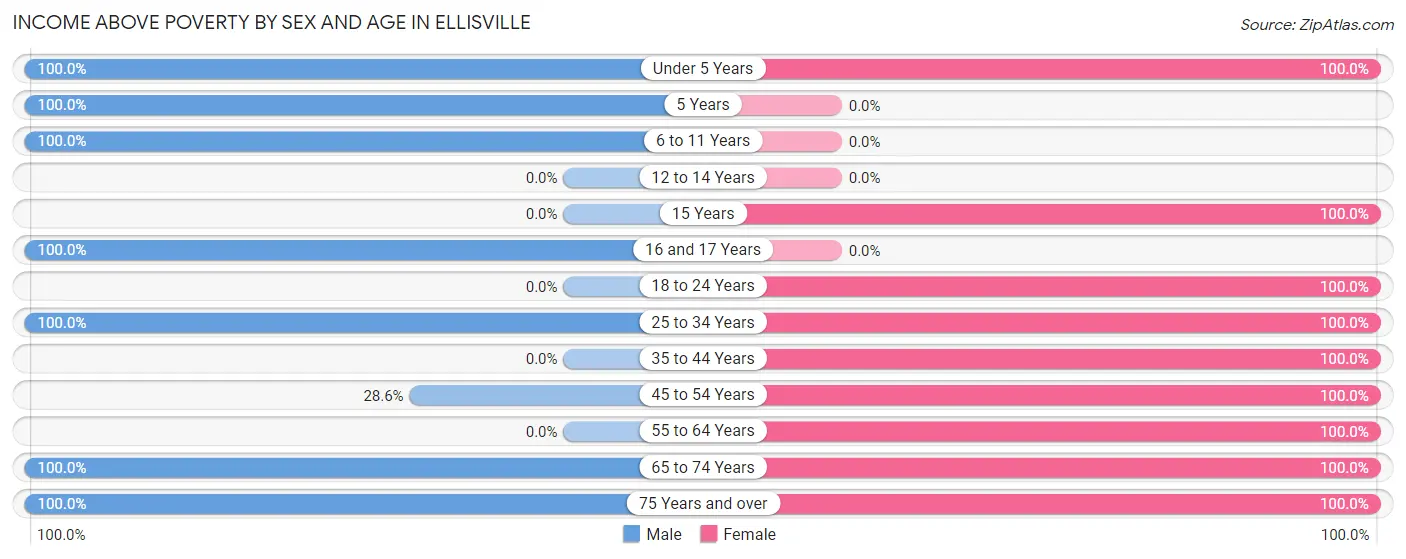
Income Above Poverty by Sex and Age in Ellisville
According to the poverty statistics in Ellisville, males aged under 5 years and females aged under 5 years are the age groups that are most secure financially, with 100.0% of males and 100.0% of females in these age groups living above the poverty line.
| Age Bracket | Male | Female |
| Under 5 Years | 2 (100.0%) | 2 (100.0%) |
| 5 Years | 1 (100.0%) | 0 (0.0%) |
| 6 to 11 Years | 3 (100.0%) | 0 (0.0%) |
| 12 to 14 Years | 0 (0.0%) | 0 (0.0%) |
| 15 Years | 0 (0.0%) | 1 (100.0%) |
| 16 and 17 Years | 1 (100.0%) | 0 (0.0%) |
| 18 to 24 Years | 0 (0.0%) | 3 (100.0%) |
| 25 to 34 Years | 7 (100.0%) | 2 (100.0%) |
| 35 to 44 Years | 0 (0.0%) | 3 (100.0%) |
| 45 to 54 Years | 2 (28.6%) | 4 (100.0%) |
| 55 to 64 Years | 0 (0.0%) | 5 (100.0%) |
| 65 to 74 Years | 6 (100.0%) | 20 (100.0%) |
| 75 Years and over | 15 (100.0%) | 2 (100.0%) |
| Total | 37 (84.1%) | 42 (100.0%) |
Income Below Poverty Among Married-Couple Families in Ellisville
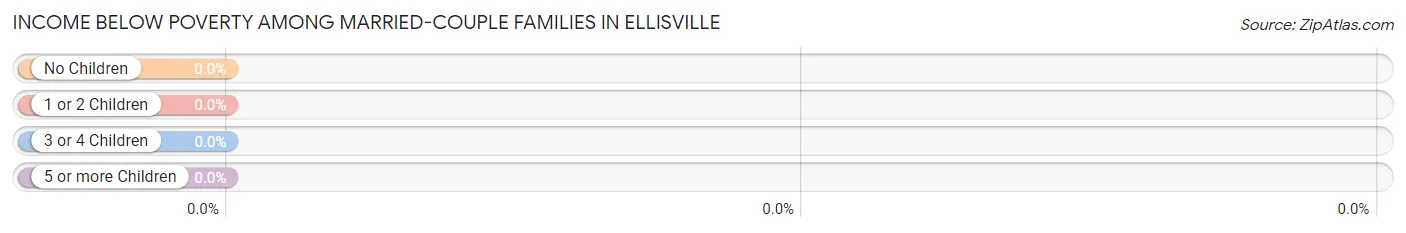
| Children | Above Poverty | Below Poverty |
| No Children | 18 (100.0%) | 0 (0.0%) |
| 1 or 2 Children | 3 (100.0%) | 0 (0.0%) |
| 3 or 4 Children | 0 (0.0%) | 0 (0.0%) |
| 5 or more Children | 1 (100.0%) | 0 (0.0%) |
| Total | 22 (100.0%) | 0 (0.0%) |
Income Below Poverty Among Single-Parent Households in Ellisville
| Children | Single Father | Single Mother |
| No Children | 0 (0.0%) | 0 (0.0%) |
| 1 or 2 Children | 0 (0.0%) | 0 (0.0%) |
| 3 or 4 Children | 0 (0.0%) | 0 (0.0%) |
| 5 or more Children | 0 (0.0%) | 0 (0.0%) |
| Total | 0 (0.0%) | 0 (0.0%) |
Income Below Poverty Among Married-Couple vs Single-Parent Households in Ellisville
| Children | Married-Couple Families | Single-Parent Households |
| No Children | 0 (0.0%) | 0 (0.0%) |
| 1 or 2 Children | 0 (0.0%) | 0 (0.0%) |
| 3 or 4 Children | 0 (0.0%) | 0 (0.0%) |
| 5 or more Children | 0 (0.0%) | 0 (0.0%) |
| Total | 0 (0.0%) | 0 (0.0%) |
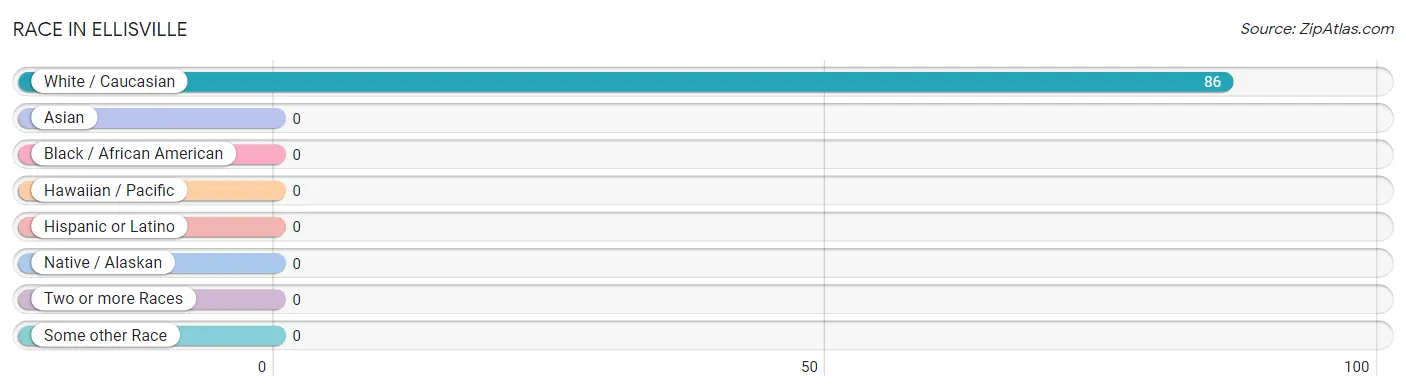
Race in Ellisville
The most populous races in Ellisville are , and White / Caucasian (86 | 100.0%).
| Race | # Population | % Population |
| Asian | 0 | 0.0% |
| Black / African American | 0 | 0.0% |
| Hawaiian / Pacific | 0 | 0.0% |
| Hispanic or Latino | 0 | 0.0% |
| Native / Alaskan | 0 | 0.0% |
| White / Caucasian | 86 | 100.0% |
| Two or more Races | 0 | 0.0% |
| Some other Race | 0 | 0.0% |
| Total | 86 | 100.0% |
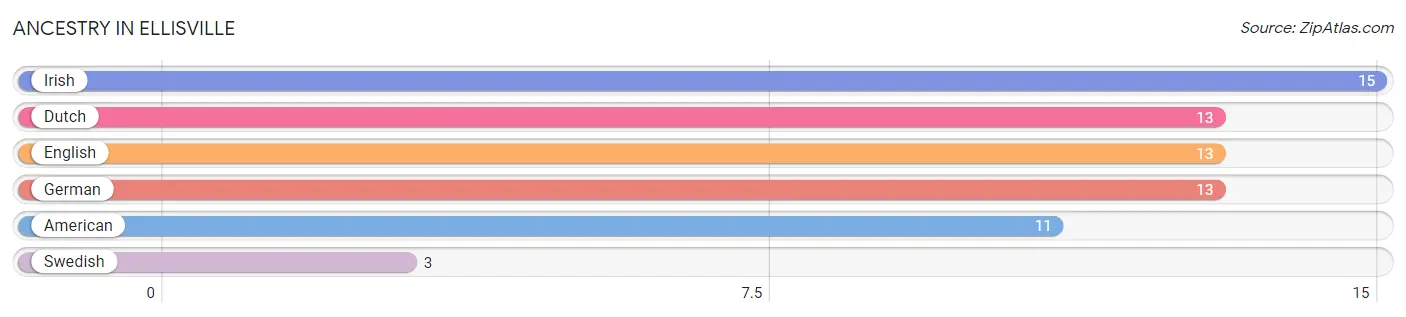
Ancestry in Ellisville
The most populous ancestries reported in Ellisville are Irish (15 | 17.4%), Dutch (13 | 15.1%), English (13 | 15.1%), German (13 | 15.1%), and American (11 | 12.8%), together accounting for 75.6% of all Ellisville residents.
| Ancestry | # Population | % Population |
| American | 11 | 12.8% |
| Dutch | 13 | 15.1% |
| English | 13 | 15.1% |
| German | 13 | 15.1% |
| Irish | 15 | 17.4% |
| Swedish | 3 | 3.5% | View All 6 Rows |
Immigrants in Ellisville

| Immigration Origin | # Population | % Population | View All 0 Rows |
Sex and Age in Ellisville
Sex and Age in Ellisville
The most populous age groups in Ellisville are 75 to 79 Years (13 | 29.5%) for men and 70 to 74 Years (14 | 33.3%) for women.
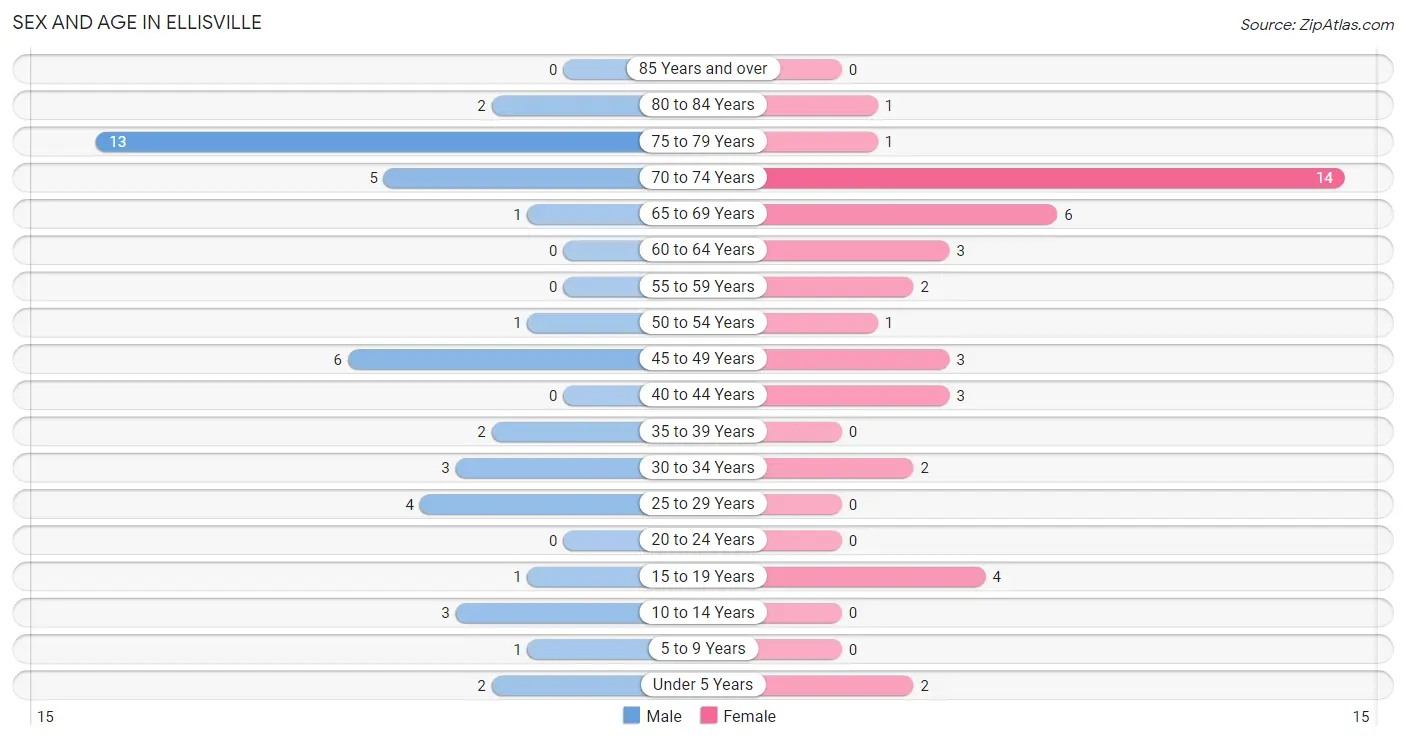
| Age Bracket | Male | Female |
| Under 5 Years | 2 (4.5%) | 2 (4.8%) |
| 5 to 9 Years | 1 (2.3%) | 0 (0.0%) |
| 10 to 14 Years | 3 (6.8%) | 0 (0.0%) |
| 15 to 19 Years | 1 (2.3%) | 4 (9.5%) |
| 20 to 24 Years | 0 (0.0%) | 0 (0.0%) |
| 25 to 29 Years | 4 (9.1%) | 0 (0.0%) |
| 30 to 34 Years | 3 (6.8%) | 2 (4.8%) |
| 35 to 39 Years | 2 (4.5%) | 0 (0.0%) |
| 40 to 44 Years | 0 (0.0%) | 3 (7.1%) |
| 45 to 49 Years | 6 (13.6%) | 3 (7.1%) |
| 50 to 54 Years | 1 (2.3%) | 1 (2.4%) |
| 55 to 59 Years | 0 (0.0%) | 2 (4.8%) |
| 60 to 64 Years | 0 (0.0%) | 3 (7.1%) |
| 65 to 69 Years | 1 (2.3%) | 6 (14.3%) |
| 70 to 74 Years | 5 (11.4%) | 14 (33.3%) |
| 75 to 79 Years | 13 (29.5%) | 1 (2.4%) |
| 80 to 84 Years | 2 (4.5%) | 1 (2.4%) |
| 85 Years and over | 0 (0.0%) | 0 (0.0%) |
| Total | 44 (100.0%) | 42 (100.0%) |
Families and Households in Ellisville
Median Family Size in Ellisville
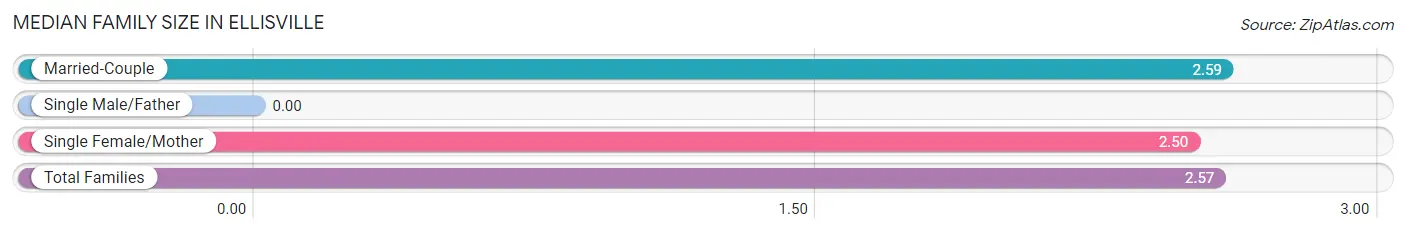
| Family Type | # Families | Family Size |
| Married-Couple | 22 (78.6%) | 2.59 |
| Single Male/Father | 0 (0.0%) | - |
| Single Female/Mother | 6 (21.4%) | 2.50 |
| Total Families | 28 (100.0%) | 2.57 |
Median Household Size in Ellisville
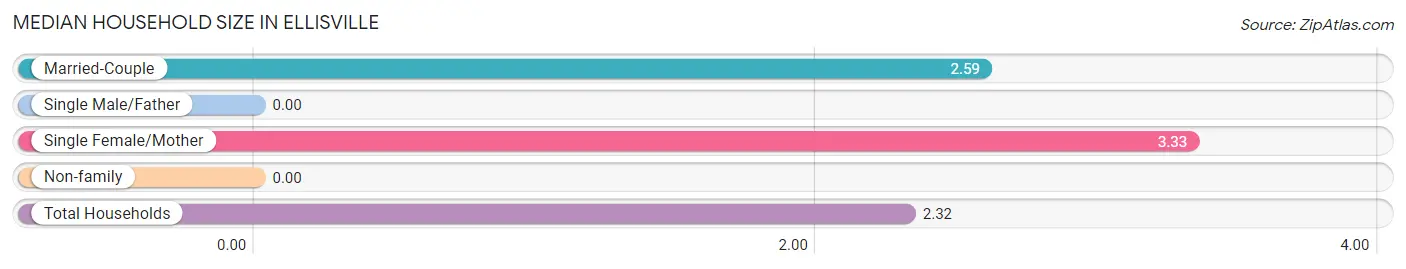
| Household Type | # Households | Household Size |
| Married-Couple | 22 (59.5%) | 2.59 |
| Single Male/Father | 0 (0.0%) | - |
| Single Female/Mother | 6 (16.2%) | 3.33 |
| Non-family | 9 (24.3%) | - |
| Total Households | 37 (100.0%) | 2.32 |
Household Size by Marriage Status in Ellisville
Out of a total of 37 households in Ellisville, 28 (75.7%) are family households, while 9 (24.3%) are nonfamily households. The most numerous type of family households are 2-person households, comprising 20, and the most common type of nonfamily households are 1-person households, comprising 9.
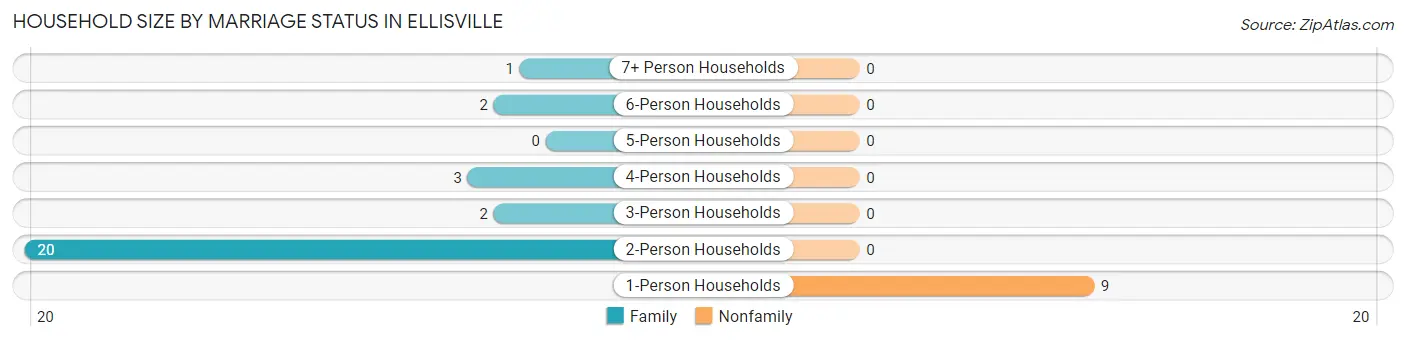
| Household Size | Family Households | Nonfamily Households |
| 1-Person Households | - | 9 (24.3%) |
| 2-Person Households | 20 (54.0%) | 0 (0.0%) |
| 3-Person Households | 2 (5.4%) | 0 (0.0%) |
| 4-Person Households | 3 (8.1%) | 0 (0.0%) |
| 5-Person Households | 0 (0.0%) | 0 (0.0%) |
| 6-Person Households | 2 (5.4%) | 0 (0.0%) |
| 7+ Person Households | 1 (2.7%) | 0 (0.0%) |
| Total | 28 (75.7%) | 9 (24.3%) |
Female Fertility in Ellisville
Fertility by Age in Ellisville
| Age Bracket | Women with Births | Births / 1,000 Women |
| 15 to 19 years | 0 (0.0%) | 0.0 |
| 20 to 34 years | 0 (0.0%) | 0.0 |
| 35 to 50 years | 0 (0.0%) | 0.0 |
| Total | 0 (0.0%) | 0.0 |
Fertility by Age by Marriage Status in Ellisville
| Age Bracket | Married | Unmarried |
| 15 to 19 years | 0 (0.0%) | 0 (0.0%) |
| 20 to 34 years | 0 (0.0%) | 0 (0.0%) |
| 35 to 50 years | 0 (0.0%) | 0 (0.0%) |
| Total | 0 (0.0%) | 0 (0.0%) |
Fertility by Education in Ellisville
| Educational Attainment | Women with Births | Births / 1,000 Women |
| Less than High School | 0 (0.0%) | 0.0 |
| High School Diploma | 0 (0.0%) | 0.0 |
| College or Associate's Degree | 0 (0.0%) | 0.0 |
| Bachelor's Degree | 0 (0.0%) | 0.0 |
| Graduate Degree | 0 (0.0%) | 0.0 |
| Total | 0 (0.0%) | 0.0 |
Fertility by Education by Marriage Status in Ellisville
| Educational Attainment | Married | Unmarried |
| Less than High School | 0 (0.0%) | 0 (0.0%) |
| High School Diploma | 0 (0.0%) | 0 (0.0%) |
| College or Associate's Degree | 0 (0.0%) | 0 (0.0%) |
| Bachelor's Degree | 0 (0.0%) | 0 (0.0%) |
| Graduate Degree | 0 (0.0%) | 0 (0.0%) |
| Total | 0 (0.0%) | 0 (0.0%) |
Employment Characteristics in Ellisville
Employment by Class of Employer in Ellisville
Among the 19 employed individuals in Ellisville, private company employees (12 | 63.2%), local government employees (4 | 21.0%), and self-employed (incorporated) (1 | 5.3%) make up the most common classes of employment.
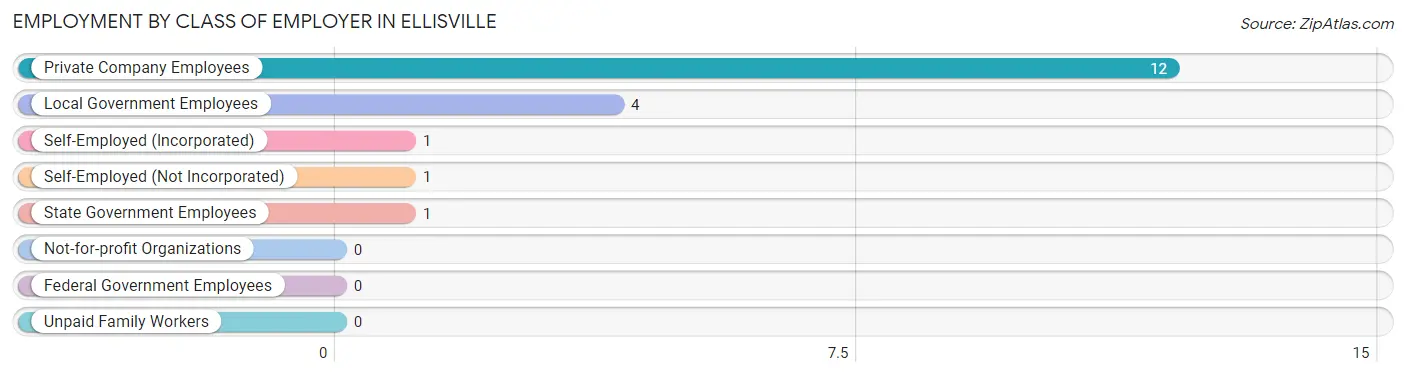
| Employer Class | # Employees | % Employees |
| Private Company Employees | 12 | 63.2% |
| Self-Employed (Incorporated) | 1 | 5.3% |
| Self-Employed (Not Incorporated) | 1 | 5.3% |
| Not-for-profit Organizations | 0 | 0.0% |
| Local Government Employees | 4 | 21.0% |
| State Government Employees | 1 | 5.3% |
| Federal Government Employees | 0 | 0.0% |
| Unpaid Family Workers | 0 | 0.0% |
| Total | 19 | 100.0% |
Employment Status by Age in Ellisville
According to the labor force statistics for Ellisville, out of the total population over 16 years of age (77), 26.0% or 20 individuals are in the labor force, with 5.0% or 1 of them unemployed. The age group with the highest labor force participation rate is 55 to 59 years, with 100.0% or 2 individuals in the labor force. Within the labor force, the 45 to 54 years age range has the highest percentage of unemployed individuals, with 33.3% or 1 of them being unemployed.
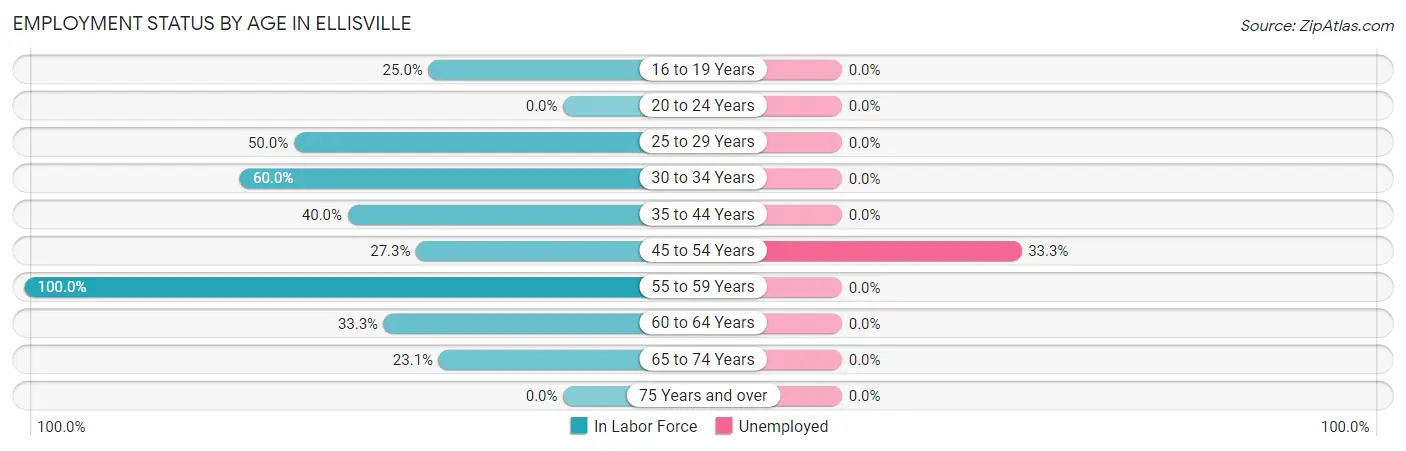
| Age Bracket | In Labor Force | Unemployed |
| 16 to 19 Years | 1 (25.0%) | 0 (0.0%) |
| 20 to 24 Years | 0 (0.0%) | 0 (0.0%) |
| 25 to 29 Years | 2 (50.0%) | 0 (0.0%) |
| 30 to 34 Years | 3 (60.0%) | 0 (0.0%) |
| 35 to 44 Years | 2 (40.0%) | 0 (0.0%) |
| 45 to 54 Years | 3 (27.3%) | 1 (33.3%) |
| 55 to 59 Years | 2 (100.0%) | 0 (0.0%) |
| 60 to 64 Years | 1 (33.3%) | 0 (0.0%) |
| 65 to 74 Years | 6 (23.1%) | 0 (0.0%) |
| 75 Years and over | 0 (0.0%) | 0 (0.0%) |
| Total | 20 (26.0%) | 1 (5.0%) |
Employment Status by Educational Attainment in Ellisville
According to labor force statistics for Ellisville, 43.3% of individuals (13) out of the total population between 25 and 64 years of age (30) are in the labor force, with 7.7% or 1 of them being unemployed. The group with the highest labor force participation rate are those with the educational attainment of bachelor's degree or higher, with 100.0% or 2 individuals in the labor force. Within the labor force, individuals with college / associate degree education have the highest percentage of unemployment, with 25.0% or 1 of them being unemployed.

| Educational Attainment | In Labor Force | Unemployed |
| Less than High School | 3 (25.0%) | 0 (0.0%) |
| High School Diploma | 4 (57.1%) | 0 (0.0%) |
| College / Associate Degree | 4 (44.4%) | 2 (25.0%) |
| Bachelor's Degree or higher | 2 (100.0%) | 0 (0.0%) |
| Total | 13 (43.3%) | 2 (7.7%) |
Employment Occupations by Sex in Ellisville
Management, Business, Science and Arts Occupations
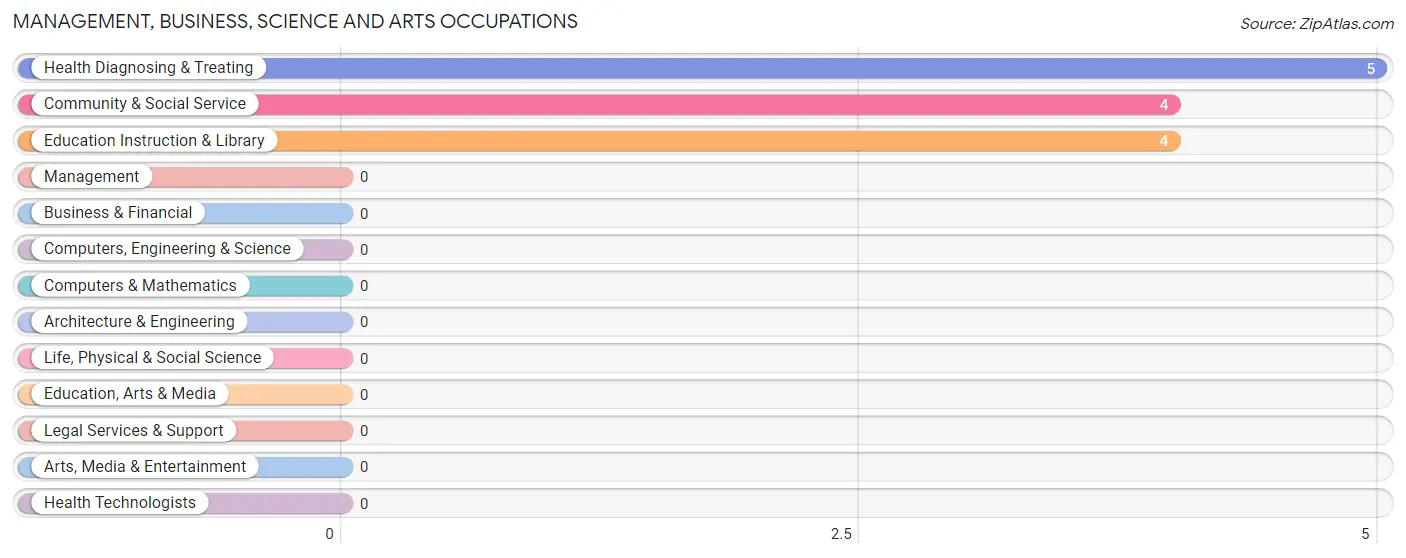
The most common Management, Business, Science and Arts occupations in Ellisville are Health Diagnosing & Treating (5 | 26.3%), Community & Social Service (4 | 21.0%), and Education Instruction & Library (4 | 21.0%).
Management, Business, Science and Arts Occupations by Sex
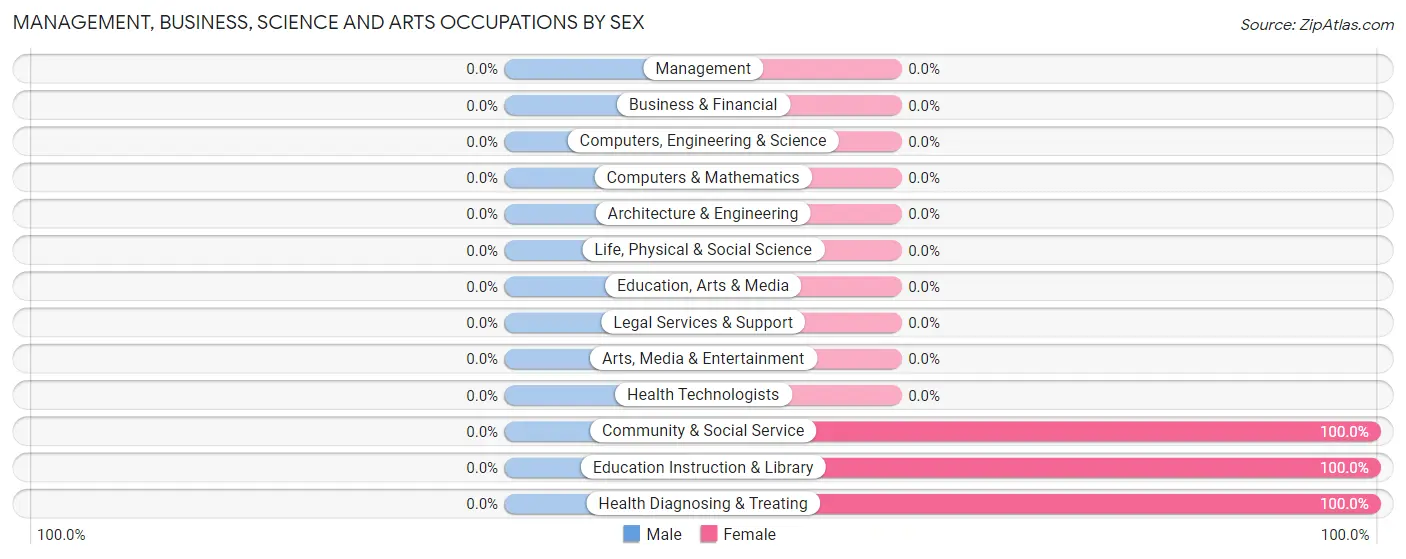
| Occupation | Male | Female |
| Management | 0 (0.0%) | 0 (0.0%) |
| Business & Financial | 0 (0.0%) | 0 (0.0%) |
| Computers, Engineering & Science | 0 (0.0%) | 0 (0.0%) |
| Computers & Mathematics | 0 (0.0%) | 0 (0.0%) |
| Architecture & Engineering | 0 (0.0%) | 0 (0.0%) |
| Life, Physical & Social Science | 0 (0.0%) | 0 (0.0%) |
| Community & Social Service | 0 (0.0%) | 4 (100.0%) |
| Education, Arts & Media | 0 (0.0%) | 0 (0.0%) |
| Legal Services & Support | 0 (0.0%) | 0 (0.0%) |
| Education Instruction & Library | 0 (0.0%) | 4 (100.0%) |
| Arts, Media & Entertainment | 0 (0.0%) | 0 (0.0%) |
| Health Diagnosing & Treating | 0 (0.0%) | 5 (100.0%) |
| Health Technologists | 0 (0.0%) | 0 (0.0%) |
| Total (Category) | 0 (0.0%) | 9 (100.0%) |
| Total (Overall) | 5 (26.3%) | 14 (73.7%) |
Services Occupations
The most common Services occupations in Ellisville are Healthcare Support (2 | 10.5%), Food Preparation & Serving (2 | 10.5%), and Cleaning & Maintenance (1 | 5.3%).
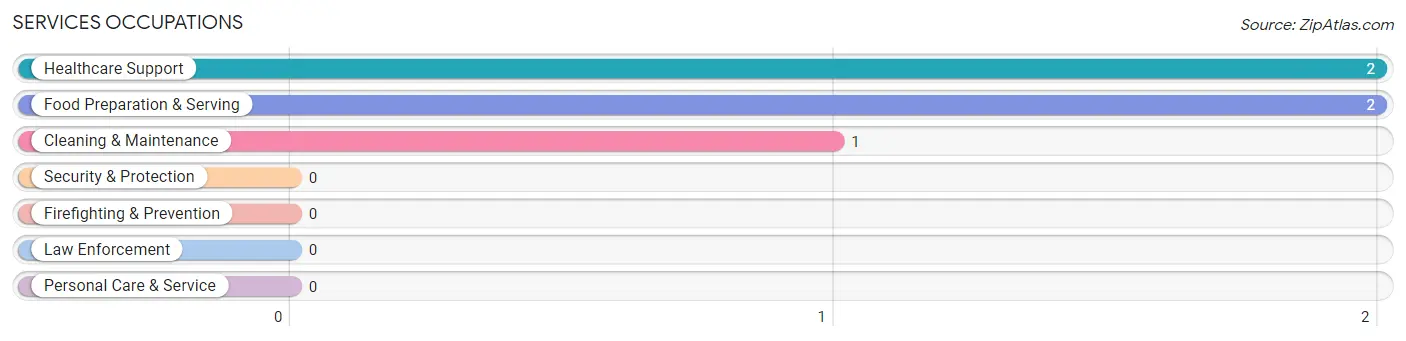
Services Occupations by Sex
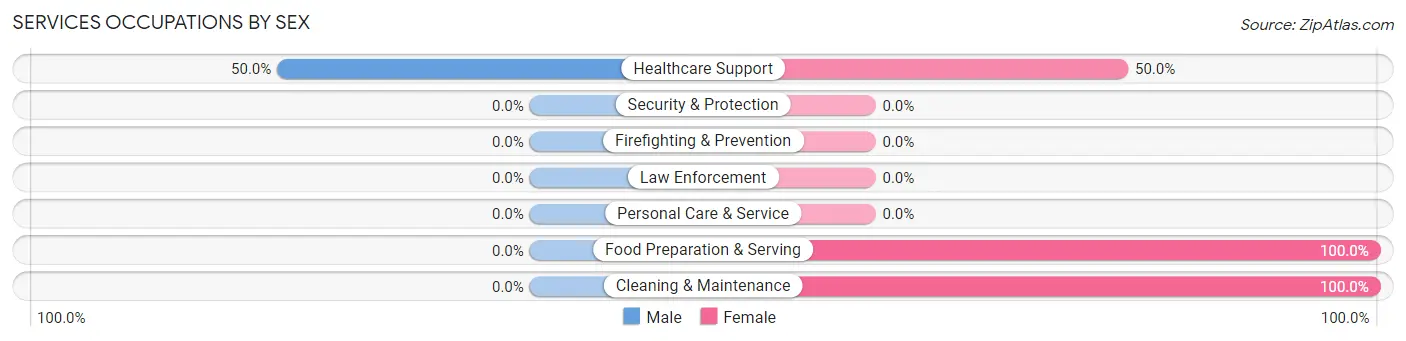
| Occupation | Male | Female |
| Healthcare Support | 1 (50.0%) | 1 (50.0%) |
| Security & Protection | 0 (0.0%) | 0 (0.0%) |
| Firefighting & Prevention | 0 (0.0%) | 0 (0.0%) |
| Law Enforcement | 0 (0.0%) | 0 (0.0%) |
| Food Preparation & Serving | 0 (0.0%) | 2 (100.0%) |
| Cleaning & Maintenance | 0 (0.0%) | 1 (100.0%) |
| Personal Care & Service | 0 (0.0%) | 0 (0.0%) |
| Total (Category) | 1 (20.0%) | 4 (80.0%) |
| Total (Overall) | 5 (26.3%) | 14 (73.7%) |
Sales and Office Occupations
The most common Sales and Office occupations in Ellisville are Sales & Related (2 | 10.5%), and Office & Administration (2 | 10.5%).

Sales and Office Occupations by Sex

| Occupation | Male | Female |
| Sales & Related | 1 (50.0%) | 1 (50.0%) |
| Office & Administration | 2 (100.0%) | 0 (0.0%) |
| Total (Category) | 3 (75.0%) | 1 (25.0%) |
| Total (Overall) | 5 (26.3%) | 14 (73.7%) |
Natural Resources, Construction and Maintenance Occupations
The most common Natural Resources, Construction and Maintenance occupations in Ellisville are , and Farming, Fishing & Forestry (1 | 5.3%).

Natural Resources, Construction and Maintenance Occupations by Sex

| Occupation | Male | Female |
| Farming, Fishing & Forestry | 1 (100.0%) | 0 (0.0%) |
| Construction & Extraction | 0 (0.0%) | 0 (0.0%) |
| Installation, Maintenance & Repair | 0 (0.0%) | 0 (0.0%) |
| Total (Category) | 1 (100.0%) | 0 (0.0%) |
| Total (Overall) | 5 (26.3%) | 14 (73.7%) |
Production, Transportation and Moving Occupations
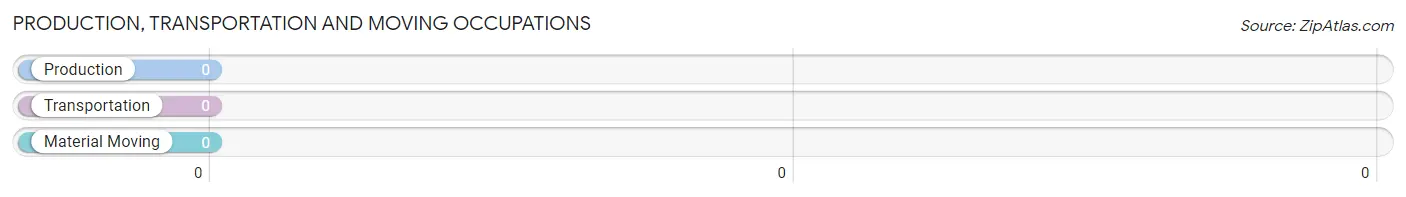
Production, Transportation and Moving Occupations by Sex
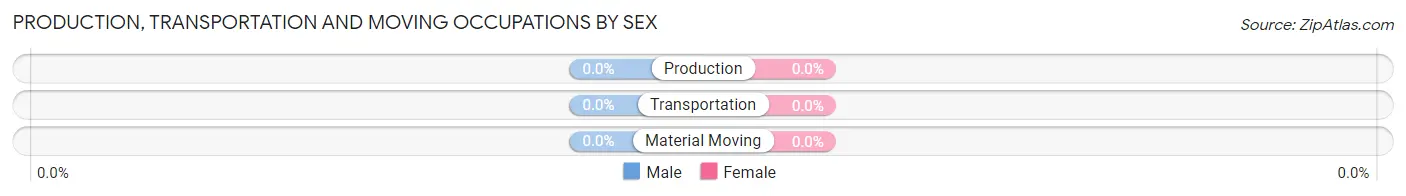
| Occupation | Male | Female |
| Production | 0 (0.0%) | 0 (0.0%) |
| Transportation | 0 (0.0%) | 0 (0.0%) |
| Material Moving | 0 (0.0%) | 0 (0.0%) |
| Total (Category) | 0 (0.0%) | 0 (0.0%) |
| Total (Overall) | 5 (26.3%) | 14 (73.7%) |
Employment Industries by Sex in Ellisville
Employment Industries in Ellisville
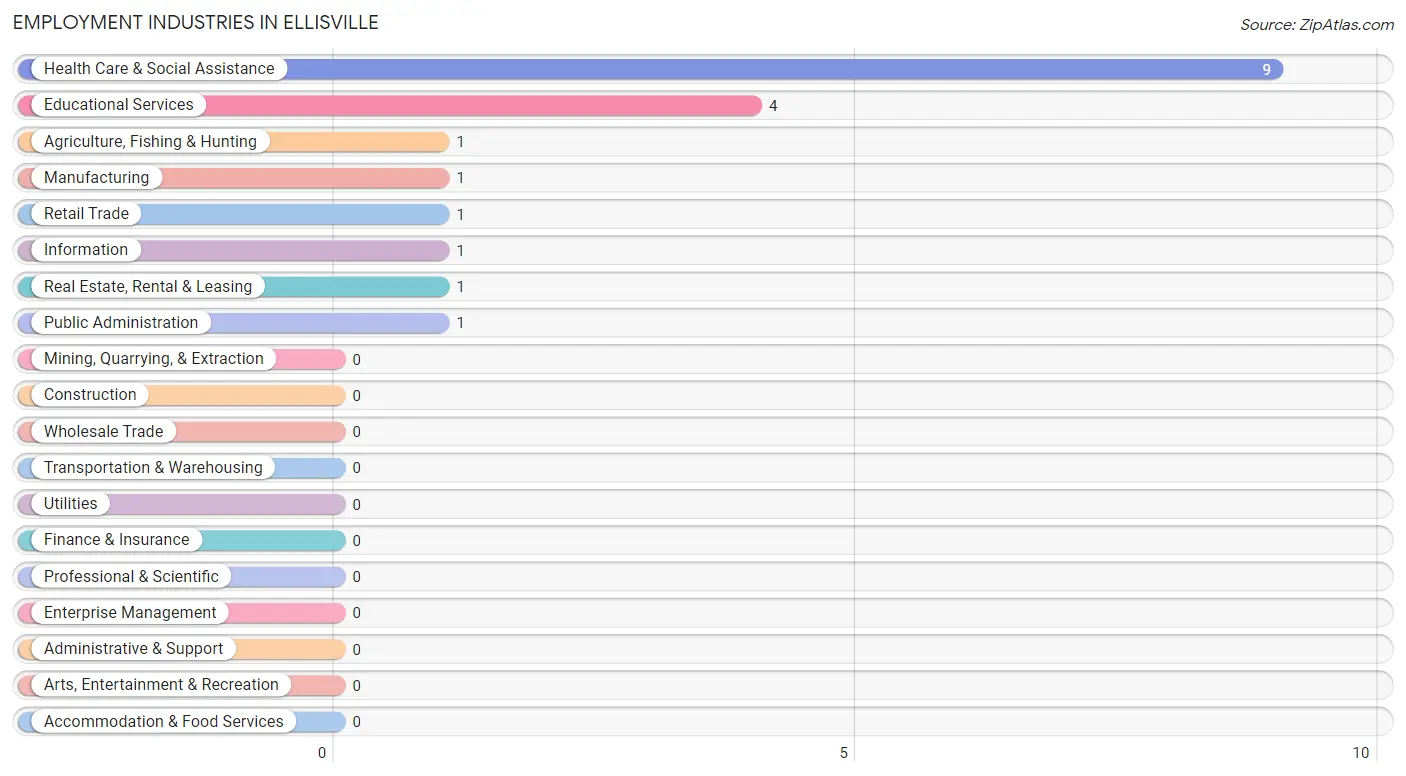
The major employment industries in Ellisville include Health Care & Social Assistance (9 | 47.4%), Educational Services (4 | 21.0%), Agriculture, Fishing & Hunting (1 | 5.3%), Manufacturing (1 | 5.3%), and Retail Trade (1 | 5.3%).
Employment Industries by Sex in Ellisville
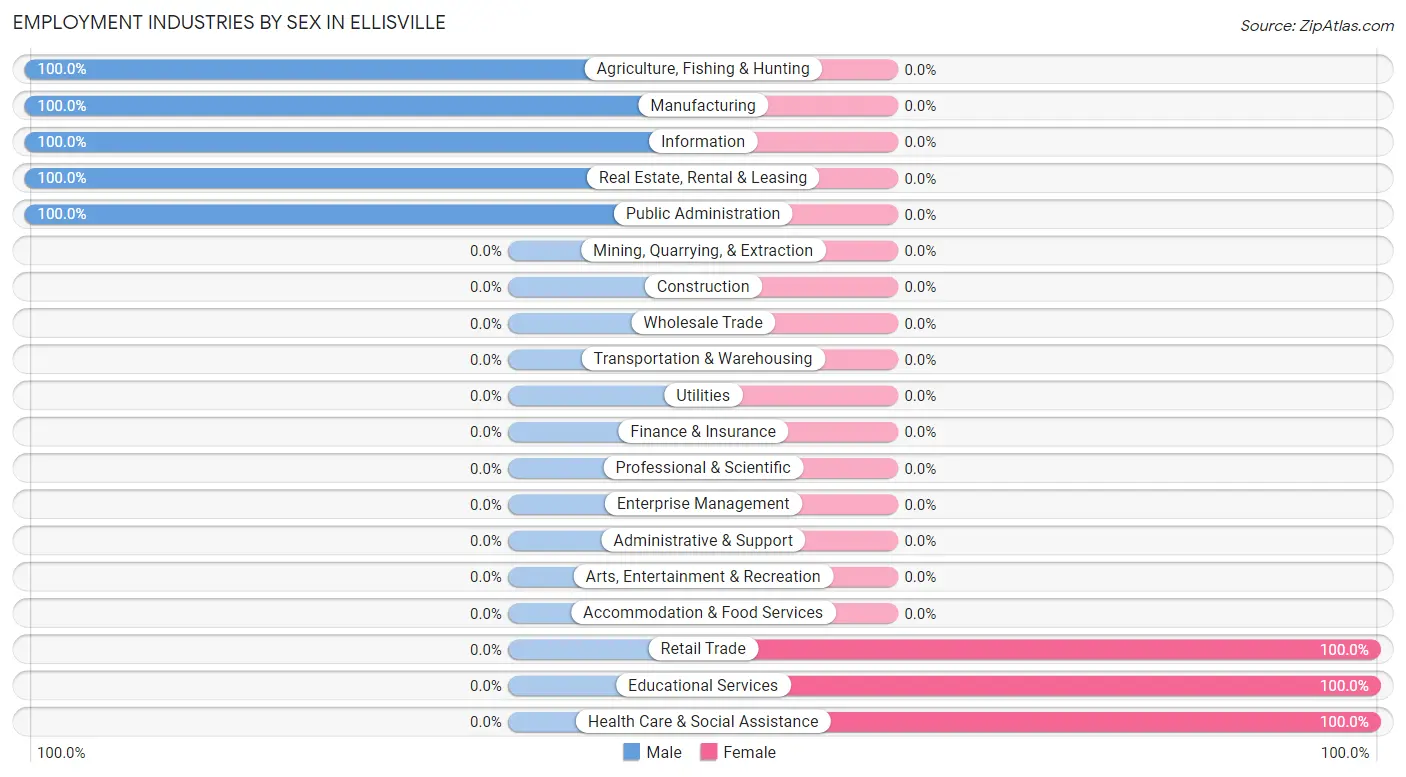
The Ellisville industries that see more men than women are Agriculture, Fishing & Hunting (100.0%), Manufacturing (100.0%), and Information (100.0%), whereas the industries that tend to have a higher number of women are Retail Trade (100.0%), Educational Services (100.0%), and Health Care & Social Assistance (100.0%).
| Industry | Male | Female |
| Agriculture, Fishing & Hunting | 1 (100.0%) | 0 (0.0%) |
| Mining, Quarrying, & Extraction | 0 (0.0%) | 0 (0.0%) |
| Construction | 0 (0.0%) | 0 (0.0%) |
| Manufacturing | 1 (100.0%) | 0 (0.0%) |
| Wholesale Trade | 0 (0.0%) | 0 (0.0%) |
| Retail Trade | 0 (0.0%) | 1 (100.0%) |
| Transportation & Warehousing | 0 (0.0%) | 0 (0.0%) |
| Utilities | 0 (0.0%) | 0 (0.0%) |
| Information | 1 (100.0%) | 0 (0.0%) |
| Finance & Insurance | 0 (0.0%) | 0 (0.0%) |
| Real Estate, Rental & Leasing | 1 (100.0%) | 0 (0.0%) |
| Professional & Scientific | 0 (0.0%) | 0 (0.0%) |
| Enterprise Management | 0 (0.0%) | 0 (0.0%) |
| Administrative & Support | 0 (0.0%) | 0 (0.0%) |
| Educational Services | 0 (0.0%) | 4 (100.0%) |
| Health Care & Social Assistance | 0 (0.0%) | 9 (100.0%) |
| Arts, Entertainment & Recreation | 0 (0.0%) | 0 (0.0%) |
| Accommodation & Food Services | 0 (0.0%) | 0 (0.0%) |
| Public Administration | 1 (100.0%) | 0 (0.0%) |
| Total | 5 (26.3%) | 14 (73.7%) |
Education in Ellisville
School Enrollment in Ellisville
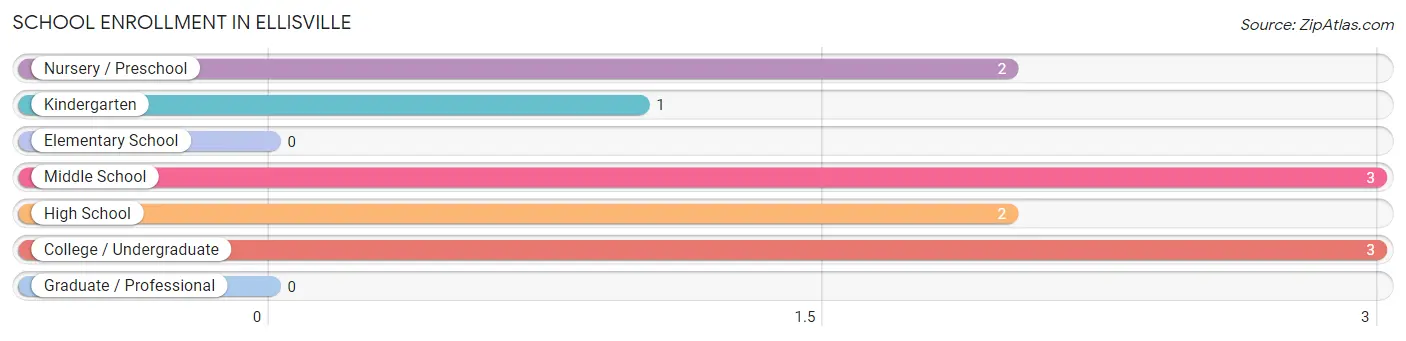
The most common levels of schooling among the 11 students in Ellisville are middle school (3 | 27.3%), college / undergraduate (3 | 27.3%), and nursery / preschool (2 | 18.2%).
| School Level | # Students | % Students |
| Nursery / Preschool | 2 | 18.2% |
| Kindergarten | 1 | 9.1% |
| Elementary School | 0 | 0.0% |
| Middle School | 3 | 27.3% |
| High School | 2 | 18.2% |
| College / Undergraduate | 3 | 27.3% |
| Graduate / Professional | 0 | 0.0% |
| Total | 11 | 100.0% |
School Enrollment by Age by Funding Source in Ellisville
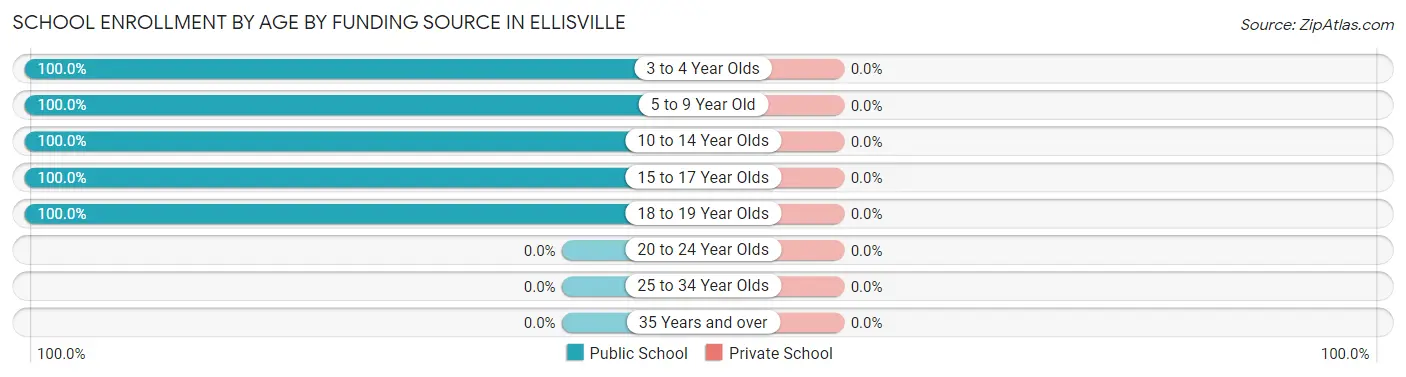
| Age Bracket | Public School | Private School |
| 3 to 4 Year Olds | 2 (100.0%) | 0 (0.0%) |
| 5 to 9 Year Old | 1 (100.0%) | 0 (0.0%) |
| 10 to 14 Year Olds | 3 (100.0%) | 0 (0.0%) |
| 15 to 17 Year Olds | 2 (100.0%) | 0 (0.0%) |
| 18 to 19 Year Olds | 3 (100.0%) | 0 (0.0%) |
| 20 to 24 Year Olds | 0 (0.0%) | 0 (0.0%) |
| 25 to 34 Year Olds | 0 (0.0%) | 0 (0.0%) |
| 35 Years and over | 0 (0.0%) | 0 (0.0%) |
| Total | 11 (100.0%) | 0 (0.0%) |
Educational Attainment by Field of Study in Ellisville
, and education (2 | 100.0%) are the most common fields of study among 2 individuals in Ellisville who have obtained a bachelor's degree or higher.
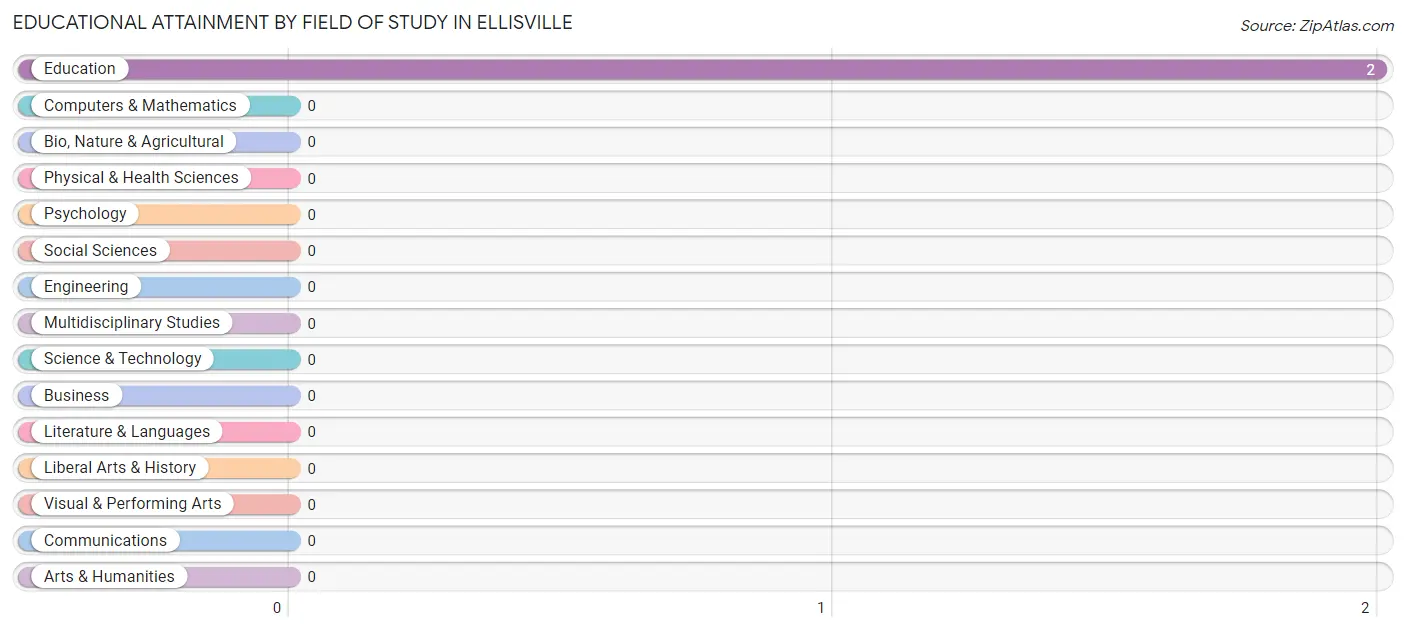
| Field of Study | # Graduates | % Graduates |
| Computers & Mathematics | 0 | 0.0% |
| Bio, Nature & Agricultural | 0 | 0.0% |
| Physical & Health Sciences | 0 | 0.0% |
| Psychology | 0 | 0.0% |
| Social Sciences | 0 | 0.0% |
| Engineering | 0 | 0.0% |
| Multidisciplinary Studies | 0 | 0.0% |
| Science & Technology | 0 | 0.0% |
| Business | 0 | 0.0% |
| Education | 2 | 100.0% |
| Literature & Languages | 0 | 0.0% |
| Liberal Arts & History | 0 | 0.0% |
| Visual & Performing Arts | 0 | 0.0% |
| Communications | 0 | 0.0% |
| Arts & Humanities | 0 | 0.0% |
| Total | 2 | 100.0% |
Transportation & Commute in Ellisville
Vehicle Availability by Sex in Ellisville
The most prevalent vehicle ownership categories in Ellisville are males with 1 vehicle (1, accounting for 20.0%) and females with 1 vehicle (6, making up 7.1%).
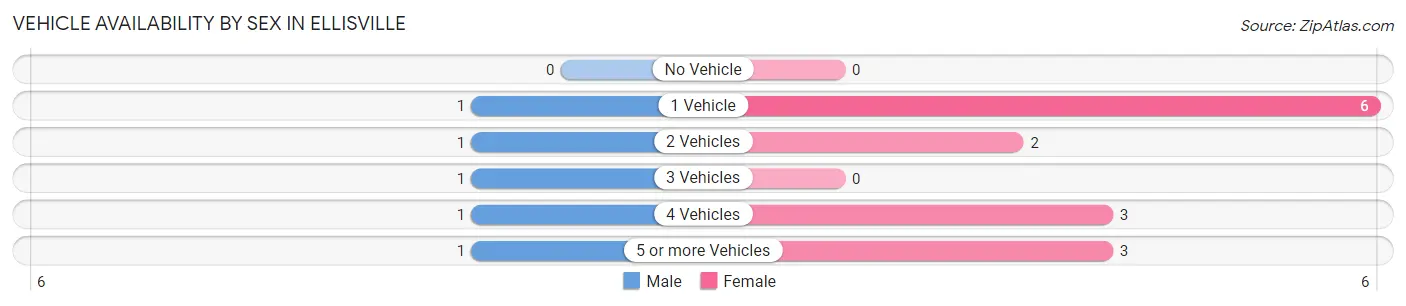
| Vehicles Available | Male | Female |
| No Vehicle | 0 (0.0%) | 0 (0.0%) |
| 1 Vehicle | 1 (20.0%) | 6 (42.9%) |
| 2 Vehicles | 1 (20.0%) | 2 (14.3%) |
| 3 Vehicles | 1 (20.0%) | 0 (0.0%) |
| 4 Vehicles | 1 (20.0%) | 3 (21.4%) |
| 5 or more Vehicles | 1 (20.0%) | 3 (21.4%) |
| Total | 5 (100.0%) | 14 (100.0%) |
Commute Time in Ellisville
The most frequently occuring commute durations in Ellisville are 20 to 24 minutes (7 commuters, 36.8%), 30 to 34 minutes (3 commuters, 15.8%), and 40 to 44 minutes (3 commuters, 15.8%).
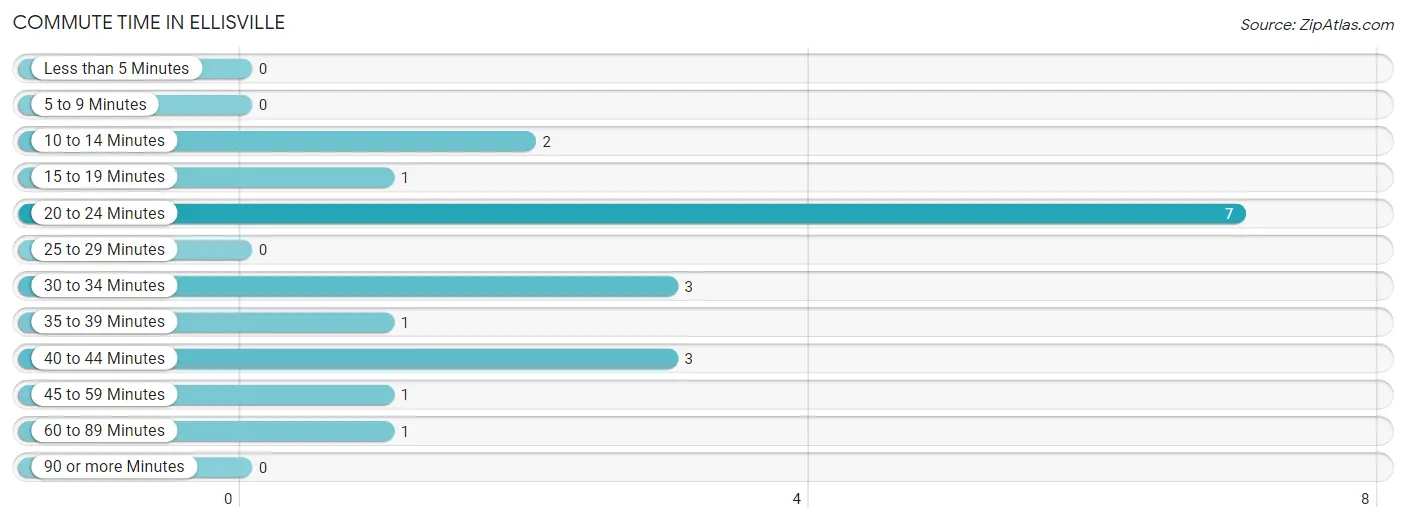
| Commute Time | # Commuters | % Commuters |
| Less than 5 Minutes | 0 | 0.0% |
| 5 to 9 Minutes | 0 | 0.0% |
| 10 to 14 Minutes | 2 | 10.5% |
| 15 to 19 Minutes | 1 | 5.3% |
| 20 to 24 Minutes | 7 | 36.8% |
| 25 to 29 Minutes | 0 | 0.0% |
| 30 to 34 Minutes | 3 | 15.8% |
| 35 to 39 Minutes | 1 | 5.3% |
| 40 to 44 Minutes | 3 | 15.8% |
| 45 to 59 Minutes | 1 | 5.3% |
| 60 to 89 Minutes | 1 | 5.3% |
| 90 or more Minutes | 0 | 0.0% |
Commute Time by Sex in Ellisville
The most common commute times in Ellisville are 10 to 14 minutes (1 commuters, 20.0%) for males and 20 to 24 minutes (7 commuters, 50.0%) for females.
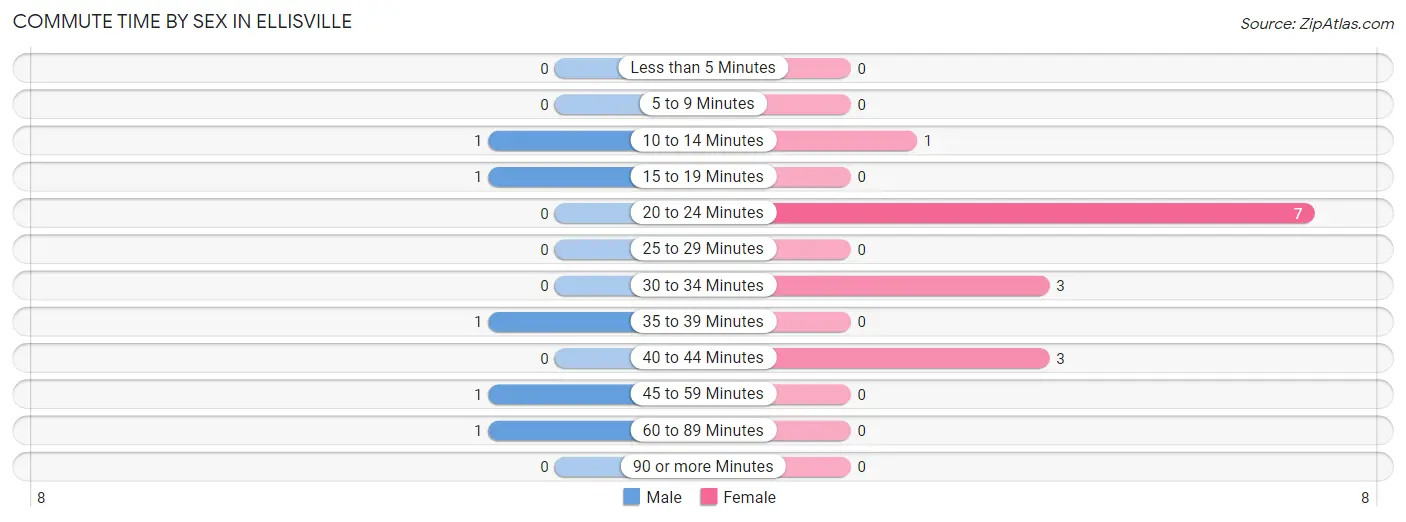
| Commute Time | Male | Female |
| Less than 5 Minutes | 0 (0.0%) | 0 (0.0%) |
| 5 to 9 Minutes | 0 (0.0%) | 0 (0.0%) |
| 10 to 14 Minutes | 1 (20.0%) | 1 (7.1%) |
| 15 to 19 Minutes | 1 (20.0%) | 0 (0.0%) |
| 20 to 24 Minutes | 0 (0.0%) | 7 (50.0%) |
| 25 to 29 Minutes | 0 (0.0%) | 0 (0.0%) |
| 30 to 34 Minutes | 0 (0.0%) | 3 (21.4%) |
| 35 to 39 Minutes | 1 (20.0%) | 0 (0.0%) |
| 40 to 44 Minutes | 0 (0.0%) | 3 (21.4%) |
| 45 to 59 Minutes | 1 (20.0%) | 0 (0.0%) |
| 60 to 89 Minutes | 1 (20.0%) | 0 (0.0%) |
| 90 or more Minutes | 0 (0.0%) | 0 (0.0%) |
Time of Departure to Work by Sex in Ellisville
The most frequent times of departure to work in Ellisville are 6:00 AM to 6:29 AM (3, 60.0%) for males and 5:30 AM to 5:59 AM (5, 35.7%) for females.
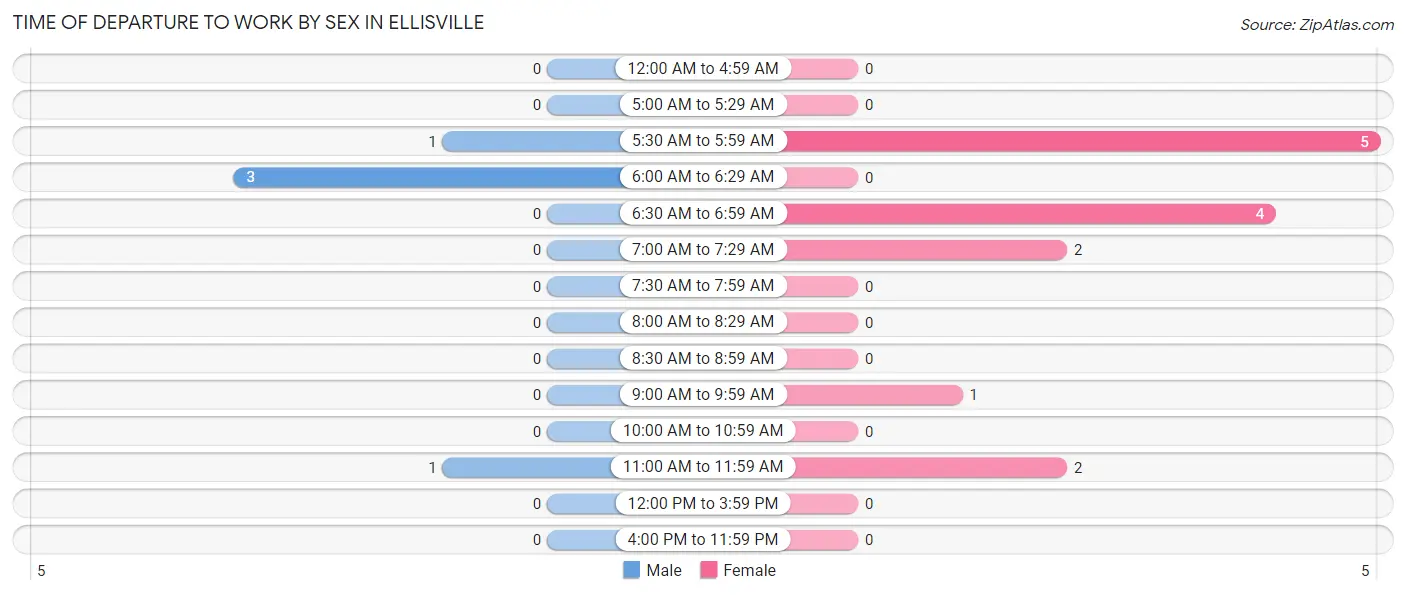
| Time of Departure | Male | Female |
| 12:00 AM to 4:59 AM | 0 (0.0%) | 0 (0.0%) |
| 5:00 AM to 5:29 AM | 0 (0.0%) | 0 (0.0%) |
| 5:30 AM to 5:59 AM | 1 (20.0%) | 5 (35.7%) |
| 6:00 AM to 6:29 AM | 3 (60.0%) | 0 (0.0%) |
| 6:30 AM to 6:59 AM | 0 (0.0%) | 4 (28.6%) |
| 7:00 AM to 7:29 AM | 0 (0.0%) | 2 (14.3%) |
| 7:30 AM to 7:59 AM | 0 (0.0%) | 0 (0.0%) |
| 8:00 AM to 8:29 AM | 0 (0.0%) | 0 (0.0%) |
| 8:30 AM to 8:59 AM | 0 (0.0%) | 0 (0.0%) |
| 9:00 AM to 9:59 AM | 0 (0.0%) | 1 (7.1%) |
| 10:00 AM to 10:59 AM | 0 (0.0%) | 0 (0.0%) |
| 11:00 AM to 11:59 AM | 1 (20.0%) | 2 (14.3%) |
| 12:00 PM to 3:59 PM | 0 (0.0%) | 0 (0.0%) |
| 4:00 PM to 11:59 PM | 0 (0.0%) | 0 (0.0%) |
| Total | 5 (100.0%) | 14 (100.0%) |
Housing Occupancy in Ellisville
Occupancy by Ownership in Ellisville
Of the total 37 dwellings in Ellisville, owner-occupied units account for 35 (94.6%), while renter-occupied units make up 2 (5.4%).
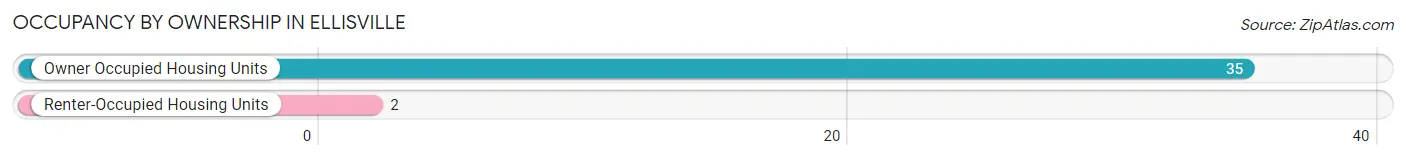
| Occupancy | # Housing Units | % Housing Units |
| Owner Occupied Housing Units | 35 | 94.6% |
| Renter-Occupied Housing Units | 2 | 5.4% |
| Total Occupied Housing Units | 37 | 100.0% |
Occupancy by Household Size in Ellisville
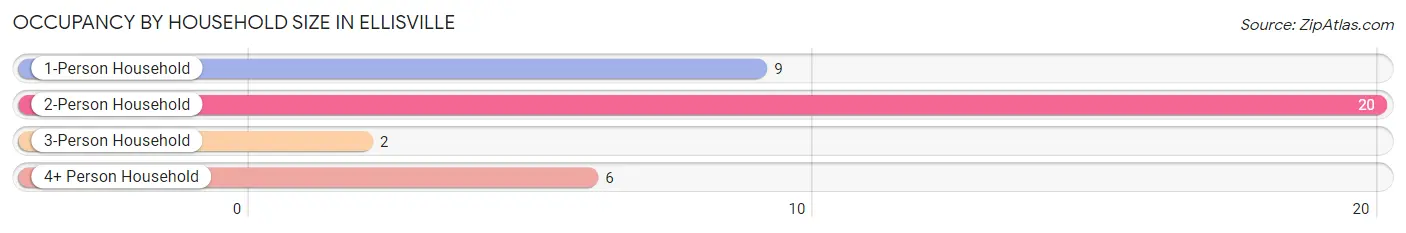
| Household Size | # Housing Units | % Housing Units |
| 1-Person Household | 9 | 24.3% |
| 2-Person Household | 20 | 54.0% |
| 3-Person Household | 2 | 5.4% |
| 4+ Person Household | 6 | 16.2% |
| Total Housing Units | 37 | 100.0% |
Occupancy by Ownership by Household Size in Ellisville
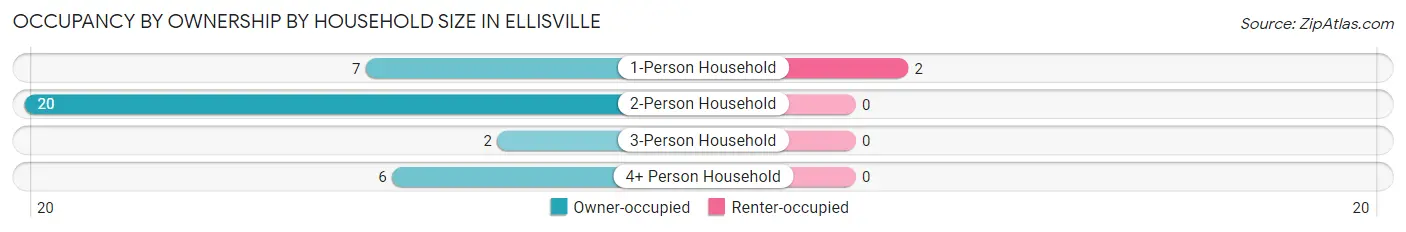
| Household Size | Owner-occupied | Renter-occupied |
| 1-Person Household | 7 (77.8%) | 2 (22.2%) |
| 2-Person Household | 20 (100.0%) | 0 (0.0%) |
| 3-Person Household | 2 (100.0%) | 0 (0.0%) |
| 4+ Person Household | 6 (100.0%) | 0 (0.0%) |
| Total Housing Units | 35 (94.6%) | 2 (5.4%) |
Occupancy by Educational Attainment in Ellisville
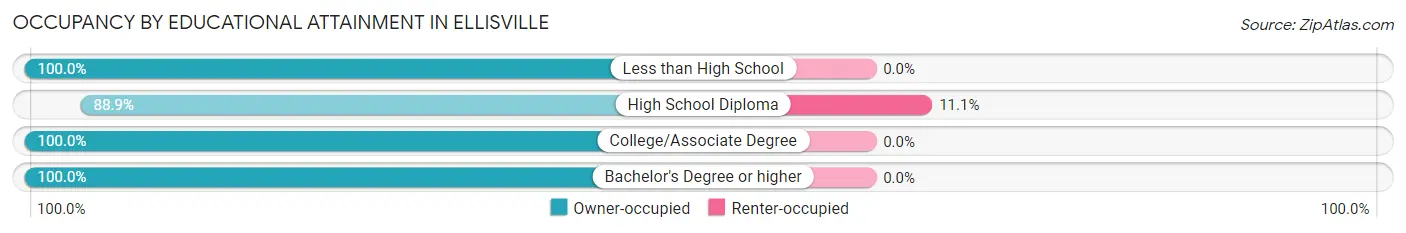
| Household Size | Owner-occupied | Renter-occupied |
| Less than High School | 3 (100.0%) | 0 (0.0%) |
| High School Diploma | 16 (88.9%) | 2 (11.1%) |
| College/Associate Degree | 14 (100.0%) | 0 (0.0%) |
| Bachelor's Degree or higher | 2 (100.0%) | 0 (0.0%) |
Occupancy by Age of Householder in Ellisville
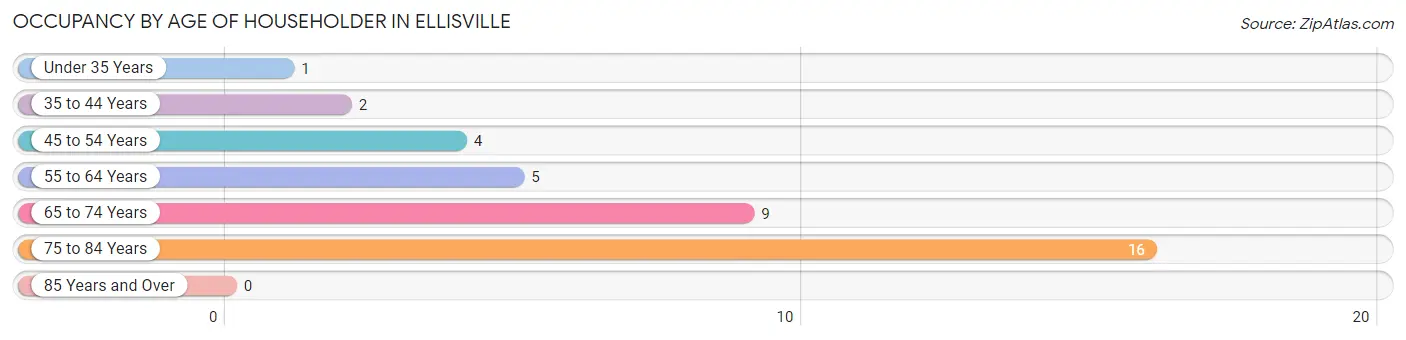
| Age Bracket | # Households | % Households |
| Under 35 Years | 1 | 2.7% |
| 35 to 44 Years | 2 | 5.4% |
| 45 to 54 Years | 4 | 10.8% |
| 55 to 64 Years | 5 | 13.5% |
| 65 to 74 Years | 9 | 24.3% |
| 75 to 84 Years | 16 | 43.2% |
| 85 Years and Over | 0 | 0.0% |
| Total | 37 | 100.0% |
Housing Finances in Ellisville
Median Income by Occupancy in Ellisville
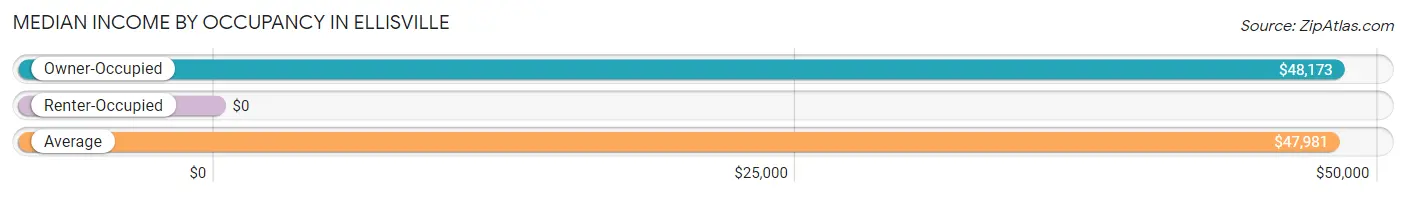
| Occupancy Type | # Households | Median Income |
| Owner-Occupied | 35 (94.6%) | $48,173 |
| Renter-Occupied | 2 (5.4%) | $0 |
| Average | 37 (100.0%) | $47,981 |
Occupancy by Householder Income Bracket in Ellisville
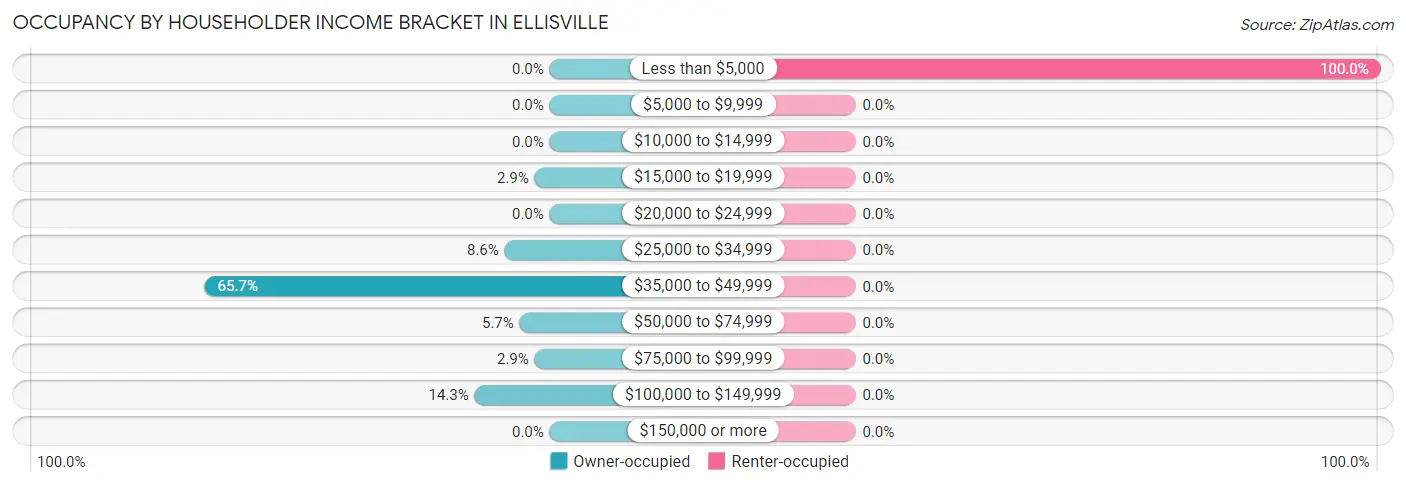
| Income Bracket | Owner-occupied | Renter-occupied |
| Less than $5,000 | 0 (0.0%) | 2 (100.0%) |
| $5,000 to $9,999 | 0 (0.0%) | 0 (0.0%) |
| $10,000 to $14,999 | 0 (0.0%) | 0 (0.0%) |
| $15,000 to $19,999 | 1 (2.9%) | 0 (0.0%) |
| $20,000 to $24,999 | 0 (0.0%) | 0 (0.0%) |
| $25,000 to $34,999 | 3 (8.6%) | 0 (0.0%) |
| $35,000 to $49,999 | 23 (65.7%) | 0 (0.0%) |
| $50,000 to $74,999 | 2 (5.7%) | 0 (0.0%) |
| $75,000 to $99,999 | 1 (2.9%) | 0 (0.0%) |
| $100,000 to $149,999 | 5 (14.3%) | 0 (0.0%) |
| $150,000 or more | 0 (0.0%) | 0 (0.0%) |
| Total | 35 (100.0%) | 2 (100.0%) |
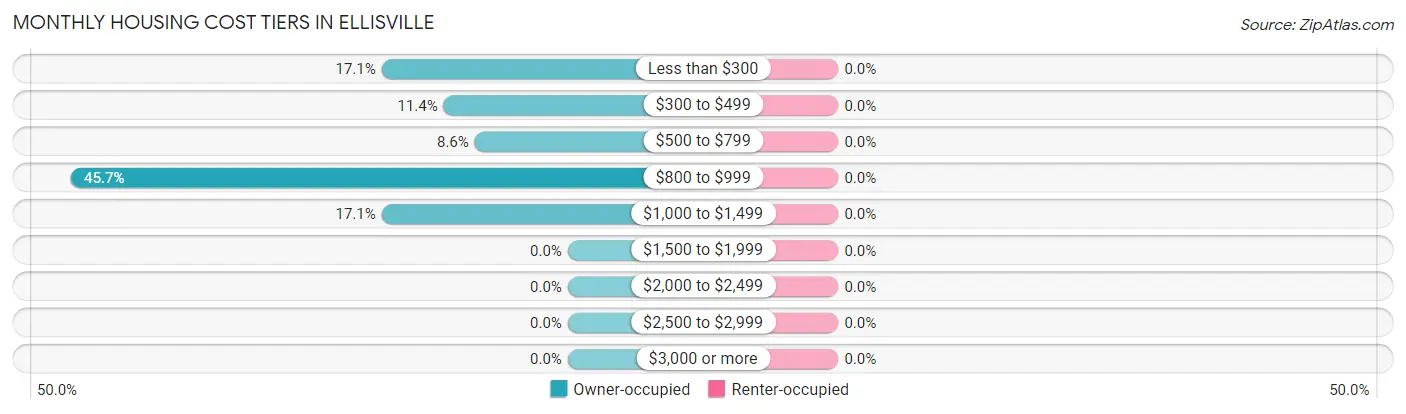
Monthly Housing Cost Tiers in Ellisville
| Monthly Cost | Owner-occupied | Renter-occupied |
| Less than $300 | 6 (17.1%) | 0 (0.0%) |
| $300 to $499 | 4 (11.4%) | 0 (0.0%) |
| $500 to $799 | 3 (8.6%) | 0 (0.0%) |
| $800 to $999 | 16 (45.7%) | 0 (0.0%) |
| $1,000 to $1,499 | 6 (17.1%) | 0 (0.0%) |
| $1,500 to $1,999 | 0 (0.0%) | 0 (0.0%) |
| $2,000 to $2,499 | 0 (0.0%) | 0 (0.0%) |
| $2,500 to $2,999 | 0 (0.0%) | 0 (0.0%) |
| $3,000 or more | 0 (0.0%) | 0 (0.0%) |
| Total | 35 (100.0%) | 2 (100.0%) |
Physical Housing Characteristics in Ellisville
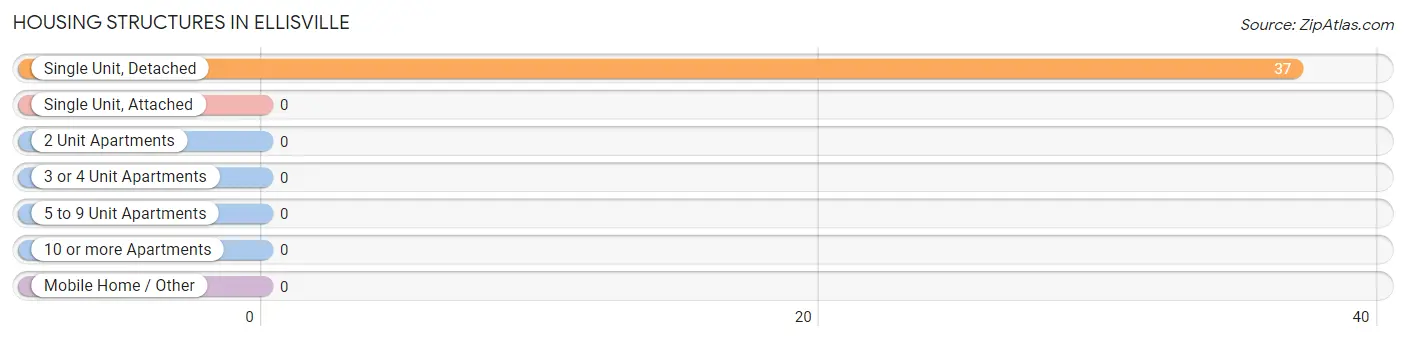
Housing Structures in Ellisville
| Structure Type | # Housing Units | % Housing Units |
| Single Unit, Detached | 37 | 100.0% |
| Single Unit, Attached | 0 | 0.0% |
| 2 Unit Apartments | 0 | 0.0% |
| 3 or 4 Unit Apartments | 0 | 0.0% |
| 5 to 9 Unit Apartments | 0 | 0.0% |
| 10 or more Apartments | 0 | 0.0% |
| Mobile Home / Other | 0 | 0.0% |
| Total | 37 | 100.0% |
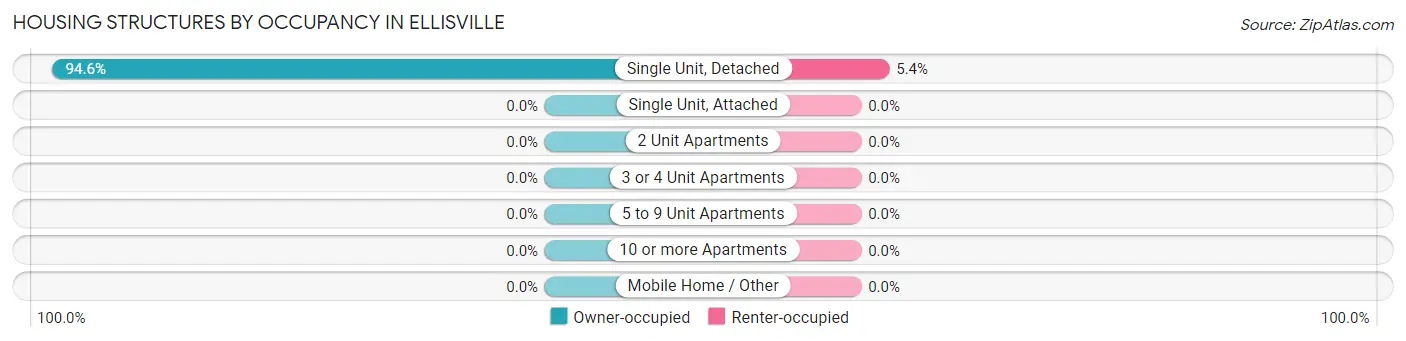
Housing Structures by Occupancy in Ellisville
| Structure Type | Owner-occupied | Renter-occupied |
| Single Unit, Detached | 35 (94.6%) | 2 (5.4%) |
| Single Unit, Attached | 0 (0.0%) | 0 (0.0%) |
| 2 Unit Apartments | 0 (0.0%) | 0 (0.0%) |
| 3 or 4 Unit Apartments | 0 (0.0%) | 0 (0.0%) |
| 5 to 9 Unit Apartments | 0 (0.0%) | 0 (0.0%) |
| 10 or more Apartments | 0 (0.0%) | 0 (0.0%) |
| Mobile Home / Other | 0 (0.0%) | 0 (0.0%) |
| Total | 35 (94.6%) | 2 (5.4%) |
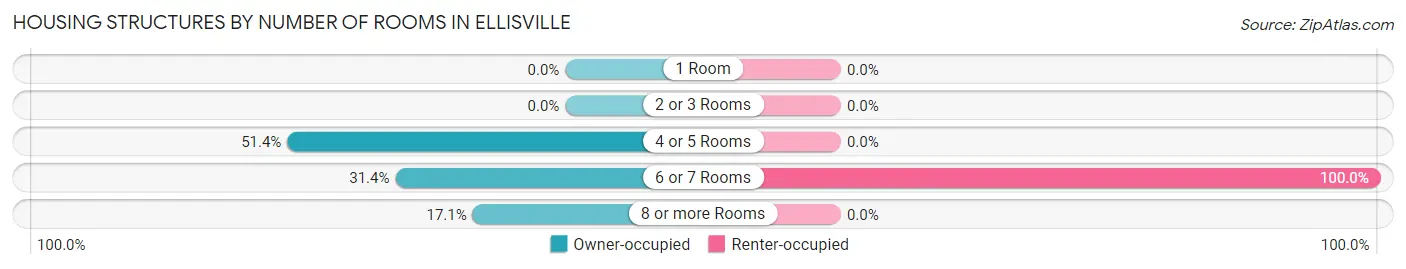
Housing Structures by Number of Rooms in Ellisville
| Number of Rooms | Owner-occupied | Renter-occupied |
| 1 Room | 0 (0.0%) | 0 (0.0%) |
| 2 or 3 Rooms | 0 (0.0%) | 0 (0.0%) |
| 4 or 5 Rooms | 18 (51.4%) | 0 (0.0%) |
| 6 or 7 Rooms | 11 (31.4%) | 2 (100.0%) |
| 8 or more Rooms | 6 (17.1%) | 0 (0.0%) |
| Total | 35 (100.0%) | 2 (100.0%) |
Housing Structure by Heating Type in Ellisville
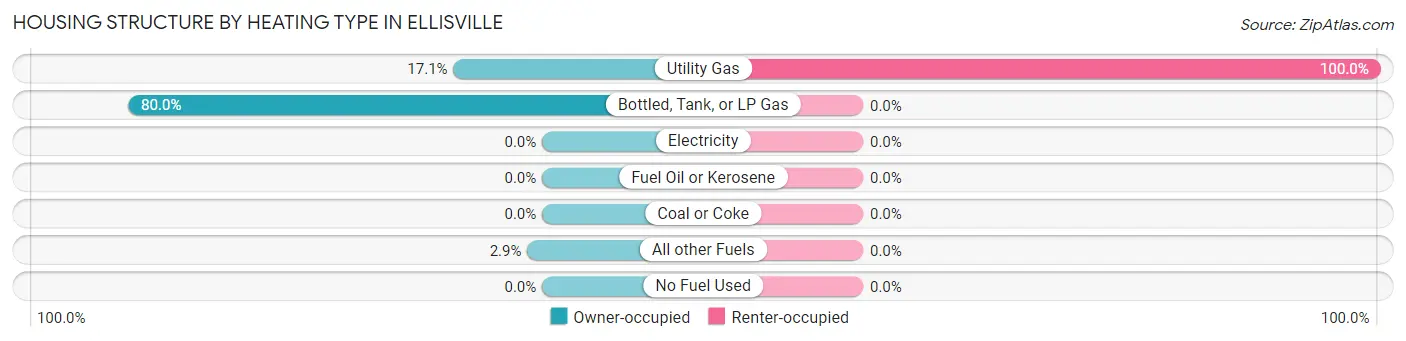
| Heating Type | Owner-occupied | Renter-occupied |
| Utility Gas | 6 (17.1%) | 2 (100.0%) |
| Bottled, Tank, or LP Gas | 28 (80.0%) | 0 (0.0%) |
| Electricity | 0 (0.0%) | 0 (0.0%) |
| Fuel Oil or Kerosene | 0 (0.0%) | 0 (0.0%) |
| Coal or Coke | 0 (0.0%) | 0 (0.0%) |
| All other Fuels | 1 (2.9%) | 0 (0.0%) |
| No Fuel Used | 0 (0.0%) | 0 (0.0%) |
| Total | 35 (100.0%) | 2 (100.0%) |
Household Vehicle Usage in Ellisville

| Vehicles per Household | Owner-occupied | Renter-occupied |
| No Vehicle | 0 (0.0%) | 2 (100.0%) |
| 1 Vehicle | 23 (65.7%) | 0 (0.0%) |
| 2 Vehicles | 5 (14.3%) | 0 (0.0%) |
| 3 or more Vehicles | 7 (20.0%) | 0 (0.0%) |
| Total | 35 (100.0%) | 2 (100.0%) |
Real Estate & Mortgages in Ellisville
Real Estate and Mortgage Overview in Ellisville
| Characteristic | Without Mortgage | With Mortgage |
| Housing Units | 29 | 6 |
| Median Property Value | $31,300 | $60,000 |
| Median Household Income | $48,558 | $0 |
| Monthly Housing Costs | $811 | $0 |
| Real Estate Taxes | $511 | $0 |
Property Value by Mortgage Status in Ellisville
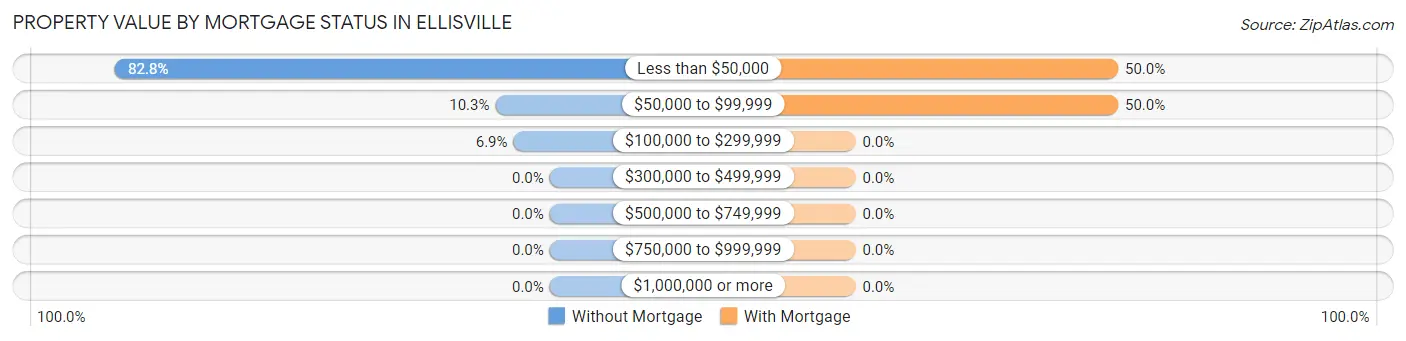
| Property Value | Without Mortgage | With Mortgage |
| Less than $50,000 | 24 (82.8%) | 3 (50.0%) |
| $50,000 to $99,999 | 3 (10.3%) | 3 (50.0%) |
| $100,000 to $299,999 | 2 (6.9%) | 0 (0.0%) |
| $300,000 to $499,999 | 0 (0.0%) | 0 (0.0%) |
| $500,000 to $749,999 | 0 (0.0%) | 0 (0.0%) |
| $750,000 to $999,999 | 0 (0.0%) | 0 (0.0%) |
| $1,000,000 or more | 0 (0.0%) | 0 (0.0%) |
| Total | 29 (100.0%) | 6 (100.0%) |
Household Income by Mortgage Status in Ellisville
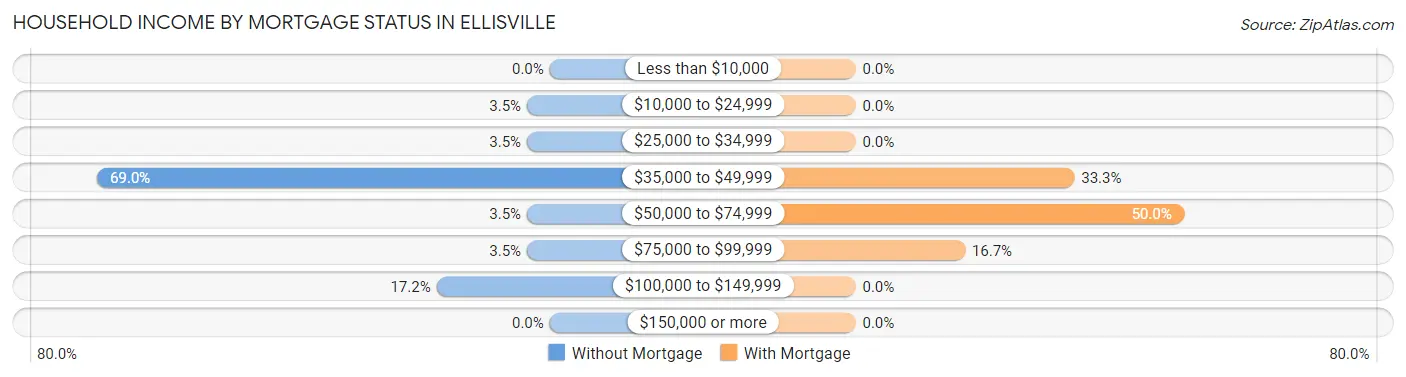
| Household Income | Without Mortgage | With Mortgage |
| Less than $10,000 | 0 (0.0%) | 0 (0.0%) |
| $10,000 to $24,999 | 1 (3.5%) | 0 (0.0%) |
| $25,000 to $34,999 | 1 (3.5%) | 0 (0.0%) |
| $35,000 to $49,999 | 20 (69.0%) | 2 (33.3%) |
| $50,000 to $74,999 | 1 (3.5%) | 3 (50.0%) |
| $75,000 to $99,999 | 1 (3.5%) | 1 (16.7%) |
| $100,000 to $149,999 | 5 (17.2%) | 0 (0.0%) |
| $150,000 or more | 0 (0.0%) | 0 (0.0%) |
| Total | 29 (100.0%) | 6 (100.0%) |
Property Value to Household Income Ratio in Ellisville
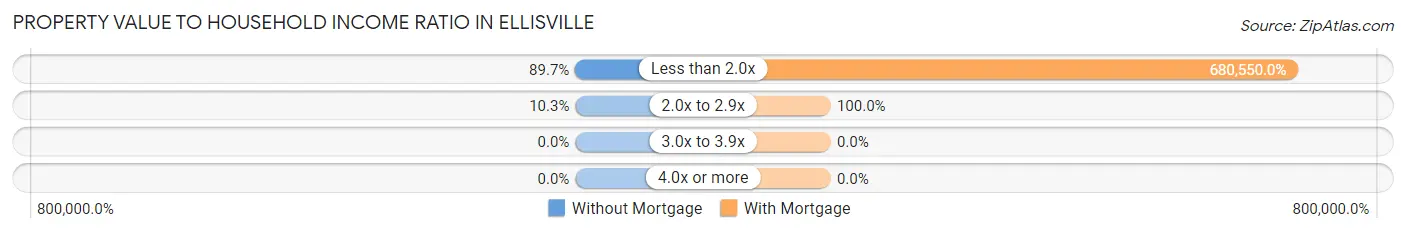
| Value-to-Income Ratio | Without Mortgage | With Mortgage |
| Less than 2.0x | 26 (89.7%) | 40,833 (680,550.0%) |
| 2.0x to 2.9x | 3 (10.3%) | 6 (100.0%) |
| 3.0x to 3.9x | 0 (0.0%) | 0 (0.0%) |
| 4.0x or more | 0 (0.0%) | 0 (0.0%) |
| Total | 29 (100.0%) | 6 (100.0%) |
Real Estate Taxes by Mortgage Status in Ellisville
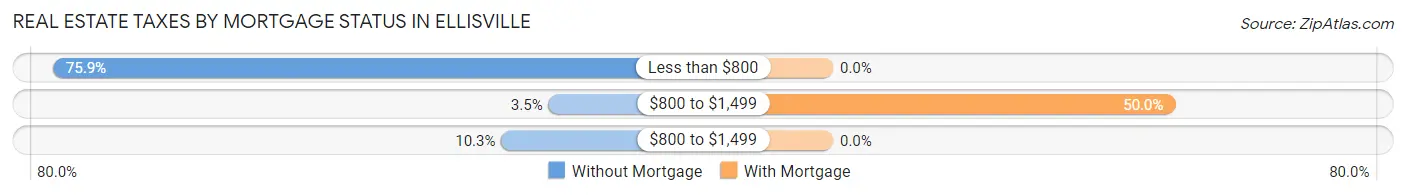
| Property Taxes | Without Mortgage | With Mortgage |
| Less than $800 | 22 (75.9%) | 0 (0.0%) |
| $800 to $1,499 | 1 (3.5%) | 3 (50.0%) |
| $800 to $1,499 | 3 (10.3%) | 0 (0.0%) |
| Total | 29 (100.0%) | 6 (100.0%) |
Health & Disability in Ellisville
Health Insurance Coverage by Age in Ellisville
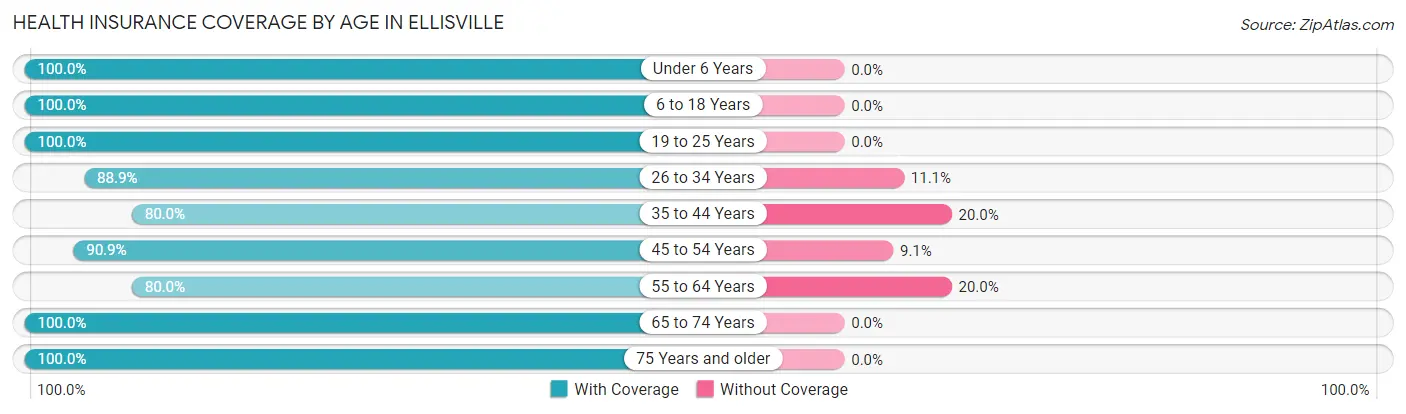
| Age Bracket | With Coverage | Without Coverage |
| Under 6 Years | 5 (100.0%) | 0 (0.0%) |
| 6 to 18 Years | 5 (100.0%) | 0 (0.0%) |
| 19 to 25 Years | 3 (100.0%) | 0 (0.0%) |
| 26 to 34 Years | 8 (88.9%) | 1 (11.1%) |
| 35 to 44 Years | 4 (80.0%) | 1 (20.0%) |
| 45 to 54 Years | 10 (90.9%) | 1 (9.1%) |
| 55 to 64 Years | 4 (80.0%) | 1 (20.0%) |
| 65 to 74 Years | 26 (100.0%) | 0 (0.0%) |
| 75 Years and older | 17 (100.0%) | 0 (0.0%) |
| Total | 82 (95.4%) | 4 (4.6%) |
Health Insurance Coverage by Citizenship Status in Ellisville

| Citizenship Status | With Coverage | Without Coverage |
| Native Born | 5 (100.0%) | 0 (0.0%) |
| Foreign Born, Citizen | 5 (100.0%) | 0 (0.0%) |
| Foreign Born, not a Citizen | 3 (100.0%) | 0 (0.0%) |
Health Insurance Coverage by Household Income in Ellisville
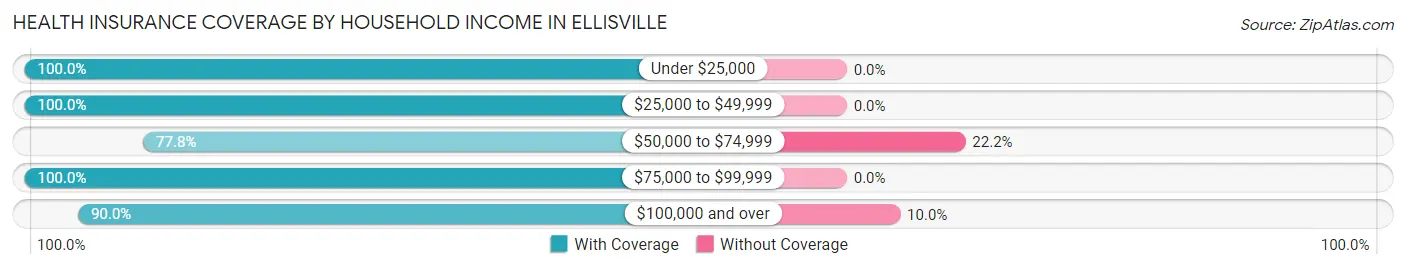
| Household Income | With Coverage | Without Coverage |
| Under $25,000 | 3 (100.0%) | 0 (0.0%) |
| $25,000 to $49,999 | 51 (100.0%) | 0 (0.0%) |
| $50,000 to $74,999 | 7 (77.8%) | 2 (22.2%) |
| $75,000 to $99,999 | 3 (100.0%) | 0 (0.0%) |
| $100,000 and over | 18 (90.0%) | 2 (10.0%) |
Public vs Private Health Insurance Coverage by Age in Ellisville
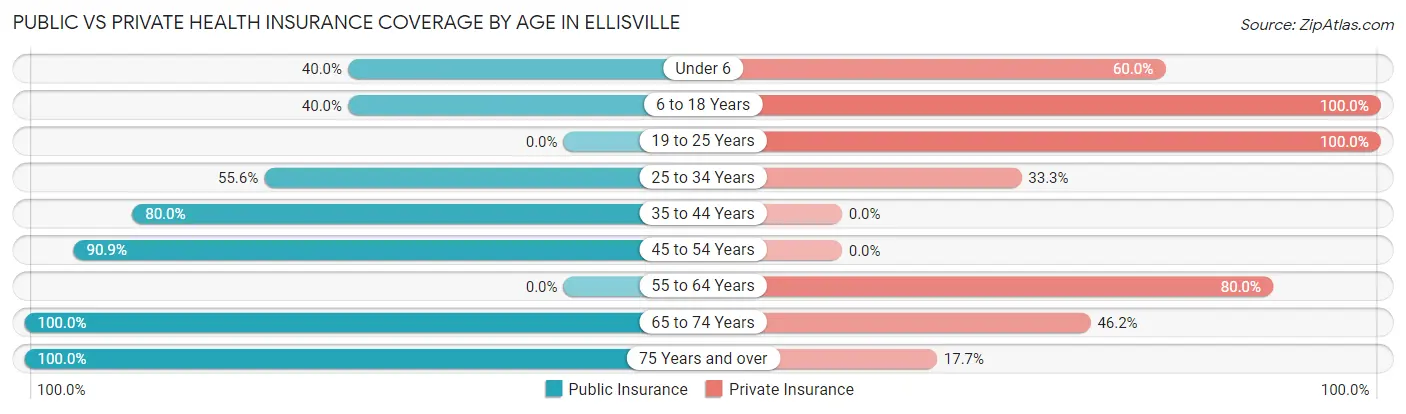
| Age Bracket | Public Insurance | Private Insurance |
| Under 6 | 2 (40.0%) | 3 (60.0%) |
| 6 to 18 Years | 2 (40.0%) | 5 (100.0%) |
| 19 to 25 Years | 0 (0.0%) | 3 (100.0%) |
| 25 to 34 Years | 5 (55.6%) | 3 (33.3%) |
| 35 to 44 Years | 4 (80.0%) | 0 (0.0%) |
| 45 to 54 Years | 10 (90.9%) | 0 (0.0%) |
| 55 to 64 Years | 0 (0.0%) | 4 (80.0%) |
| 65 to 74 Years | 26 (100.0%) | 12 (46.2%) |
| 75 Years and over | 17 (100.0%) | 3 (17.6%) |
| Total | 66 (76.7%) | 33 (38.4%) |
Disability Status by Sex by Age in Ellisville
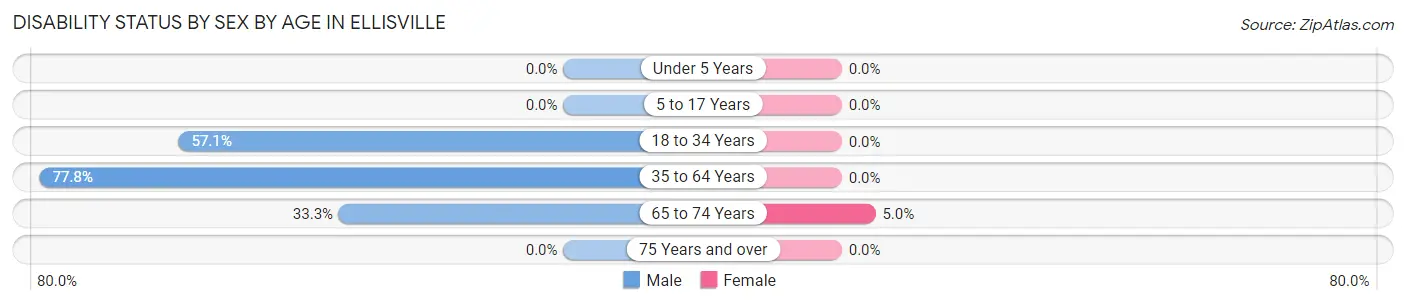
| Age Bracket | Male | Female |
| Under 5 Years | 0 (0.0%) | 0 (0.0%) |
| 5 to 17 Years | 0 (0.0%) | 0 (0.0%) |
| 18 to 34 Years | 4 (57.1%) | 0 (0.0%) |
| 35 to 64 Years | 7 (77.8%) | 0 (0.0%) |
| 65 to 74 Years | 2 (33.3%) | 1 (5.0%) |
| 75 Years and over | 0 (0.0%) | 0 (0.0%) |
Disability Class by Sex by Age in Ellisville
Disability Class: Hearing Difficulty
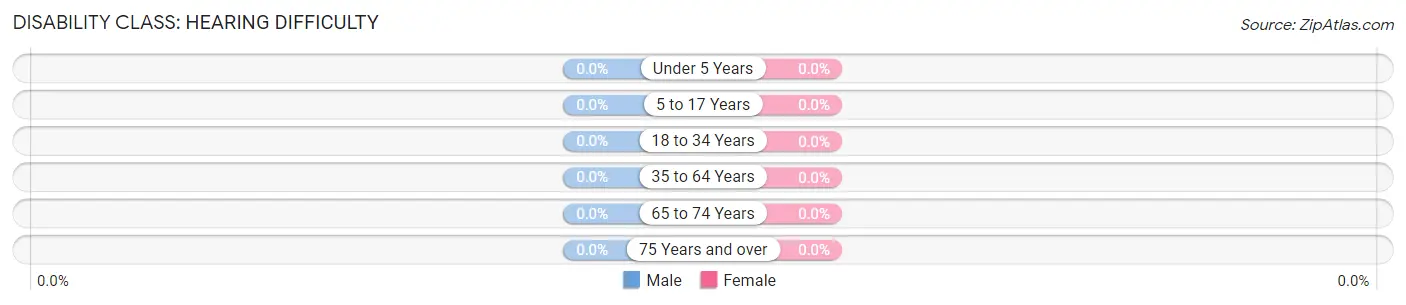
| Age Bracket | Male | Female |
| Under 5 Years | 0 (0.0%) | 0 (0.0%) |
| 5 to 17 Years | 0 (0.0%) | 0 (0.0%) |
| 18 to 34 Years | 0 (0.0%) | 0 (0.0%) |
| 35 to 64 Years | 0 (0.0%) | 0 (0.0%) |
| 65 to 74 Years | 0 (0.0%) | 0 (0.0%) |
| 75 Years and over | 0 (0.0%) | 0 (0.0%) |
Disability Class: Vision Difficulty
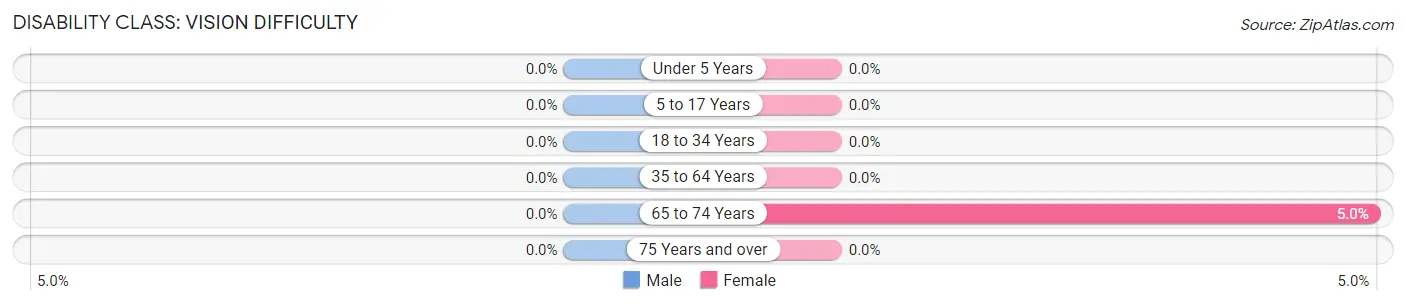
| Age Bracket | Male | Female |
| Under 5 Years | 0 (0.0%) | 0 (0.0%) |
| 5 to 17 Years | 0 (0.0%) | 0 (0.0%) |
| 18 to 34 Years | 0 (0.0%) | 0 (0.0%) |
| 35 to 64 Years | 0 (0.0%) | 0 (0.0%) |
| 65 to 74 Years | 0 (0.0%) | 1 (5.0%) |
| 75 Years and over | 0 (0.0%) | 0 (0.0%) |
Disability Class: Cognitive Difficulty
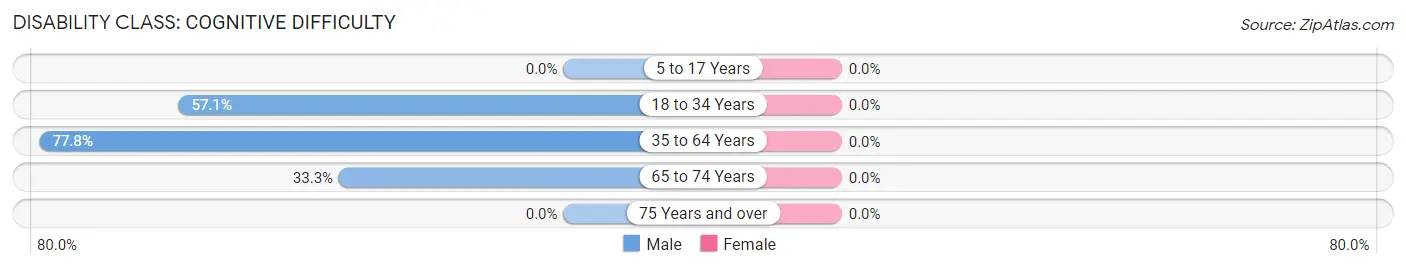
| Age Bracket | Male | Female |
| 5 to 17 Years | 0 (0.0%) | 0 (0.0%) |
| 18 to 34 Years | 4 (57.1%) | 0 (0.0%) |
| 35 to 64 Years | 7 (77.8%) | 0 (0.0%) |
| 65 to 74 Years | 2 (33.3%) | 0 (0.0%) |
| 75 Years and over | 0 (0.0%) | 0 (0.0%) |
Disability Class: Ambulatory Difficulty
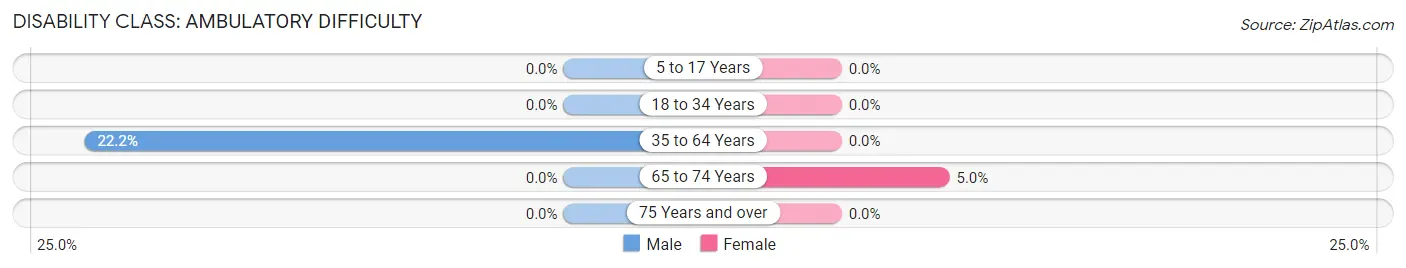
| Age Bracket | Male | Female |
| 5 to 17 Years | 0 (0.0%) | 0 (0.0%) |
| 18 to 34 Years | 0 (0.0%) | 0 (0.0%) |
| 35 to 64 Years | 2 (22.2%) | 0 (0.0%) |
| 65 to 74 Years | 0 (0.0%) | 1 (5.0%) |
| 75 Years and over | 0 (0.0%) | 0 (0.0%) |
Disability Class: Self-Care Difficulty
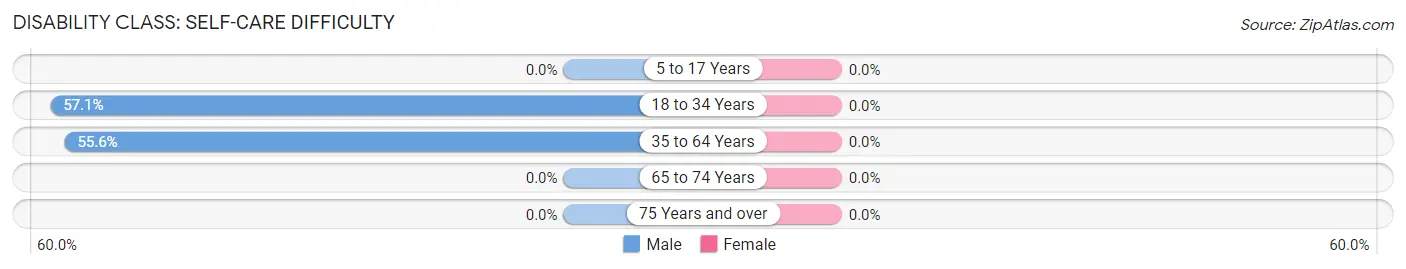
| Age Bracket | Male | Female |
| 5 to 17 Years | 0 (0.0%) | 0 (0.0%) |
| 18 to 34 Years | 4 (57.1%) | 0 (0.0%) |
| 35 to 64 Years | 5 (55.6%) | 0 (0.0%) |
| 65 to 74 Years | 0 (0.0%) | 0 (0.0%) |
| 75 Years and over | 0 (0.0%) | 0 (0.0%) |
Technology Access in Ellisville
Computing Device Access in Ellisville
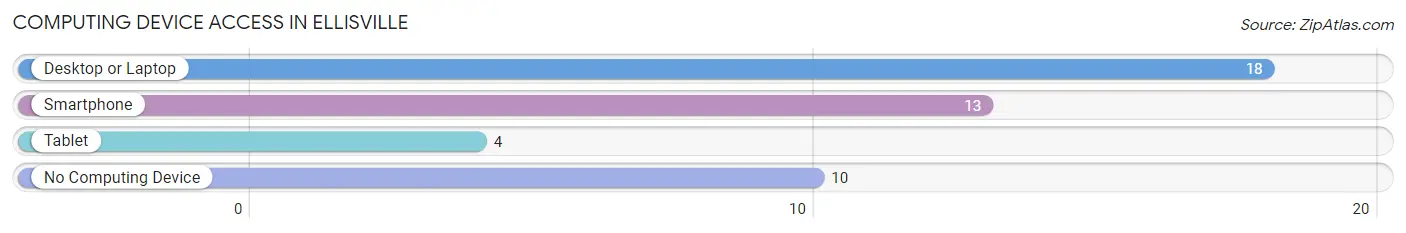
| Device Type | # Households | % Households |
| Desktop or Laptop | 18 | 48.6% |
| Smartphone | 13 | 35.1% |
| Tablet | 4 | 10.8% |
| No Computing Device | 10 | 27.0% |
| Total | 37 | 100.0% |
Internet Access in Ellisville
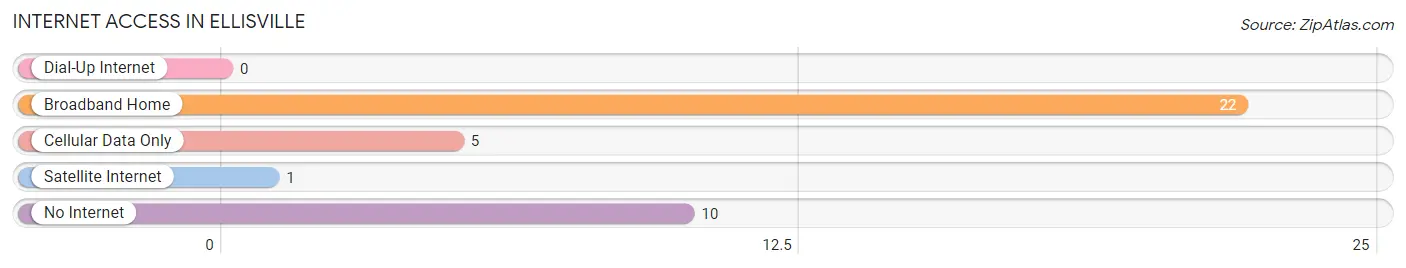
| Internet Type | # Households | % Households |
| Dial-Up Internet | 0 | 0.0% |
| Broadband Home | 22 | 59.5% |
| Cellular Data Only | 5 | 13.5% |
| Satellite Internet | 1 | 2.7% |
| No Internet | 10 | 27.0% |
| Total | 37 | 100.0% |
Ellisville Summary
Ellisville is a small village located in the state of Illinois, in the United States. It is situated in the northern part of the state, in Jo Daviess County, and is part of the Galena Micropolitan Statistical Area. The village has a population of around 500 people, and is located on the banks of the Galena River.
History
The area that is now Ellisville was first settled in the early 1800s by a group of settlers from New York. The village was originally known as “New York Settlement”, and was later renamed to Ellisville in 1837, after the first settler, William Ellis. The village was officially incorporated in 1845.
In the late 1800s, Ellisville was a thriving community, with a population of over 1,000 people. The village was home to a variety of businesses, including a sawmill, a grist mill, a blacksmith shop, a general store, and a hotel. The village also had a post office, a school, and a church.
In the early 1900s, the population of Ellisville began to decline, as many of the businesses closed and people moved away. By the 1950s, the population had dropped to just over 500 people.
Geography
Ellisville is located in the northern part of Illinois, in Jo Daviess County. The village is situated on the banks of the Galena River, and is surrounded by rolling hills and wooded areas. The village is located about 25 miles east of Dubuque, Iowa, and about 50 miles west of Madison, Wisconsin.
The climate in Ellisville is typical of the Midwest, with cold winters and hot, humid summers. The average annual temperature is around 50 degrees Fahrenheit, and the average annual precipitation is around 40 inches.
Economy
The economy of Ellisville is largely based on agriculture and tourism. The village is home to several farms, which produce a variety of crops, including corn, soybeans, and hay. The village also has several wineries, which attract tourists from all over the region.
In addition to agriculture and tourism, Ellisville is home to several small businesses, including a hardware store, a grocery store, and a restaurant. The village also has a post office, a bank, and a library.
Demographics
As of the 2010 census, the population of Ellisville was 498 people. The racial makeup of the village was 97.2% White, 0.6% African American, 0.2% Native American, 0.4% Asian, and 1.6% from other races. The median household income was $45,000, and the median age was 44.
Ellisville is a small, rural village with a close-knit community. The village is home to several churches, and is known for its friendly atmosphere and welcoming attitude. The village is also home to a variety of recreational activities, including fishing, hunting, and camping.
Common Questions
What is Per Capita Income in Ellisville?
Per Capita income in Ellisville is $22,837.
What is the Median Family Income in Ellisville?
Median Family Income in Ellisville is $48,846.
What is the Median Household income in Ellisville?
Median Household Income in Ellisville is $47,981.
What is Inequality or Gini Index in Ellisville?
Inequality or Gini Index in Ellisville is 0.28.
What is the Total Population of Ellisville?
Total Population of Ellisville is 86.
What is the Total Male Population of Ellisville?
Total Male Population of Ellisville is 44.
What is the Total Female Population of Ellisville?
Total Female Population of Ellisville is 42.
What is the Ratio of Males per 100 Females in Ellisville?
There are 104.76 Males per 100 Females in Ellisville.
What is the Ratio of Females per 100 Males in Ellisville?
There are 95.45 Females per 100 Males in Ellisville.
What is the Median Population Age in Ellisville?
Median Population Age in Ellisville is 64.5 Years.
What is the Average Family Size in Ellisville
Average Family Size in Ellisville is 2.6 People.
What is the Average Household Size in Ellisville
Average Household Size in Ellisville is 2.3 People.
How Large is the Labor Force in Ellisville?
There are 20 People in the Labor Forcein in Ellisville.
What is the Percentage of People in the Labor Force in Ellisville?
26.0% of People are in the Labor Force in Ellisville.
What is the Unemployment Rate in Ellisville?
Unemployment Rate in Ellisville is 5.0%.