Zip Codes with the Highest Percentage of Households Heated by Bottled Gas / Liquid Propane in Peoria, IL
RELATED REPORTS & OPTIONS
Bottled Gas / LP Heating
Peoria
Compare Zip Codes
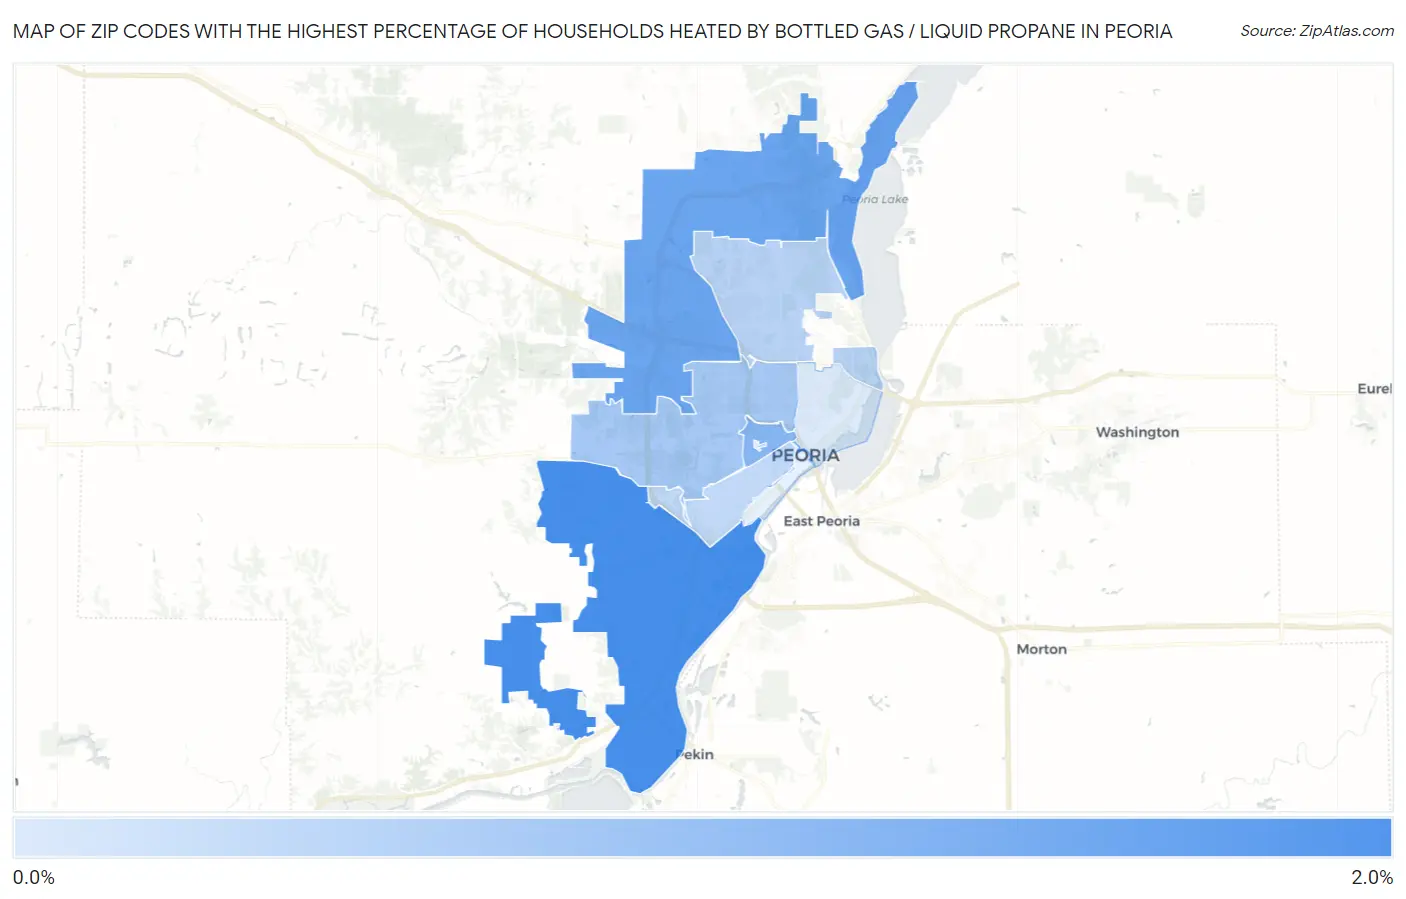
Map of Zip Codes with the Highest Percentage of Households Heated by Bottled Gas / Liquid Propane in Peoria
0.40%
2.0%
Zip Codes with the Highest Percentage of Households Heated by Bottled Gas / Liquid Propane in Peoria, IL
| Zip Code | Bottled Gas / LP Heating | vs State | vs National | |
| 1. | 61607 | 2.0% | 4.2%(-2.20)#982 | 4.9%(-2.90)#23,282 |
| 2. | 61615 | 1.6% | 4.2%(-2.60)#1,034 | 4.9%(-3.30)#24,426 |
| 3. | 61606 | 1.3% | 4.2%(-2.90)#1,076 | 4.9%(-3.60)#25,650 |
| 4. | 61604 | 1.0% | 4.2%(-3.20)#1,131 | 4.9%(-3.90)#26,673 |
| 5. | 61614 | 0.80% | 4.2%(-3.40)#1,170 | 4.9%(-4.10)#27,506 |
| 6. | 61605 | 0.70% | 4.2%(-3.50)#1,192 | 4.9%(-4.20)#28,001 |
| 7. | 61603 | 0.40% | 4.2%(-3.80)#1,239 | 4.9%(-4.50)#28,981 |
1
Common Questions
What are the Top 5 Zip Codes with the Highest Percentage of Households Heated by Bottled Gas / Liquid Propane in Peoria, IL?
Top 5 Zip Codes with the Highest Percentage of Households Heated by Bottled Gas / Liquid Propane in Peoria, IL are:
What zip code has the Highest Percentage of Households Heated by Bottled Gas / Liquid Propane in Peoria, IL?
61607 has the Highest Percentage of Households Heated by Bottled Gas / Liquid Propane in Peoria, IL with 2.0%.
What is the Percentage of Households Heated by Bottled Gas / Liquid Propane in Peoria, IL?
Percentage of Households Heated by Bottled Gas / Liquid Propane in Peoria is 0.70%.
What is the Percentage of Households Heated by Bottled Gas / Liquid Propane in Illinois?
Percentage of Households Heated by Bottled Gas / Liquid Propane in Illinois is 4.2%.
What is the Percentage of Households Heated by Bottled Gas / Liquid Propane in the United States?
Percentage of Households Heated by Bottled Gas / Liquid Propane in the United States is 4.9%.