Apple River, IL Map & Demographics
Apple River Map
Apple River Overview
$25,565
PER CAPITA INCOME
$51,667
AVG FAMILY INCOME
$50,208
AVG HOUSEHOLD INCOME
6.6%
WAGE / INCOME GAP [ % ]
93.4¢/ $1
WAGE / INCOME GAP [ $ ]
0.37
INEQUALITY / GINI INDEX
350
TOTAL POPULATION
172
MALE POPULATION
178
FEMALE POPULATION
96.63
MALES / 100 FEMALES
103.49
FEMALES / 100 MALES
33.6
MEDIAN AGE
2.6
AVG FAMILY SIZE
2.3
AVG HOUSEHOLD SIZE
170
LABOR FORCE [ PEOPLE ]
64.9%
PERCENT IN LABOR FORCE
1.8%
UNEMPLOYMENT RATE
Apple River Zip Codes
Apple River Area Codes
Income in Apple River
Income Overview in Apple River
Per Capita Income in Apple River is $25,565, while median incomes of families and households are $51,667 and $50,208 respectively.
| Characteristic | Number | Measure |
| Per Capita Income | 350 | $25,565 |
| Median Family Income | 106 | $51,667 |
| Mean Family Income | 106 | $67,316 |
| Median Household Income | 153 | $50,208 |
| Mean Household Income | 153 | $62,633 |
| Income Deficit | 106 | $0 |
| Wage / Income Gap (%) | 350 | 6.58% |
| Wage / Income Gap ($) | 350 | 93.42¢ per $1 |
| Gini / Inequality Index | 350 | 0.37 |
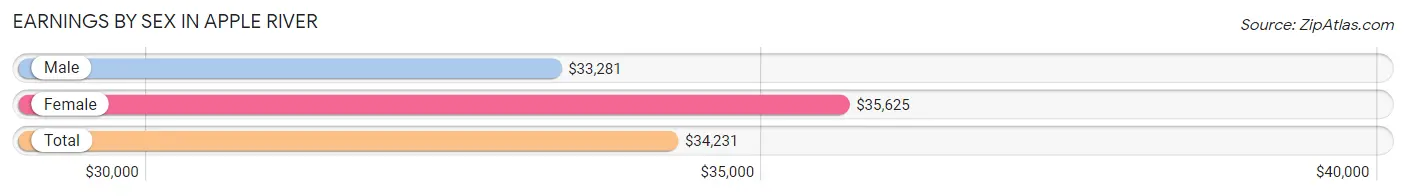
Earnings by Sex in Apple River
Average Earnings in Apple River are $34,231, $33,281 for men and $35,625 for women, a difference of 6.6%.
| Sex | Number | Average Earnings |
| Male | 101 (54.3%) | $33,281 |
| Female | 85 (45.7%) | $35,625 |
| Total | 186 (100.0%) | $34,231 |
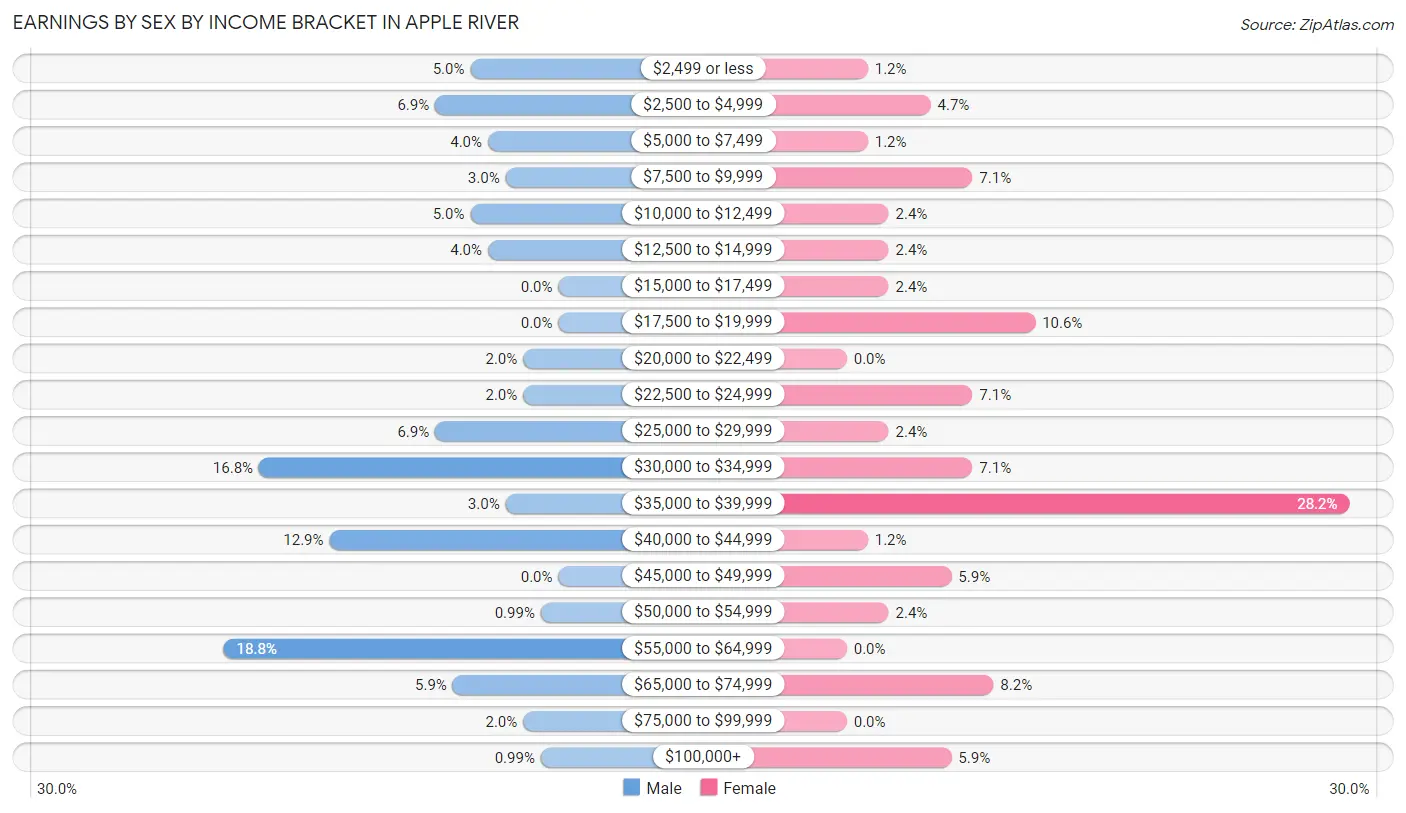
Earnings by Sex by Income Bracket in Apple River
The most common earnings brackets in Apple River are $55,000 to $64,999 for men (19 | 18.8%) and $35,000 to $39,999 for women (24 | 28.2%).
| Income | Male | Female |
| $2,499 or less | 5 (5.0%) | 1 (1.2%) |
| $2,500 to $4,999 | 7 (6.9%) | 4 (4.7%) |
| $5,000 to $7,499 | 4 (4.0%) | 1 (1.2%) |
| $7,500 to $9,999 | 3 (3.0%) | 6 (7.1%) |
| $10,000 to $12,499 | 5 (5.0%) | 2 (2.4%) |
| $12,500 to $14,999 | 4 (4.0%) | 2 (2.4%) |
| $15,000 to $17,499 | 0 (0.0%) | 2 (2.4%) |
| $17,500 to $19,999 | 0 (0.0%) | 9 (10.6%) |
| $20,000 to $22,499 | 2 (2.0%) | 0 (0.0%) |
| $22,500 to $24,999 | 2 (2.0%) | 6 (7.1%) |
| $25,000 to $29,999 | 7 (6.9%) | 2 (2.4%) |
| $30,000 to $34,999 | 17 (16.8%) | 6 (7.1%) |
| $35,000 to $39,999 | 3 (3.0%) | 24 (28.2%) |
| $40,000 to $44,999 | 13 (12.9%) | 1 (1.2%) |
| $45,000 to $49,999 | 0 (0.0%) | 5 (5.9%) |
| $50,000 to $54,999 | 1 (1.0%) | 2 (2.4%) |
| $55,000 to $64,999 | 19 (18.8%) | 0 (0.0%) |
| $65,000 to $74,999 | 6 (5.9%) | 7 (8.2%) |
| $75,000 to $99,999 | 2 (2.0%) | 0 (0.0%) |
| $100,000+ | 1 (1.0%) | 5 (5.9%) |
| Total | 101 (100.0%) | 85 (100.0%) |
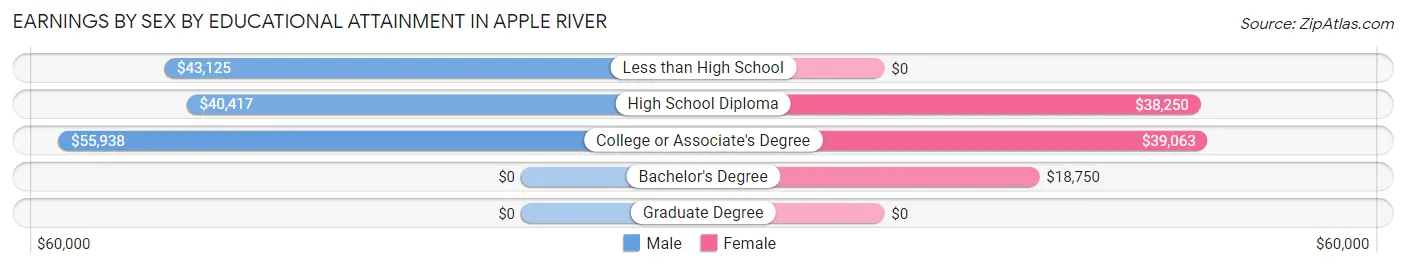
Earnings by Sex by Educational Attainment in Apple River
Average earnings in Apple River are $40,417 for men and $37,708 for women, a difference of 6.7%. Men with an educational attainment of college or associate's degree enjoy the highest average annual earnings of $55,938, while those with high school diploma education earn the least with $40,417. Women with an educational attainment of college or associate's degree earn the most with the average annual earnings of $39,063, while those with bachelor's degree education have the smallest earnings of $18,750.
| Educational Attainment | Male Income | Female Income |
| Less than High School | $43,125 | $0 |
| High School Diploma | $40,417 | $38,250 |
| College or Associate's Degree | $55,938 | $39,063 |
| Bachelor's Degree | - | - |
| Graduate Degree | - | - |
| Total | $40,417 | $37,708 |
Family Income in Apple River
Family Income Brackets in Apple River
According to the Apple River family income data, there are 29 families falling into the $25,000 to $34,999 income range, which is the most common income bracket and makes up 27.4% of all families.
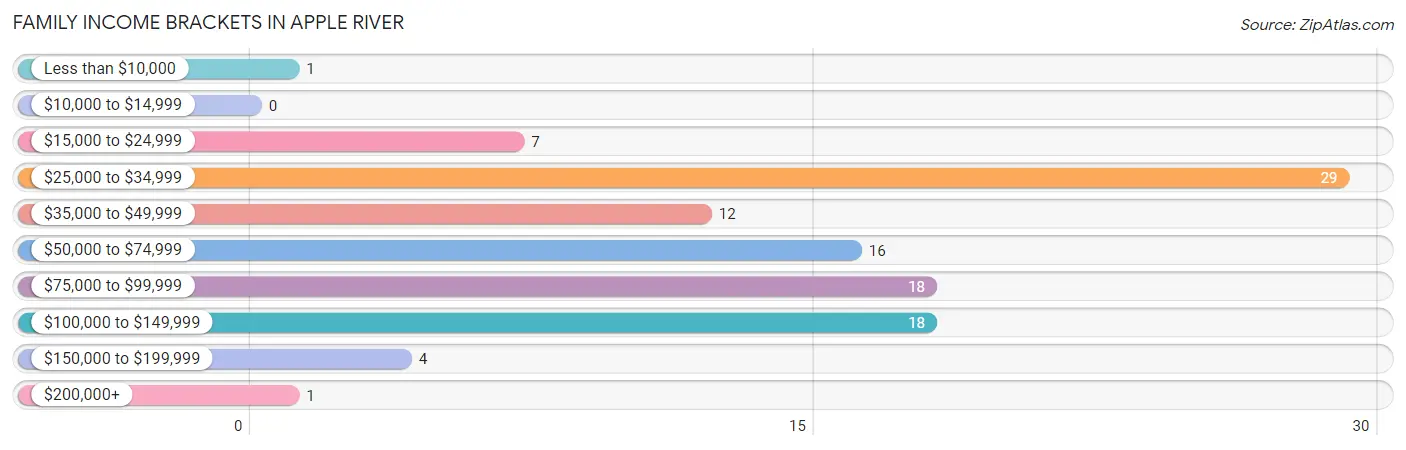
| Income Bracket | # Families | % Families |
| Less than $10,000 | 1 | 0.9% |
| $10,000 to $14,999 | 0 | 0.0% |
| $15,000 to $24,999 | 7 | 6.6% |
| $25,000 to $34,999 | 29 | 27.4% |
| $35,000 to $49,999 | 12 | 11.3% |
| $50,000 to $74,999 | 16 | 15.1% |
| $75,000 to $99,999 | 18 | 17.0% |
| $100,000 to $149,999 | 18 | 17.0% |
| $150,000 to $199,999 | 4 | 3.8% |
| $200,000+ | 1 | 0.9% |
Family Income by Famaliy Size in Apple River
4-person families (47 | 44.3%) account for the highest median family income in Apple River with $88,125 per family, while 4-person families (47 | 44.3%) have the highest median income of $22,031 per family member.
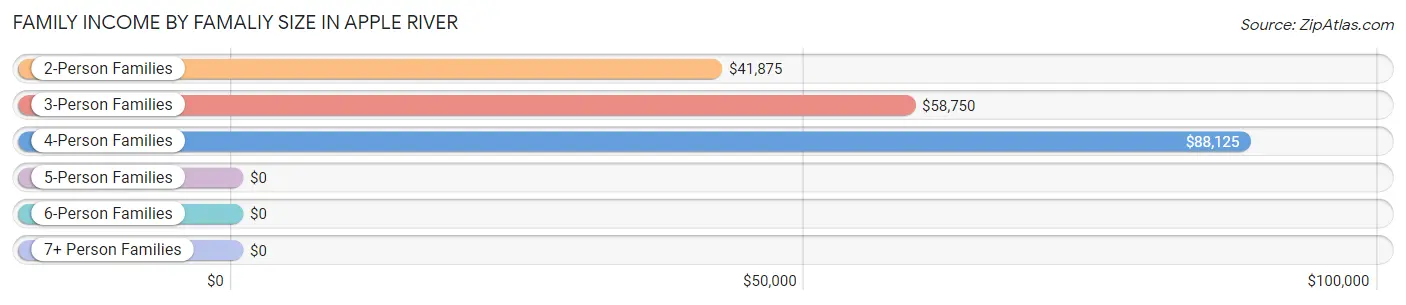
| Income Bracket | # Families | Median Income |
| 2-Person Families | 45 (42.4%) | $41,875 |
| 3-Person Families | 14 (13.2%) | $58,750 |
| 4-Person Families | 47 (44.3%) | $88,125 |
| 5-Person Families | 0 (0.0%) | $0 |
| 6-Person Families | 0 (0.0%) | $0 |
| 7+ Person Families | 0 (0.0%) | $0 |
| Total | 106 (100.0%) | $51,667 |
Family Income by Number of Earners in Apple River
The median family income in Apple River is $51,667, with families comprising 3+ earners (14) having the highest median family income of $107,500, while families with 1 earner (54) have the lowest median family income of $31,944, accounting for 13.2% and 50.9% of families, respectively.
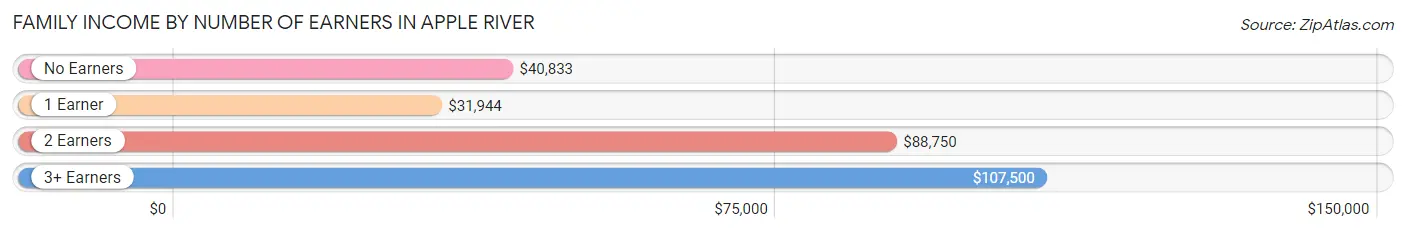
| Number of Earners | # Families | Median Income |
| No Earners | 8 (7.5%) | $40,833 |
| 1 Earner | 54 (50.9%) | $31,944 |
| 2 Earners | 30 (28.3%) | $88,750 |
| 3+ Earners | 14 (13.2%) | $107,500 |
| Total | 106 (100.0%) | $51,667 |
Household Income in Apple River
Household Income Brackets in Apple River
With 35 households falling in the category, the $25,000 to $34,999 income range is the most frequent in Apple River, accounting for 22.9% of all households. In contrast, only 1 households (0.6%) fall into the $200,000+ income bracket, making it the least populous group.
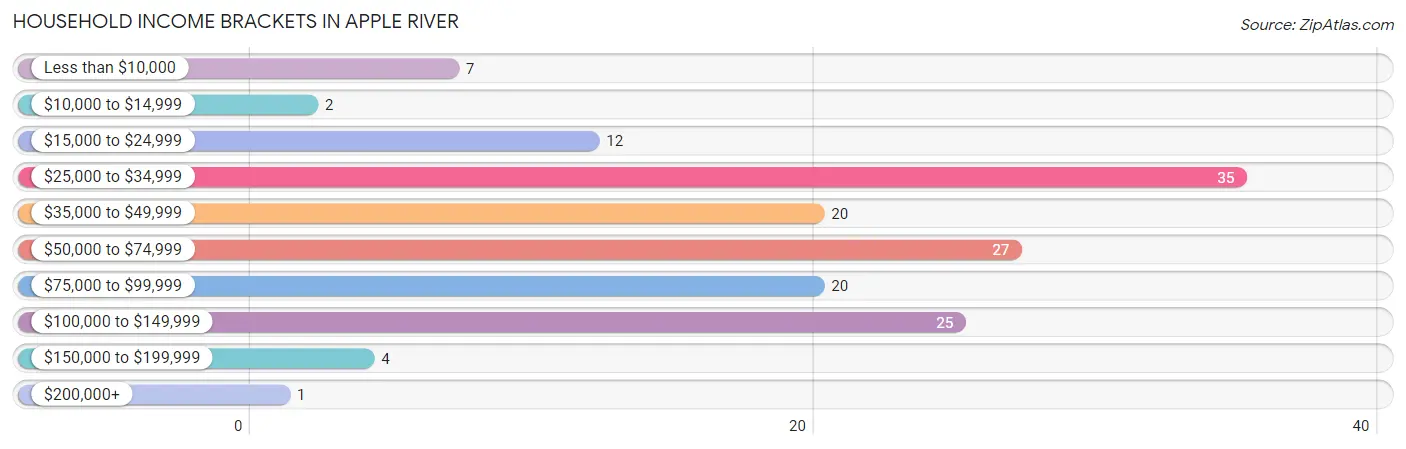
| Income Bracket | # Households | % Households |
| Less than $10,000 | 7 | 4.6% |
| $10,000 to $14,999 | 2 | 1.3% |
| $15,000 to $24,999 | 12 | 7.8% |
| $25,000 to $34,999 | 35 | 22.9% |
| $35,000 to $49,999 | 20 | 13.1% |
| $50,000 to $74,999 | 27 | 17.6% |
| $75,000 to $99,999 | 20 | 13.1% |
| $100,000 to $149,999 | 25 | 16.3% |
| $150,000 to $199,999 | 4 | 2.6% |
| $200,000+ | 1 | 0.7% |
Household Income by Householder Age in Apple River
The median household income in Apple River is $50,208, with the highest median household income of $75,625 found in the 25 to 44 years age bracket for the primary householder. A total of 25 households (16.3%) fall into this category. Meanwhile, the 15 to 24 years age bracket for the primary householder has the lowest median household income of $28,750, with 17 households (11.1%) in this group.
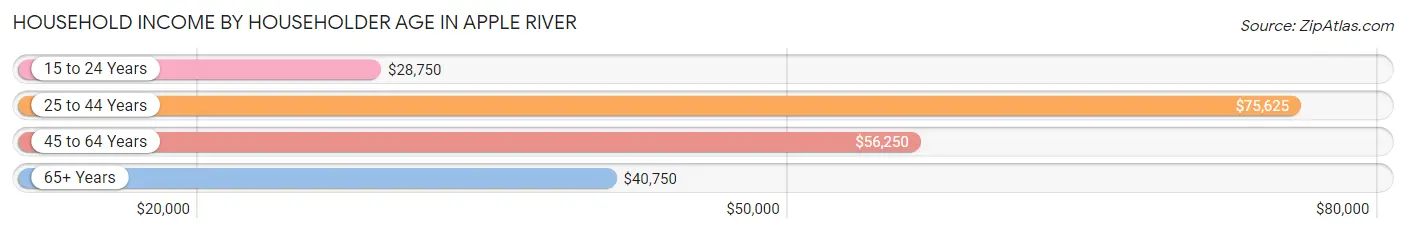
| Income Bracket | # Households | Median Income |
| 15 to 24 Years | 17 (11.1%) | $28,750 |
| 25 to 44 Years | 25 (16.3%) | $75,625 |
| 45 to 64 Years | 76 (49.7%) | $56,250 |
| 65+ Years | 35 (22.9%) | $40,750 |
| Total | 153 (100.0%) | $50,208 |
Poverty in Apple River
Income Below Poverty by Sex and Age in Apple River
With 11.1% poverty level for males and 14.0% for females among the residents of Apple River, 45 to 54 year old males and 25 to 34 year old females are the most vulnerable to poverty, with 6 males (25.0%) and 12 females (52.2%) in their respective age groups living below the poverty level.
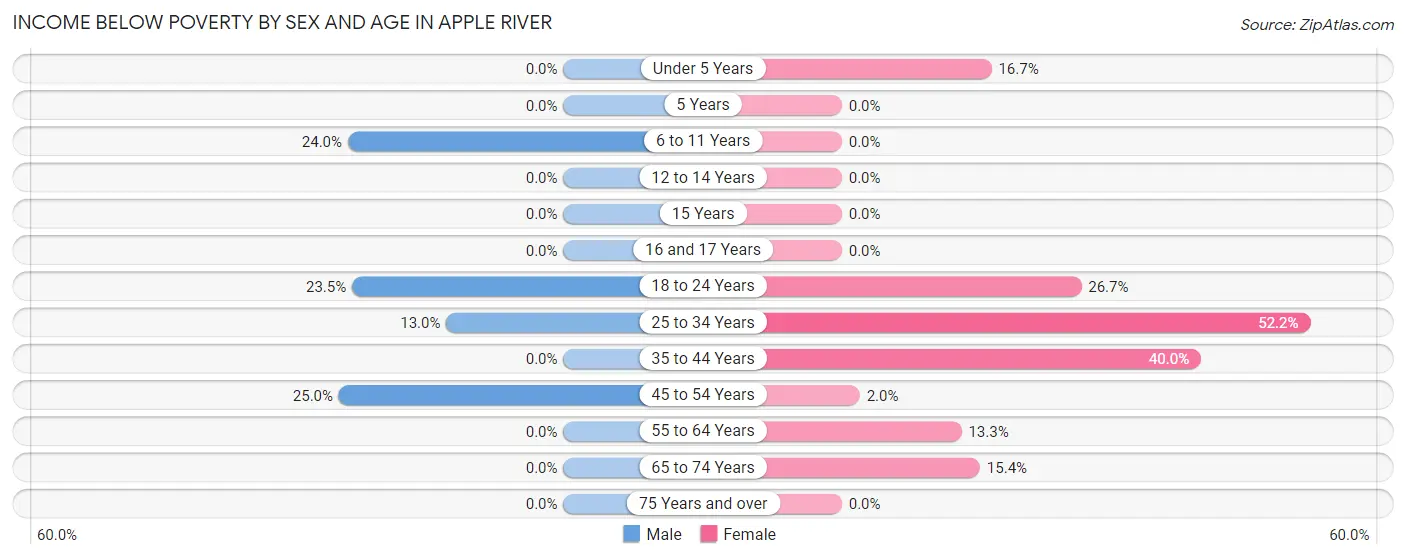
| Age Bracket | Male | Female |
| Under 5 Years | 0 (0.0%) | 2 (16.7%) |
| 5 Years | 0 (0.0%) | 0 (0.0%) |
| 6 to 11 Years | 6 (24.0%) | 0 (0.0%) |
| 12 to 14 Years | 0 (0.0%) | 0 (0.0%) |
| 15 Years | 0 (0.0%) | 0 (0.0%) |
| 16 and 17 Years | 0 (0.0%) | 0 (0.0%) |
| 18 to 24 Years | 4 (23.5%) | 4 (26.7%) |
| 25 to 34 Years | 3 (13.0%) | 12 (52.2%) |
| 35 to 44 Years | 0 (0.0%) | 2 (40.0%) |
| 45 to 54 Years | 6 (25.0%) | 1 (2.0%) |
| 55 to 64 Years | 0 (0.0%) | 2 (13.3%) |
| 65 to 74 Years | 0 (0.0%) | 2 (15.4%) |
| 75 Years and over | 0 (0.0%) | 0 (0.0%) |
| Total | 19 (11.1%) | 25 (14.0%) |
Income Above Poverty by Sex and Age in Apple River
According to the poverty statistics in Apple River, males aged under 5 years and females aged 6 to 11 years are the age groups that are most secure financially, with 100.0% of males and 100.0% of females in these age groups living above the poverty line.
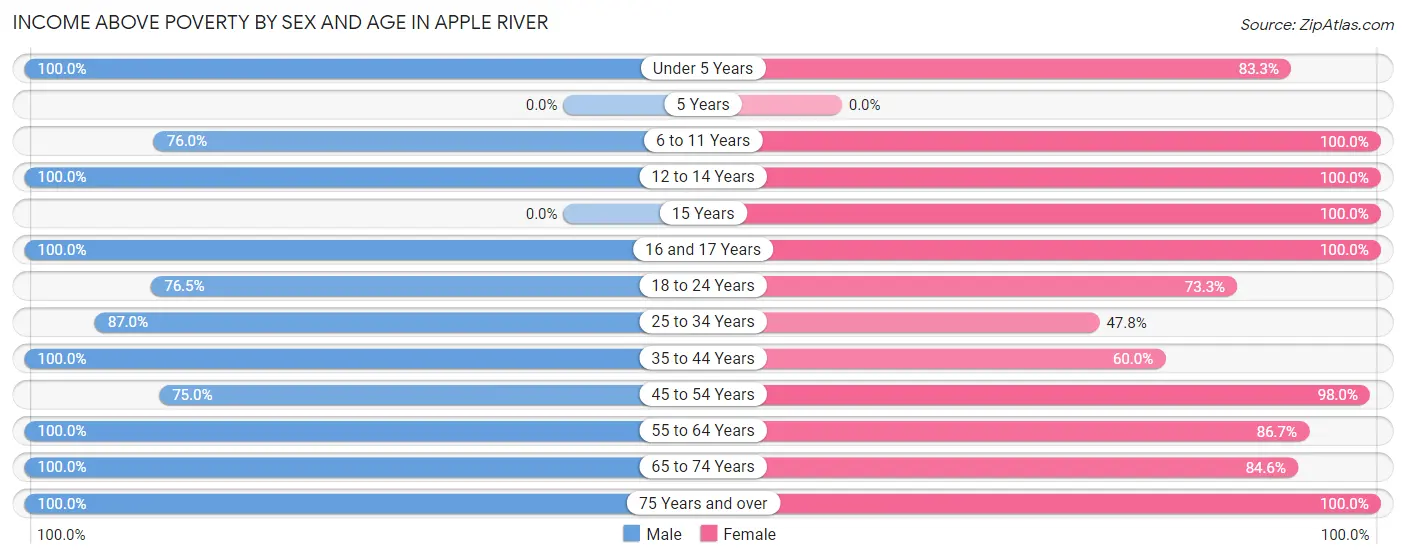
| Age Bracket | Male | Female |
| Under 5 Years | 11 (100.0%) | 10 (83.3%) |
| 5 Years | 0 (0.0%) | 0 (0.0%) |
| 6 to 11 Years | 19 (76.0%) | 12 (100.0%) |
| 12 to 14 Years | 12 (100.0%) | 14 (100.0%) |
| 15 Years | 0 (0.0%) | 2 (100.0%) |
| 16 and 17 Years | 7 (100.0%) | 5 (100.0%) |
| 18 to 24 Years | 13 (76.5%) | 11 (73.3%) |
| 25 to 34 Years | 20 (87.0%) | 11 (47.8%) |
| 35 to 44 Years | 14 (100.0%) | 3 (60.0%) |
| 45 to 54 Years | 18 (75.0%) | 49 (98.0%) |
| 55 to 64 Years | 16 (100.0%) | 13 (86.7%) |
| 65 to 74 Years | 13 (100.0%) | 11 (84.6%) |
| 75 Years and over | 10 (100.0%) | 12 (100.0%) |
| Total | 153 (88.9%) | 153 (86.0%) |
Income Below Poverty Among Married-Couple Families in Apple River
The poverty statistics for married-couple families in Apple River show that 5.3% or 4 of the total 75 families live below the poverty line. Families with 1 or 2 children have the highest poverty rate of 7.9%, comprising of 3 families. On the other hand, families with no children have the lowest poverty rate of 2.7%, which includes 1 families.
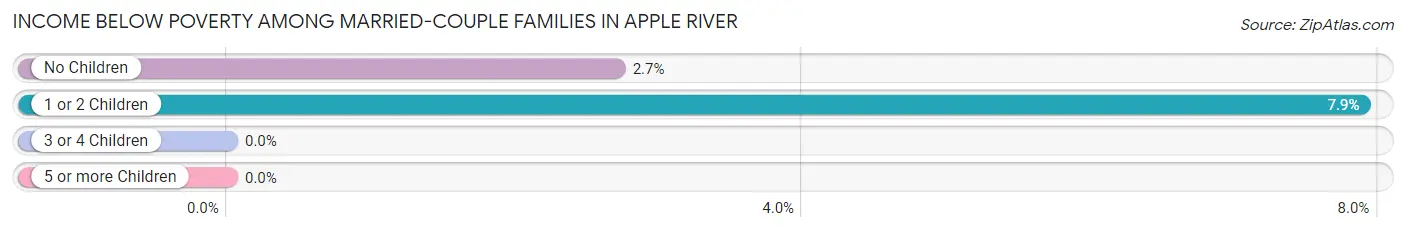
| Children | Above Poverty | Below Poverty |
| No Children | 36 (97.3%) | 1 (2.7%) |
| 1 or 2 Children | 35 (92.1%) | 3 (7.9%) |
| 3 or 4 Children | 0 (0.0%) | 0 (0.0%) |
| 5 or more Children | 0 (0.0%) | 0 (0.0%) |
| Total | 71 (94.7%) | 4 (5.3%) |
Income Below Poverty Among Single-Parent Households in Apple River
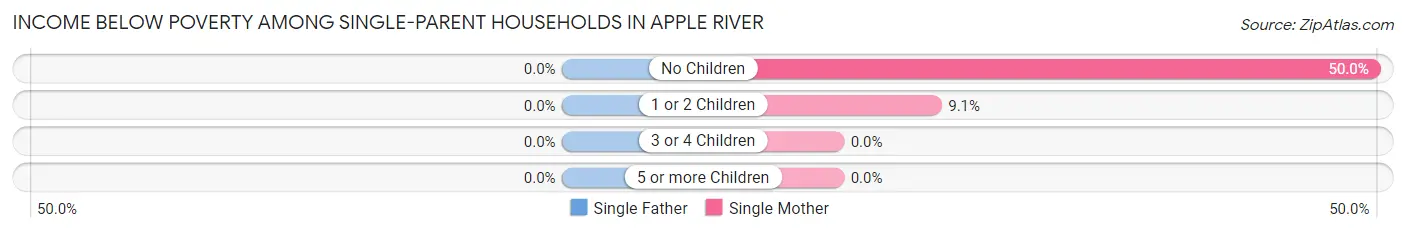
| Children | Single Father | Single Mother |
| No Children | 0 (0.0%) | 2 (50.0%) |
| 1 or 2 Children | 0 (0.0%) | 1 (9.1%) |
| 3 or 4 Children | 0 (0.0%) | 0 (0.0%) |
| 5 or more Children | 0 (0.0%) | 0 (0.0%) |
| Total | 0 (0.0%) | 3 (12.5%) |
Income Below Poverty Among Married-Couple vs Single-Parent Households in Apple River
The poverty data for Apple River shows that 4 of the married-couple family households (5.3%) and 3 of the single-parent households (9.7%) are living below the poverty level. Within the married-couple family households, those with 1 or 2 children have the highest poverty rate, with 3 households (7.9%) falling below the poverty line. Among the single-parent households, those with no children have the highest poverty rate, with 2 household (50.0%) living below poverty.
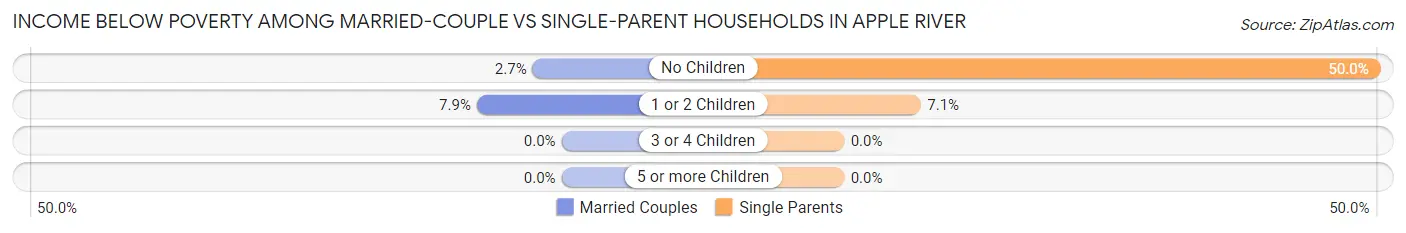
| Children | Married-Couple Families | Single-Parent Households |
| No Children | 1 (2.7%) | 2 (50.0%) |
| 1 or 2 Children | 3 (7.9%) | 1 (7.1%) |
| 3 or 4 Children | 0 (0.0%) | 0 (0.0%) |
| 5 or more Children | 0 (0.0%) | 0 (0.0%) |
| Total | 4 (5.3%) | 3 (9.7%) |
Race in Apple River
The most populous races in Apple River are White / Caucasian (342 | 97.7%), Hispanic or Latino (19 | 5.4%), and Black / African American (3 | 0.9%).
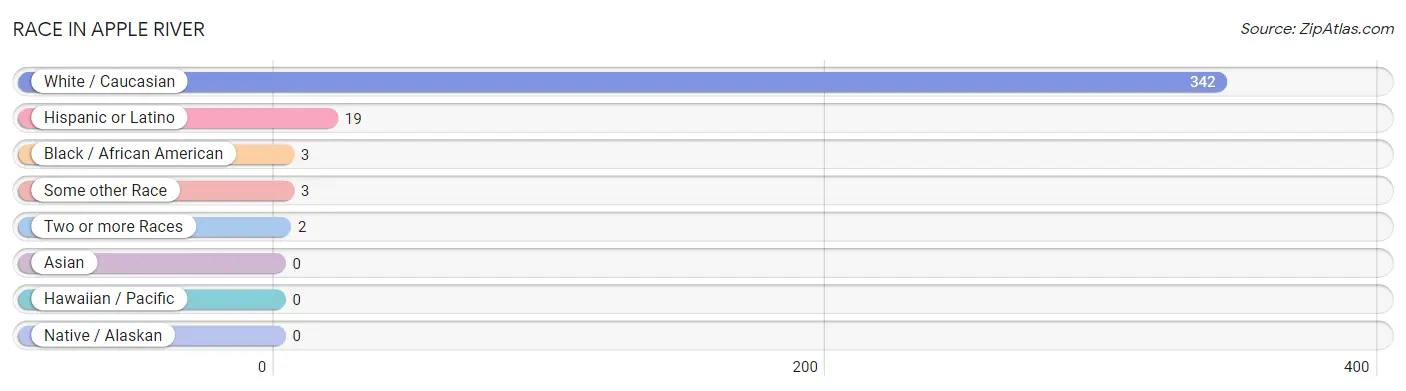
| Race | # Population | % Population |
| Asian | 0 | 0.0% |
| Black / African American | 3 | 0.9% |
| Hawaiian / Pacific | 0 | 0.0% |
| Hispanic or Latino | 19 | 5.4% |
| Native / Alaskan | 0 | 0.0% |
| White / Caucasian | 342 | 97.7% |
| Two or more Races | 2 | 0.6% |
| Some other Race | 3 | 0.9% |
| Total | 350 | 100.0% |
Ancestry in Apple River
The most populous ancestries reported in Apple River are German (104 | 29.7%), Irish (85 | 24.3%), American (82 | 23.4%), English (41 | 11.7%), and Polish (35 | 10.0%), together accounting for 99.1% of all Apple River residents.
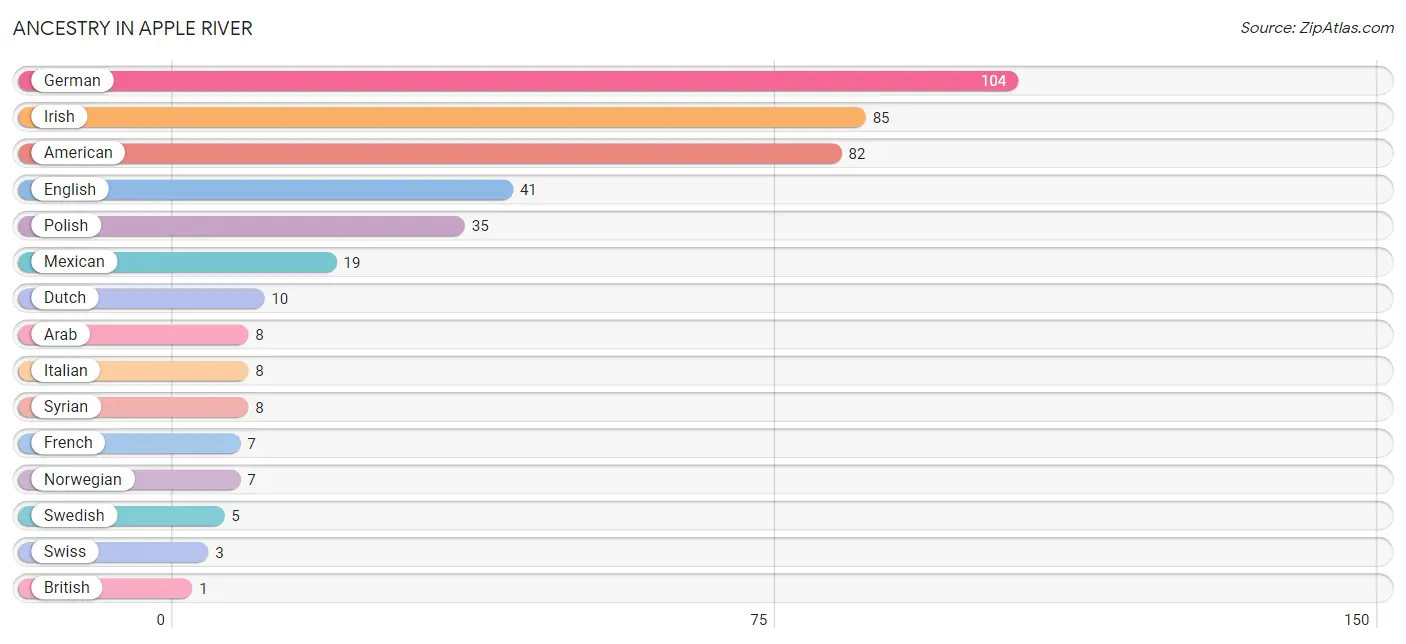
| Ancestry | # Population | % Population |
| American | 82 | 23.4% |
| Arab | 8 | 2.3% |
| British | 1 | 0.3% |
| Czech | 1 | 0.3% |
| Dutch | 10 | 2.9% |
| English | 41 | 11.7% |
| European | 1 | 0.3% |
| French | 7 | 2.0% |
| German | 104 | 29.7% |
| Irish | 85 | 24.3% |
| Italian | 8 | 2.3% |
| Mexican | 19 | 5.4% |
| Norwegian | 7 | 2.0% |
| Polish | 35 | 10.0% |
| Swedish | 5 | 1.4% |
| Swiss | 3 | 0.9% |
| Syrian | 8 | 2.3% | View All 17 Rows |
Immigrants in Apple River
The most numerous immigrant groups reported in Apple River came from Asia (6 | 1.7%), Western Asia (6 | 1.7%), Saudi Arabia (3 | 0.9%), Syria (3 | 0.9%), and Europe (2 | 0.6%), together accounting for 5.7% of all Apple River residents.
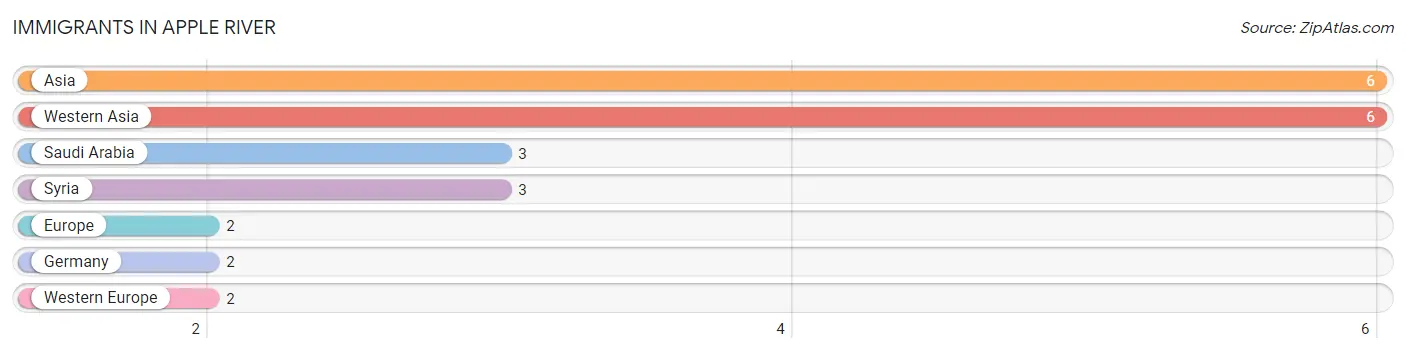
| Immigration Origin | # Population | % Population |
| Asia | 6 | 1.7% |
| Europe | 2 | 0.6% |
| Germany | 2 | 0.6% |
| Saudi Arabia | 3 | 0.9% |
| Syria | 3 | 0.9% |
| Western Asia | 6 | 1.7% |
| Western Europe | 2 | 0.6% | View All 7 Rows |
Sex and Age in Apple River
Sex and Age in Apple River
The most populous age groups in Apple River are 50 to 54 Years (20 | 11.6%) for men and 45 to 49 Years (29 | 16.3%) for women.
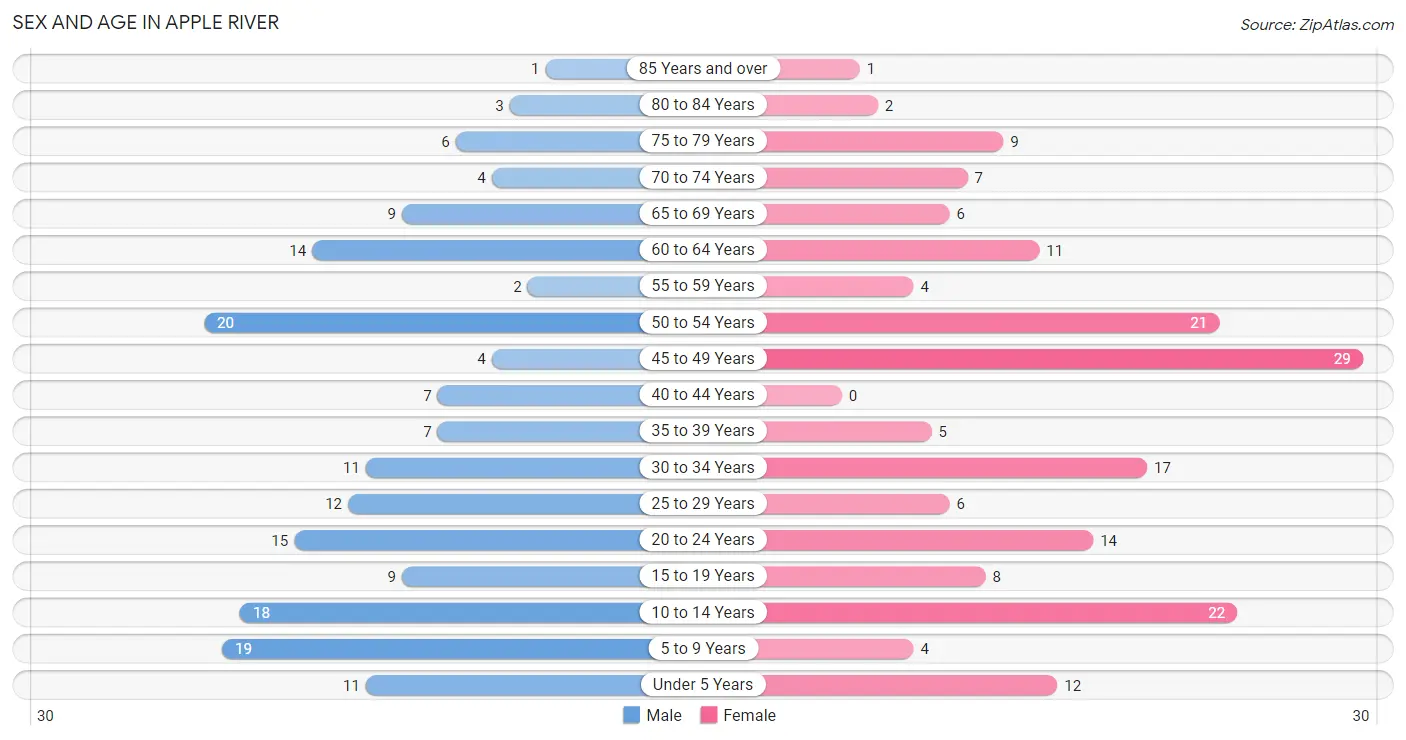
| Age Bracket | Male | Female |
| Under 5 Years | 11 (6.4%) | 12 (6.7%) |
| 5 to 9 Years | 19 (11.1%) | 4 (2.2%) |
| 10 to 14 Years | 18 (10.5%) | 22 (12.4%) |
| 15 to 19 Years | 9 (5.2%) | 8 (4.5%) |
| 20 to 24 Years | 15 (8.7%) | 14 (7.9%) |
| 25 to 29 Years | 12 (7.0%) | 6 (3.4%) |
| 30 to 34 Years | 11 (6.4%) | 17 (9.6%) |
| 35 to 39 Years | 7 (4.1%) | 5 (2.8%) |
| 40 to 44 Years | 7 (4.1%) | 0 (0.0%) |
| 45 to 49 Years | 4 (2.3%) | 29 (16.3%) |
| 50 to 54 Years | 20 (11.6%) | 21 (11.8%) |
| 55 to 59 Years | 2 (1.2%) | 4 (2.2%) |
| 60 to 64 Years | 14 (8.1%) | 11 (6.2%) |
| 65 to 69 Years | 9 (5.2%) | 6 (3.4%) |
| 70 to 74 Years | 4 (2.3%) | 7 (3.9%) |
| 75 to 79 Years | 6 (3.5%) | 9 (5.1%) |
| 80 to 84 Years | 3 (1.7%) | 2 (1.1%) |
| 85 Years and over | 1 (0.6%) | 1 (0.6%) |
| Total | 172 (100.0%) | 178 (100.0%) |
Families and Households in Apple River
Median Family Size in Apple River
The median family size in Apple River is 2.61 persons per family, with single male/father families (7 | 6.6%) accounting for the largest median family size of 2.86 persons per family. On the other hand, married-couple families (75 | 70.8%) represent the smallest median family size with 2.55 persons per family.
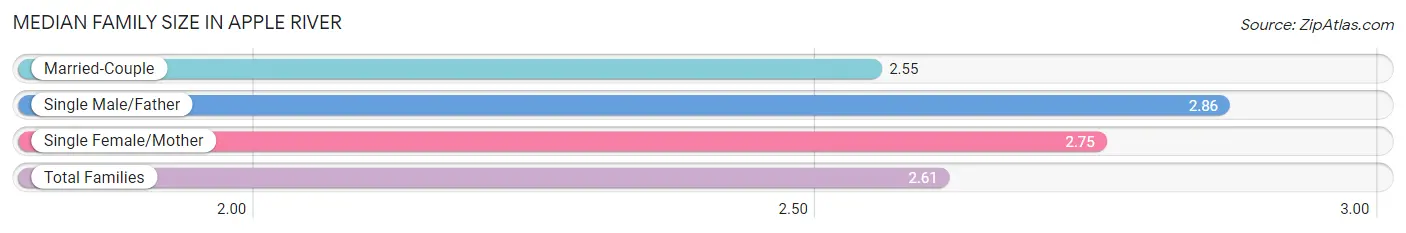
| Family Type | # Families | Family Size |
| Married-Couple | 75 (70.8%) | 2.55 |
| Single Male/Father | 7 (6.6%) | 2.86 |
| Single Female/Mother | 24 (22.6%) | 2.75 |
| Total Families | 106 (100.0%) | 2.61 |
Median Household Size in Apple River
The median household size in Apple River is 2.29 persons per household, with single male/father households (7 | 4.6%) accounting for the largest median household size of 4.29 persons per household. non-family households (47 | 30.7%) represent the smallest median household size with 1.30 persons per household.
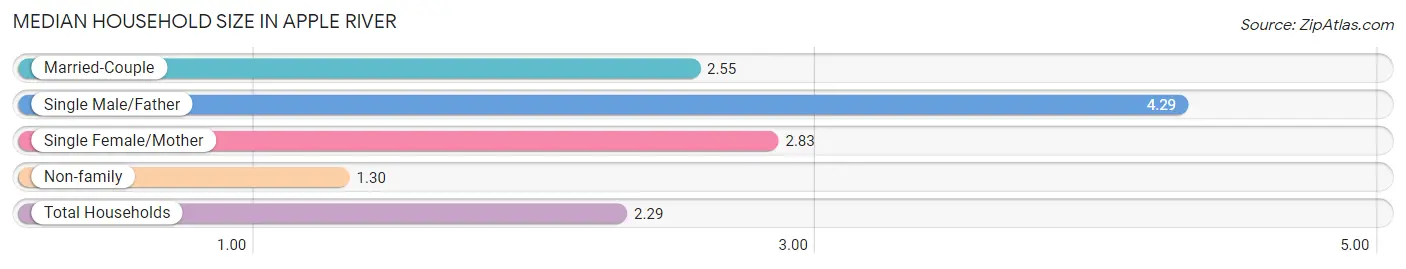
| Household Type | # Households | Household Size |
| Married-Couple | 75 (49.0%) | 2.55 |
| Single Male/Father | 7 (4.6%) | 4.29 |
| Single Female/Mother | 24 (15.7%) | 2.83 |
| Non-family | 47 (30.7%) | 1.30 |
| Total Households | 153 (100.0%) | 2.29 |
Household Size by Marriage Status in Apple River
Out of a total of 153 households in Apple River, 106 (69.3%) are family households, while 47 (30.7%) are nonfamily households. The most numerous type of family households are 2-person households, comprising 43, and the most common type of nonfamily households are 1-person households, comprising 35.
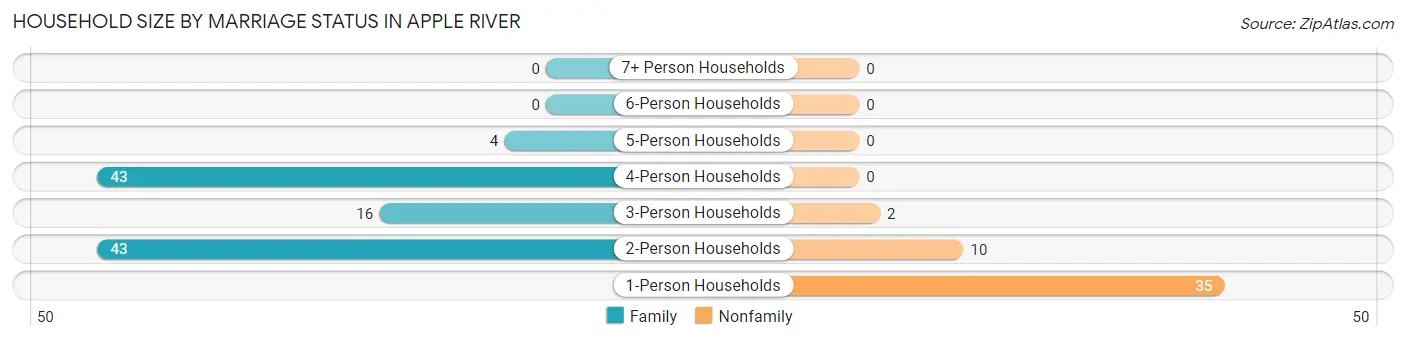
| Household Size | Family Households | Nonfamily Households |
| 1-Person Households | - | 35 (22.9%) |
| 2-Person Households | 43 (28.1%) | 10 (6.5%) |
| 3-Person Households | 16 (10.5%) | 2 (1.3%) |
| 4-Person Households | 43 (28.1%) | 0 (0.0%) |
| 5-Person Households | 4 (2.6%) | 0 (0.0%) |
| 6-Person Households | 0 (0.0%) | 0 (0.0%) |
| 7+ Person Households | 0 (0.0%) | 0 (0.0%) |
| Total | 106 (69.3%) | 47 (30.7%) |
Female Fertility in Apple River
Fertility by Age in Apple River
Average fertility rate in Apple River is 22.0 births per 1,000 women. Women in the age bracket of 20 to 34 years have the highest fertility rate with 54.0 births per 1,000 women. Women in the age bracket of 20 to 34 years acount for 100.0% of all women with births.
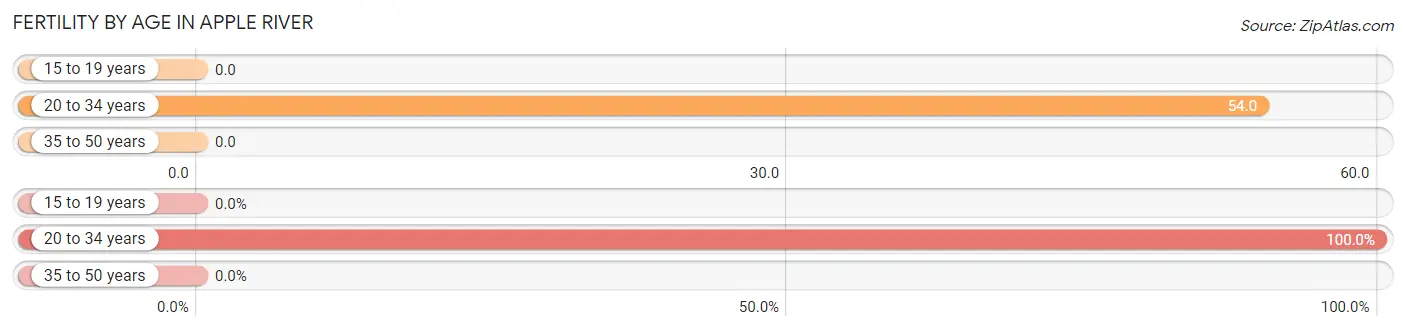
| Age Bracket | Women with Births | Births / 1,000 Women |
| 15 to 19 years | 0 (0.0%) | 0.0 |
| 20 to 34 years | 2 (100.0%) | 54.0 |
| 35 to 50 years | 0 (0.0%) | 0.0 |
| Total | 2 (100.0%) | 22.0 |
Fertility by Age by Marriage Status in Apple River
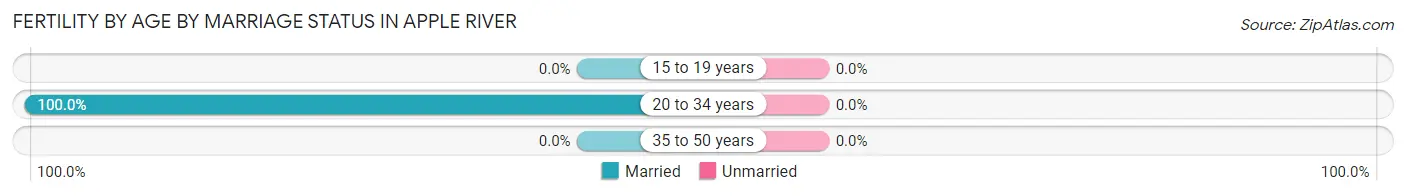
| Age Bracket | Married | Unmarried |
| 15 to 19 years | 0 (0.0%) | 0 (0.0%) |
| 20 to 34 years | 2 (100.0%) | 0 (0.0%) |
| 35 to 50 years | 0 (0.0%) | 0 (0.0%) |
| Total | 2 (100.0%) | 0 (0.0%) |
Fertility by Education in Apple River
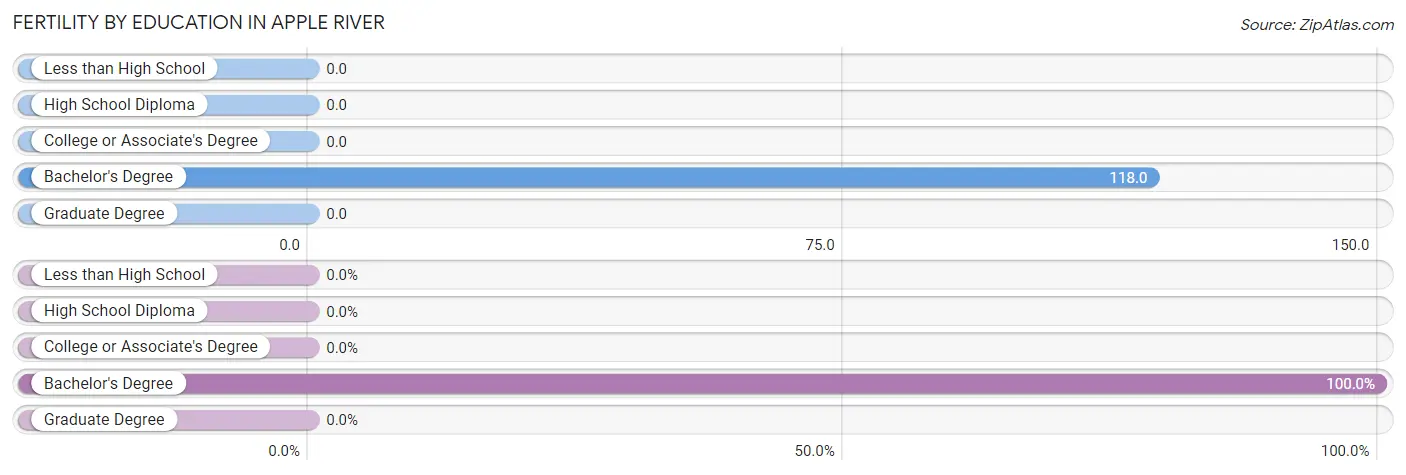
| Educational Attainment | Women with Births | Births / 1,000 Women |
| Less than High School | 0 (0.0%) | 0.0 |
| High School Diploma | 0 (0.0%) | 0.0 |
| College or Associate's Degree | 0 (0.0%) | 0.0 |
| Bachelor's Degree | 2 (100.0%) | 118.0 |
| Graduate Degree | 0 (0.0%) | 0.0 |
| Total | 2 (100.0%) | 22.0 |
Fertility by Education by Marriage Status in Apple River
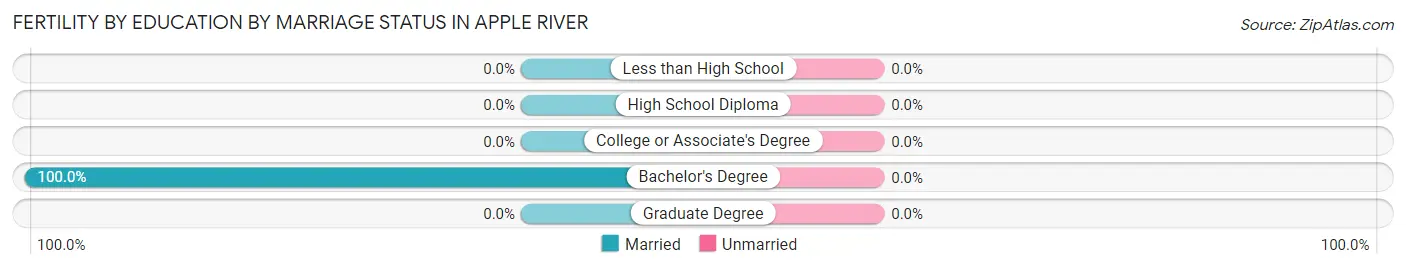
| Educational Attainment | Married | Unmarried |
| Less than High School | 0 (0.0%) | 0 (0.0%) |
| High School Diploma | 0 (0.0%) | 0 (0.0%) |
| College or Associate's Degree | 0 (0.0%) | 0 (0.0%) |
| Bachelor's Degree | 2 (100.0%) | 0 (0.0%) |
| Graduate Degree | 0 (0.0%) | 0 (0.0%) |
| Total | 2 (100.0%) | 0 (0.0%) |
Employment Characteristics in Apple River
Employment by Class of Employer in Apple River
Among the 167 employed individuals in Apple River, private company employees (134 | 80.2%), local government employees (20 | 12.0%), and self-employed (not incorporated) (8 | 4.8%) make up the most common classes of employment.
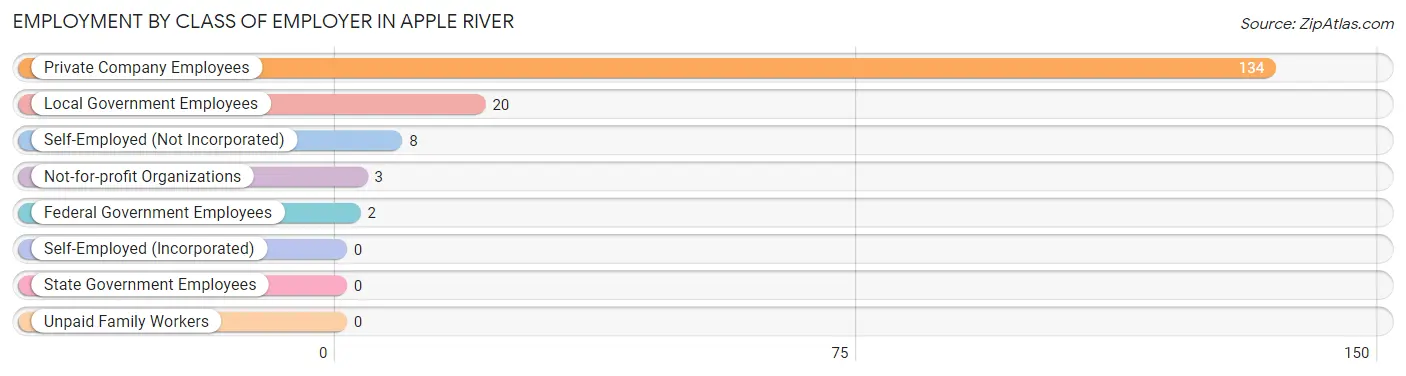
| Employer Class | # Employees | % Employees |
| Private Company Employees | 134 | 80.2% |
| Self-Employed (Incorporated) | 0 | 0.0% |
| Self-Employed (Not Incorporated) | 8 | 4.8% |
| Not-for-profit Organizations | 3 | 1.8% |
| Local Government Employees | 20 | 12.0% |
| State Government Employees | 0 | 0.0% |
| Federal Government Employees | 2 | 1.2% |
| Unpaid Family Workers | 0 | 0.0% |
| Total | 167 | 100.0% |
Employment Status by Age in Apple River
According to the labor force statistics for Apple River, out of the total population over 16 years of age (262), 64.9% or 170 individuals are in the labor force, with 1.8% or 3 of them unemployed. The age group with the highest labor force participation rate is 35 to 44 years, with 100.0% or 19 individuals in the labor force. Within the labor force, the 45 to 54 years age range has the highest percentage of unemployed individuals, with 4.8% or 3 of them being unemployed.
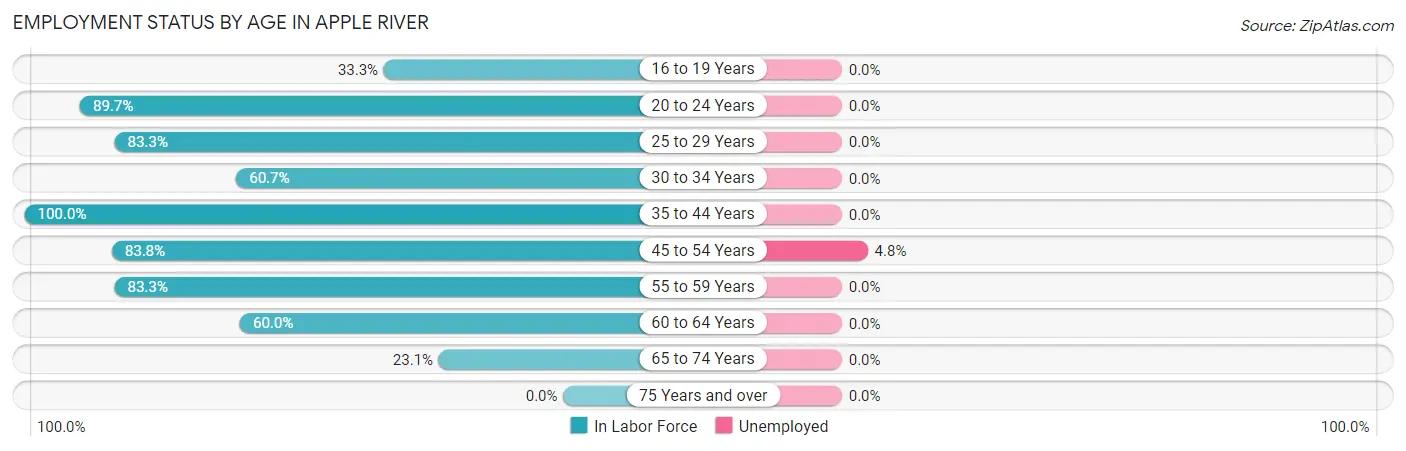
| Age Bracket | In Labor Force | Unemployed |
| 16 to 19 Years | 5 (33.3%) | 0 (0.0%) |
| 20 to 24 Years | 26 (89.7%) | 0 (0.0%) |
| 25 to 29 Years | 15 (83.3%) | 0 (0.0%) |
| 30 to 34 Years | 17 (60.7%) | 0 (0.0%) |
| 35 to 44 Years | 19 (100.0%) | 0 (0.0%) |
| 45 to 54 Years | 62 (83.8%) | 3 (4.8%) |
| 55 to 59 Years | 5 (83.3%) | 0 (0.0%) |
| 60 to 64 Years | 15 (60.0%) | 0 (0.0%) |
| 65 to 74 Years | 6 (23.1%) | 0 (0.0%) |
| 75 Years and over | 0 (0.0%) | 0 (0.0%) |
| Total | 170 (64.9%) | 3 (1.8%) |
Employment Status by Educational Attainment in Apple River
According to labor force statistics for Apple River, 78.2% of individuals (133) out of the total population between 25 and 64 years of age (170) are in the labor force, with 2.3% or 3 of them being unemployed. The group with the highest labor force participation rate are those with the educational attainment of bachelor's degree or higher, with 84.0% or 21 individuals in the labor force. Within the labor force, individuals with bachelor's degree or higher education have the highest percentage of unemployment, with 14.3% or 3 of them being unemployed.
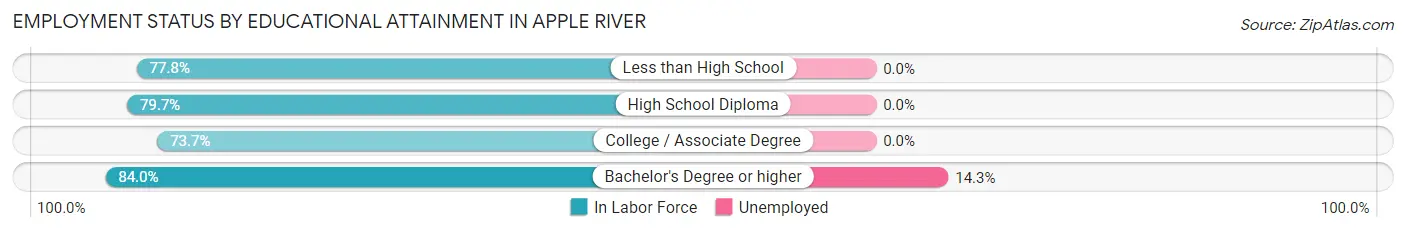
| Educational Attainment | In Labor Force | Unemployed |
| Less than High School | 7 (77.8%) | 0 (0.0%) |
| High School Diploma | 63 (79.7%) | 0 (0.0%) |
| College / Associate Degree | 42 (73.7%) | 0 (0.0%) |
| Bachelor's Degree or higher | 21 (84.0%) | 4 (14.3%) |
| Total | 133 (78.2%) | 4 (2.3%) |
Employment Occupations by Sex in Apple River
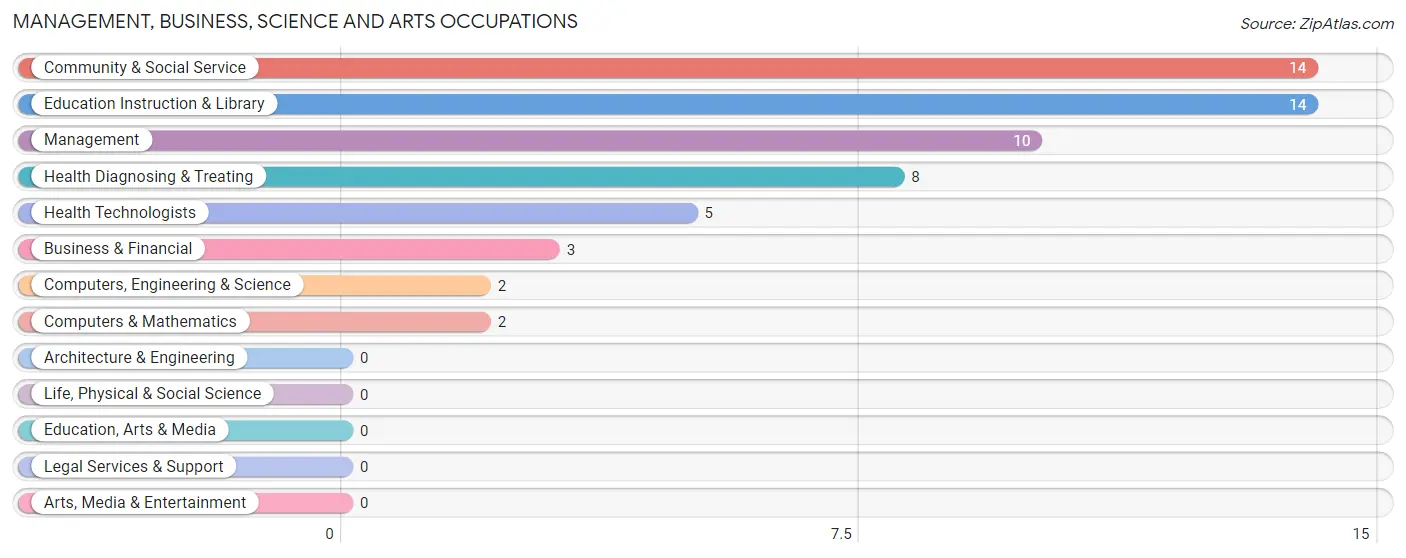
Management, Business, Science and Arts Occupations
The most common Management, Business, Science and Arts occupations in Apple River are Community & Social Service (14 | 8.4%), Education Instruction & Library (14 | 8.4%), Management (10 | 6.0%), Health Diagnosing & Treating (8 | 4.8%), and Health Technologists (5 | 3.0%).
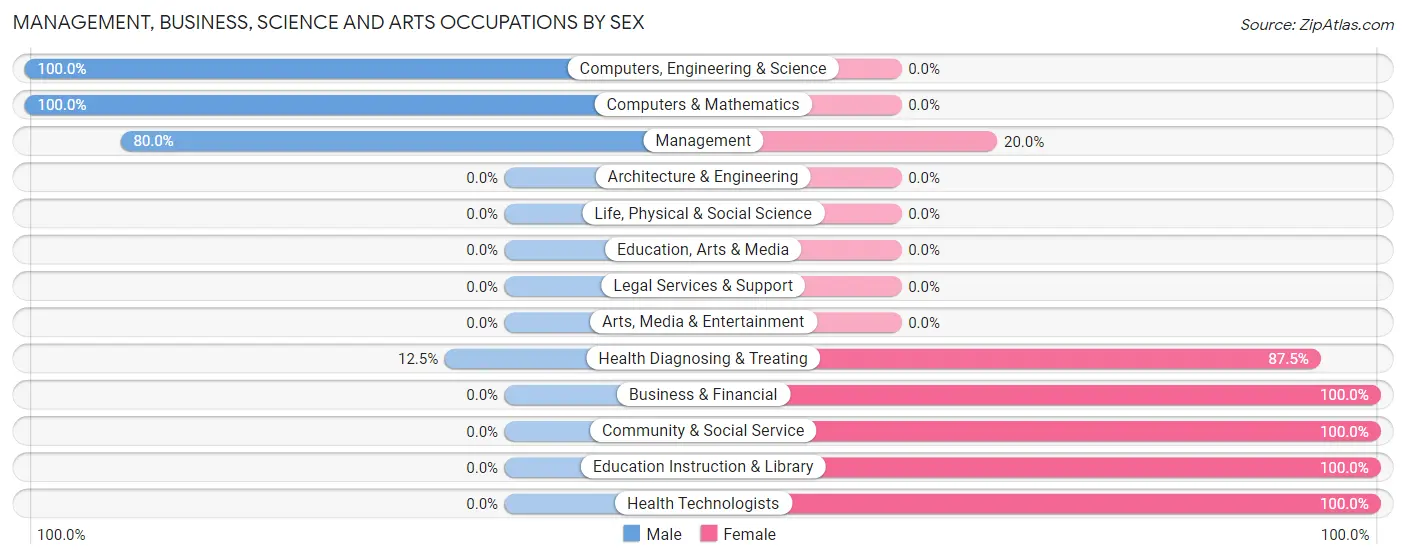
Management, Business, Science and Arts Occupations by Sex
Within the Management, Business, Science and Arts occupations in Apple River, the most male-oriented occupations are Computers, Engineering & Science (100.0%), Computers & Mathematics (100.0%), and Management (80.0%), while the most female-oriented occupations are Business & Financial (100.0%), Community & Social Service (100.0%), and Education Instruction & Library (100.0%).
| Occupation | Male | Female |
| Management | 8 (80.0%) | 2 (20.0%) |
| Business & Financial | 0 (0.0%) | 3 (100.0%) |
| Computers, Engineering & Science | 2 (100.0%) | 0 (0.0%) |
| Computers & Mathematics | 2 (100.0%) | 0 (0.0%) |
| Architecture & Engineering | 0 (0.0%) | 0 (0.0%) |
| Life, Physical & Social Science | 0 (0.0%) | 0 (0.0%) |
| Community & Social Service | 0 (0.0%) | 14 (100.0%) |
| Education, Arts & Media | 0 (0.0%) | 0 (0.0%) |
| Legal Services & Support | 0 (0.0%) | 0 (0.0%) |
| Education Instruction & Library | 0 (0.0%) | 14 (100.0%) |
| Arts, Media & Entertainment | 0 (0.0%) | 0 (0.0%) |
| Health Diagnosing & Treating | 1 (12.5%) | 7 (87.5%) |
| Health Technologists | 0 (0.0%) | 5 (100.0%) |
| Total (Category) | 11 (29.7%) | 26 (70.3%) |
| Total (Overall) | 86 (51.5%) | 81 (48.5%) |
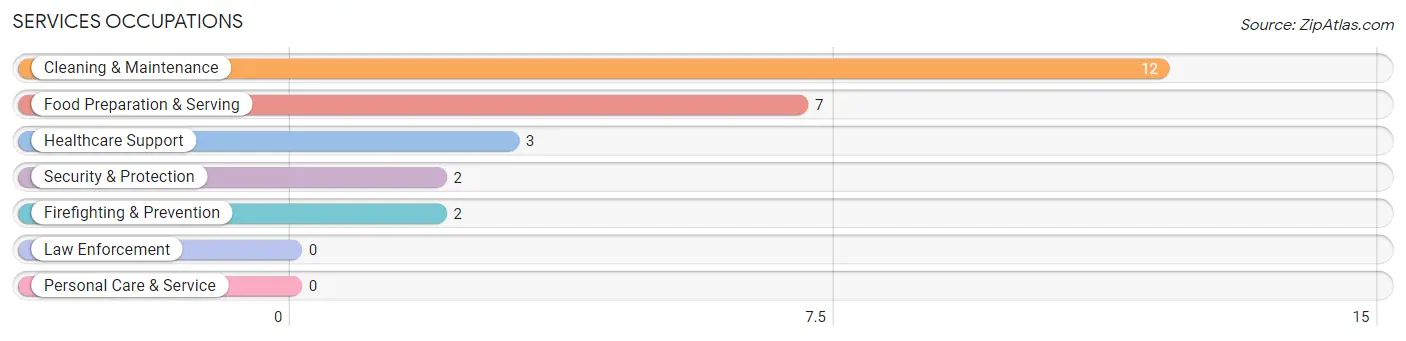
Services Occupations
The most common Services occupations in Apple River are Cleaning & Maintenance (12 | 7.2%), Food Preparation & Serving (7 | 4.2%), Healthcare Support (3 | 1.8%), Security & Protection (2 | 1.2%), and Firefighting & Prevention (2 | 1.2%).
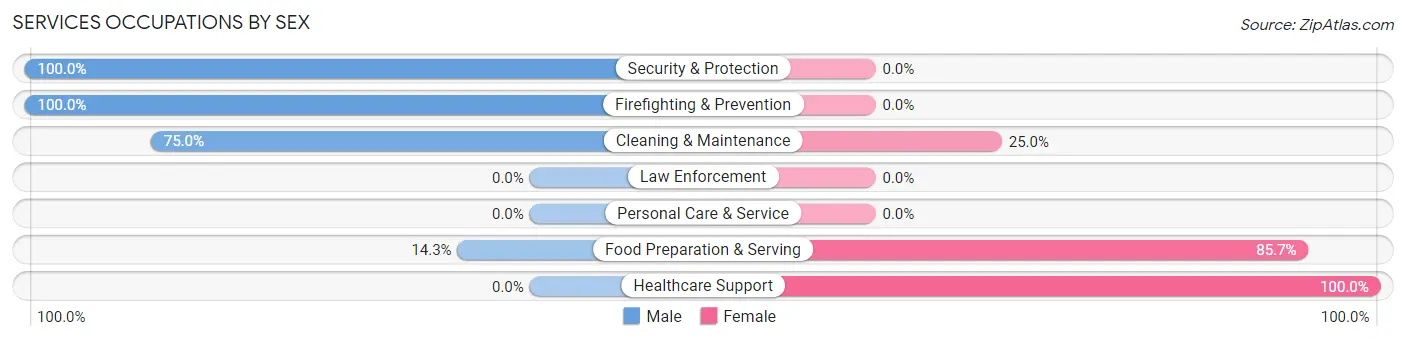
Services Occupations by Sex
Within the Services occupations in Apple River, the most male-oriented occupations are Security & Protection (100.0%), Firefighting & Prevention (100.0%), and Cleaning & Maintenance (75.0%), while the most female-oriented occupations are Healthcare Support (100.0%), Food Preparation & Serving (85.7%), and Cleaning & Maintenance (25.0%).
| Occupation | Male | Female |
| Healthcare Support | 0 (0.0%) | 3 (100.0%) |
| Security & Protection | 2 (100.0%) | 0 (0.0%) |
| Firefighting & Prevention | 2 (100.0%) | 0 (0.0%) |
| Law Enforcement | 0 (0.0%) | 0 (0.0%) |
| Food Preparation & Serving | 1 (14.3%) | 6 (85.7%) |
| Cleaning & Maintenance | 9 (75.0%) | 3 (25.0%) |
| Personal Care & Service | 0 (0.0%) | 0 (0.0%) |
| Total (Category) | 12 (50.0%) | 12 (50.0%) |
| Total (Overall) | 86 (51.5%) | 81 (48.5%) |
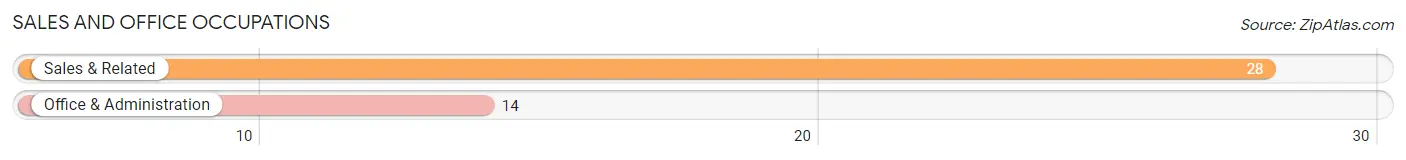
Sales and Office Occupations
The most common Sales and Office occupations in Apple River are Sales & Related (28 | 16.8%), and Office & Administration (14 | 8.4%).
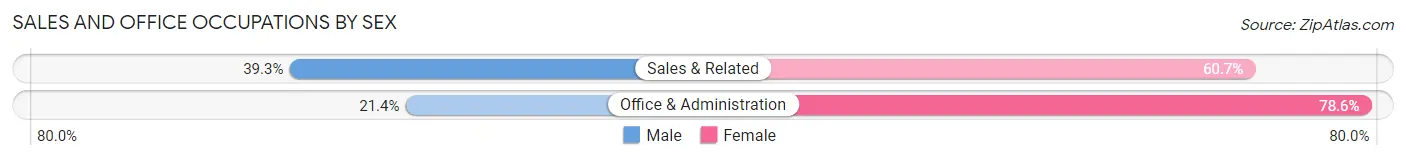
Sales and Office Occupations by Sex
| Occupation | Male | Female |
| Sales & Related | 11 (39.3%) | 17 (60.7%) |
| Office & Administration | 3 (21.4%) | 11 (78.6%) |
| Total (Category) | 14 (33.3%) | 28 (66.7%) |
| Total (Overall) | 86 (51.5%) | 81 (48.5%) |
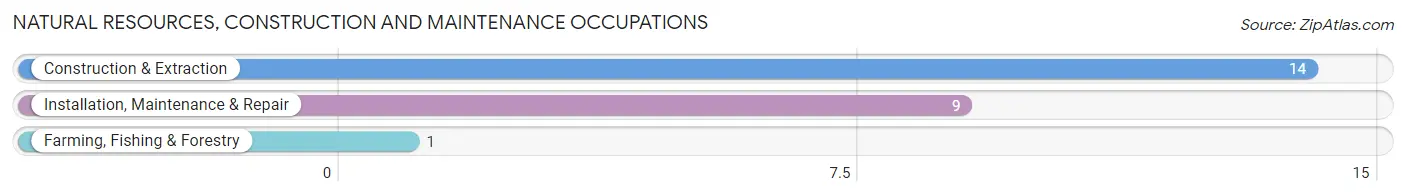
Natural Resources, Construction and Maintenance Occupations
The most common Natural Resources, Construction and Maintenance occupations in Apple River are Construction & Extraction (14 | 8.4%), Installation, Maintenance & Repair (9 | 5.4%), and Farming, Fishing & Forestry (1 | 0.6%).
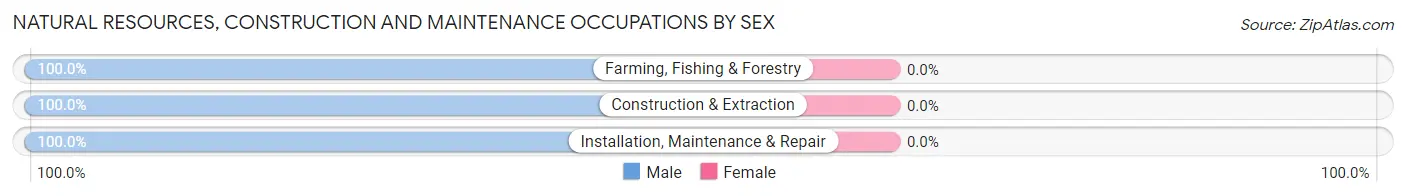
Natural Resources, Construction and Maintenance Occupations by Sex
| Occupation | Male | Female |
| Farming, Fishing & Forestry | 1 (100.0%) | 0 (0.0%) |
| Construction & Extraction | 14 (100.0%) | 0 (0.0%) |
| Installation, Maintenance & Repair | 9 (100.0%) | 0 (0.0%) |
| Total (Category) | 24 (100.0%) | 0 (0.0%) |
| Total (Overall) | 86 (51.5%) | 81 (48.5%) |
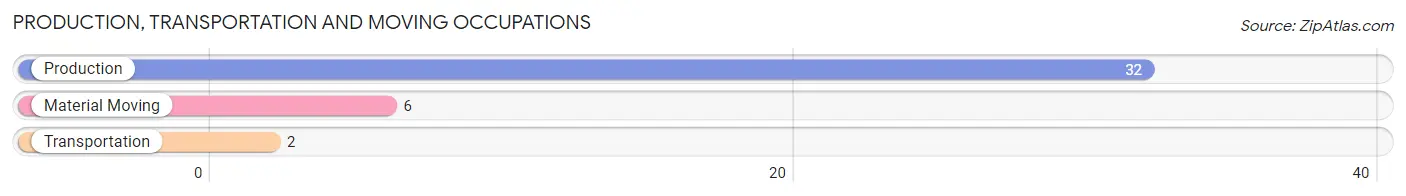
Production, Transportation and Moving Occupations
The most common Production, Transportation and Moving occupations in Apple River are Production (32 | 19.2%), Material Moving (6 | 3.6%), and Transportation (2 | 1.2%).
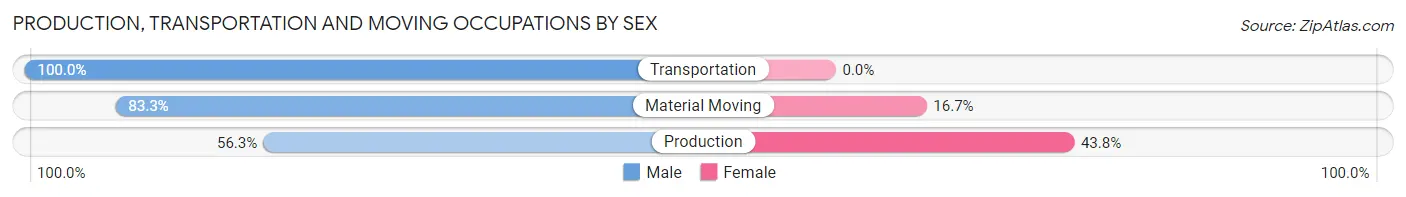
Production, Transportation and Moving Occupations by Sex
| Occupation | Male | Female |
| Production | 18 (56.2%) | 14 (43.8%) |
| Transportation | 2 (100.0%) | 0 (0.0%) |
| Material Moving | 5 (83.3%) | 1 (16.7%) |
| Total (Category) | 25 (62.5%) | 15 (37.5%) |
| Total (Overall) | 86 (51.5%) | 81 (48.5%) |
Employment Industries by Sex in Apple River
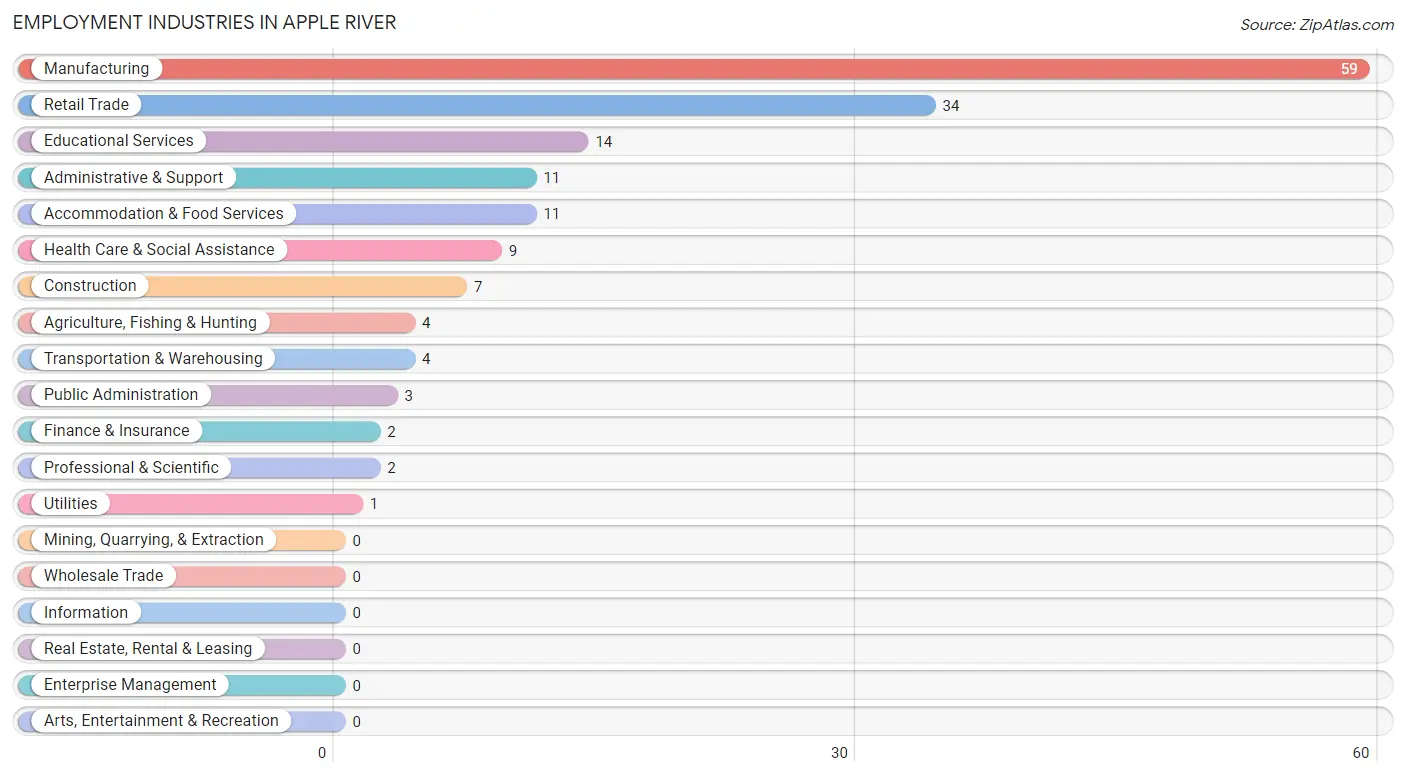
Employment Industries in Apple River
The major employment industries in Apple River include Manufacturing (59 | 35.3%), Retail Trade (34 | 20.4%), Educational Services (14 | 8.4%), Administrative & Support (11 | 6.6%), and Accommodation & Food Services (11 | 6.6%).
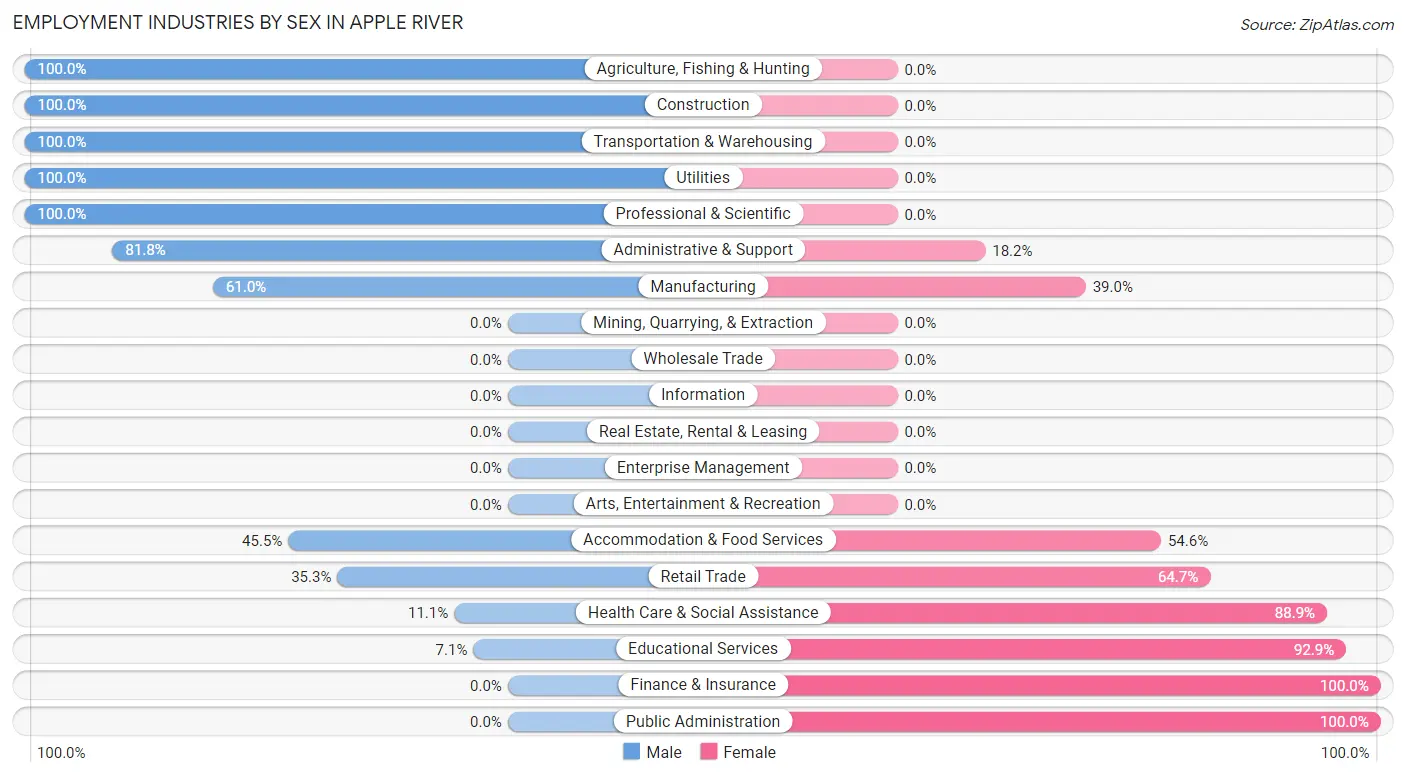
Employment Industries by Sex in Apple River
The Apple River industries that see more men than women are Agriculture, Fishing & Hunting (100.0%), Construction (100.0%), and Transportation & Warehousing (100.0%), whereas the industries that tend to have a higher number of women are Finance & Insurance (100.0%), Public Administration (100.0%), and Educational Services (92.9%).
| Industry | Male | Female |
| Agriculture, Fishing & Hunting | 4 (100.0%) | 0 (0.0%) |
| Mining, Quarrying, & Extraction | 0 (0.0%) | 0 (0.0%) |
| Construction | 7 (100.0%) | 0 (0.0%) |
| Manufacturing | 36 (61.0%) | 23 (39.0%) |
| Wholesale Trade | 0 (0.0%) | 0 (0.0%) |
| Retail Trade | 12 (35.3%) | 22 (64.7%) |
| Transportation & Warehousing | 4 (100.0%) | 0 (0.0%) |
| Utilities | 1 (100.0%) | 0 (0.0%) |
| Information | 0 (0.0%) | 0 (0.0%) |
| Finance & Insurance | 0 (0.0%) | 2 (100.0%) |
| Real Estate, Rental & Leasing | 0 (0.0%) | 0 (0.0%) |
| Professional & Scientific | 2 (100.0%) | 0 (0.0%) |
| Enterprise Management | 0 (0.0%) | 0 (0.0%) |
| Administrative & Support | 9 (81.8%) | 2 (18.2%) |
| Educational Services | 1 (7.1%) | 13 (92.9%) |
| Health Care & Social Assistance | 1 (11.1%) | 8 (88.9%) |
| Arts, Entertainment & Recreation | 0 (0.0%) | 0 (0.0%) |
| Accommodation & Food Services | 5 (45.5%) | 6 (54.5%) |
| Public Administration | 0 (0.0%) | 3 (100.0%) |
| Total | 86 (51.5%) | 81 (48.5%) |
Education in Apple River
School Enrollment in Apple River
The most common levels of schooling among the 90 students in Apple River are middle school (29 | 32.2%), elementary school (24 | 26.7%), and high school (21 | 23.3%).
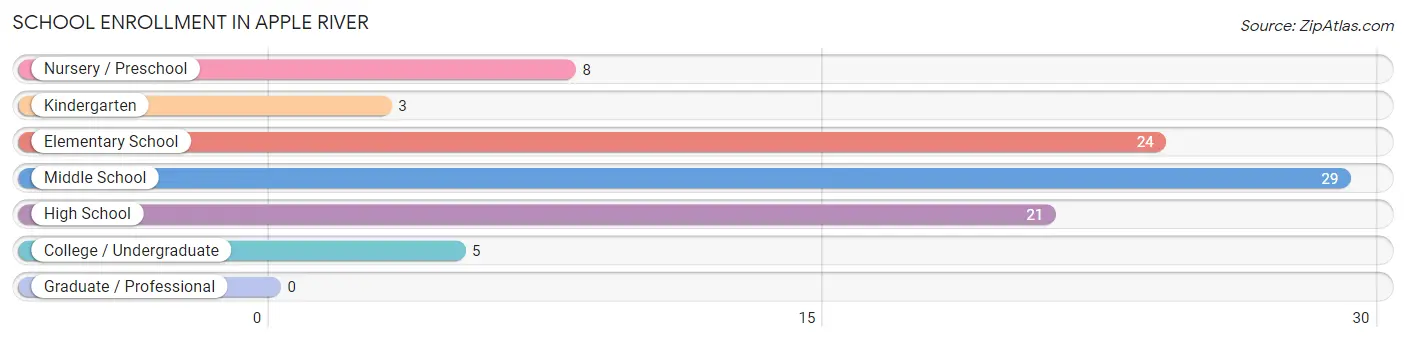
| School Level | # Students | % Students |
| Nursery / Preschool | 8 | 8.9% |
| Kindergarten | 3 | 3.3% |
| Elementary School | 24 | 26.7% |
| Middle School | 29 | 32.2% |
| High School | 21 | 23.3% |
| College / Undergraduate | 5 | 5.6% |
| Graduate / Professional | 0 | 0.0% |
| Total | 90 | 100.0% |
School Enrollment by Age by Funding Source in Apple River
Out of a total of 90 students who are enrolled in schools in Apple River, 5 (5.6%) attend a private institution, while the remaining 85 (94.4%) are enrolled in public schools. The age group of 15 to 17 year olds has the highest likelihood of being enrolled in private schools, with 5 (35.7% in the age bracket) enrolled. Conversely, the age group of 3 to 4 year olds has the lowest likelihood of being enrolled in a private school, with 8 (100.0% in the age bracket) attending a public institution.
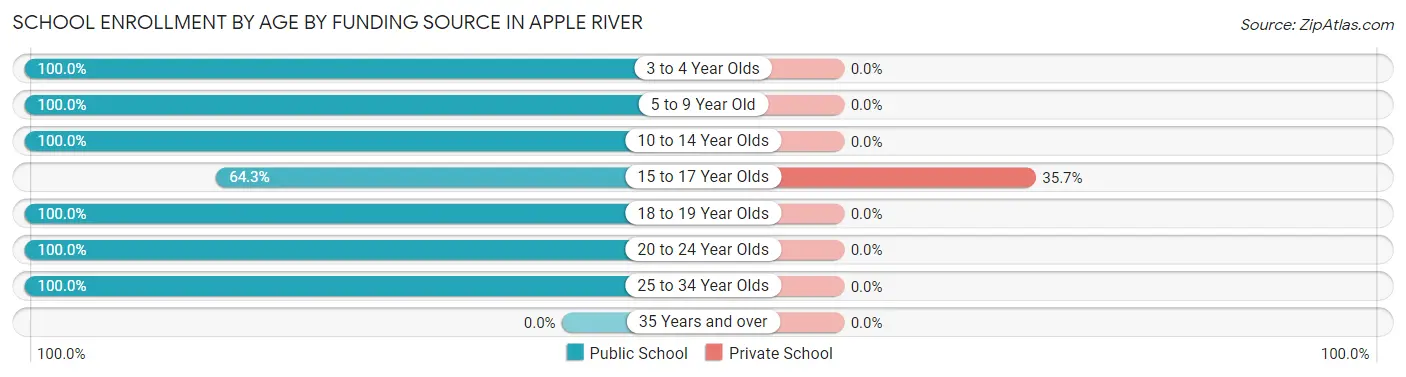
| Age Bracket | Public School | Private School |
| 3 to 4 Year Olds | 8 (100.0%) | 0 (0.0%) |
| 5 to 9 Year Old | 23 (100.0%) | 0 (0.0%) |
| 10 to 14 Year Olds | 40 (100.0%) | 0 (0.0%) |
| 15 to 17 Year Olds | 9 (64.3%) | 5 (35.7%) |
| 18 to 19 Year Olds | 1 (100.0%) | 0 (0.0%) |
| 20 to 24 Year Olds | 2 (100.0%) | 0 (0.0%) |
| 25 to 34 Year Olds | 2 (100.0%) | 0 (0.0%) |
| 35 Years and over | 0 (0.0%) | 0 (0.0%) |
| Total | 85 (94.4%) | 5 (5.6%) |
Educational Attainment by Field of Study in Apple River
Business (10 | 30.3%), social sciences (9 | 27.3%), education (7 | 21.2%), physical & health sciences (4 | 12.1%), and arts & humanities (2 | 6.1%) are the most common fields of study among 33 individuals in Apple River who have obtained a bachelor's degree or higher.
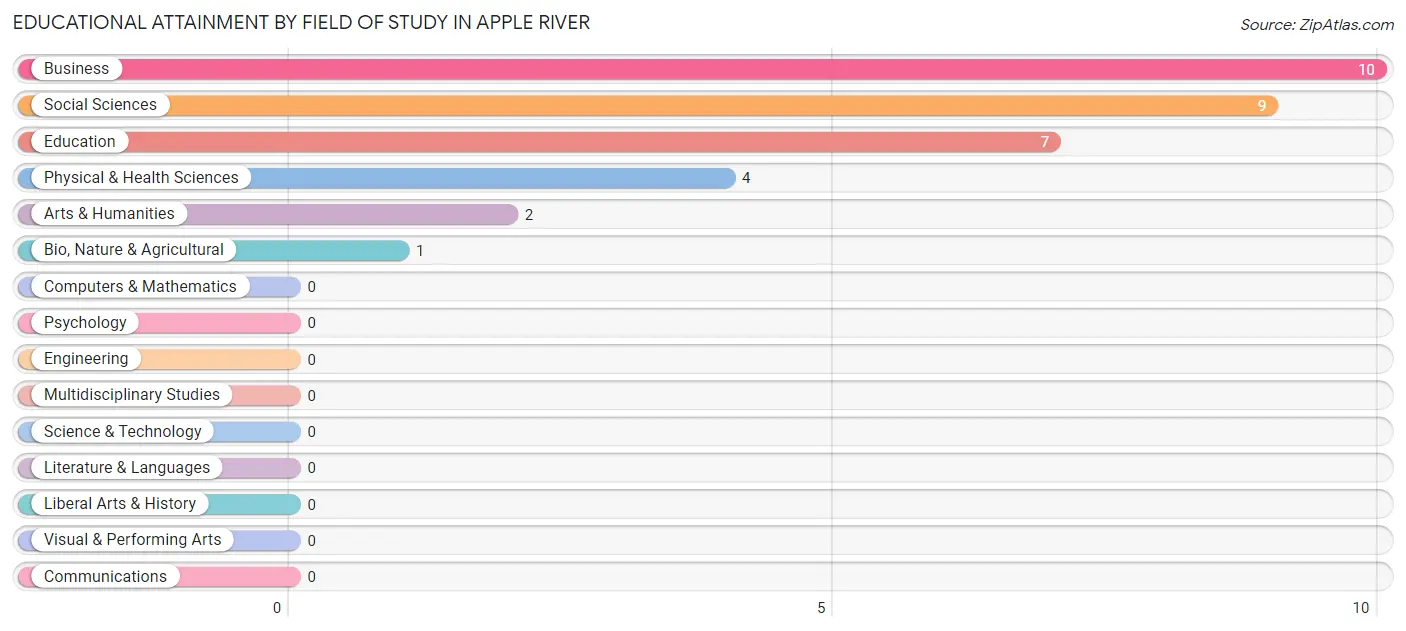
| Field of Study | # Graduates | % Graduates |
| Computers & Mathematics | 0 | 0.0% |
| Bio, Nature & Agricultural | 1 | 3.0% |
| Physical & Health Sciences | 4 | 12.1% |
| Psychology | 0 | 0.0% |
| Social Sciences | 9 | 27.3% |
| Engineering | 0 | 0.0% |
| Multidisciplinary Studies | 0 | 0.0% |
| Science & Technology | 0 | 0.0% |
| Business | 10 | 30.3% |
| Education | 7 | 21.2% |
| Literature & Languages | 0 | 0.0% |
| Liberal Arts & History | 0 | 0.0% |
| Visual & Performing Arts | 0 | 0.0% |
| Communications | 0 | 0.0% |
| Arts & Humanities | 2 | 6.1% |
| Total | 33 | 100.0% |
Transportation & Commute in Apple River
Vehicle Availability by Sex in Apple River
The most prevalent vehicle ownership categories in Apple River are males with 2 vehicles (39, accounting for 45.4%) and females with 2 vehicles (31, making up 48.1%).
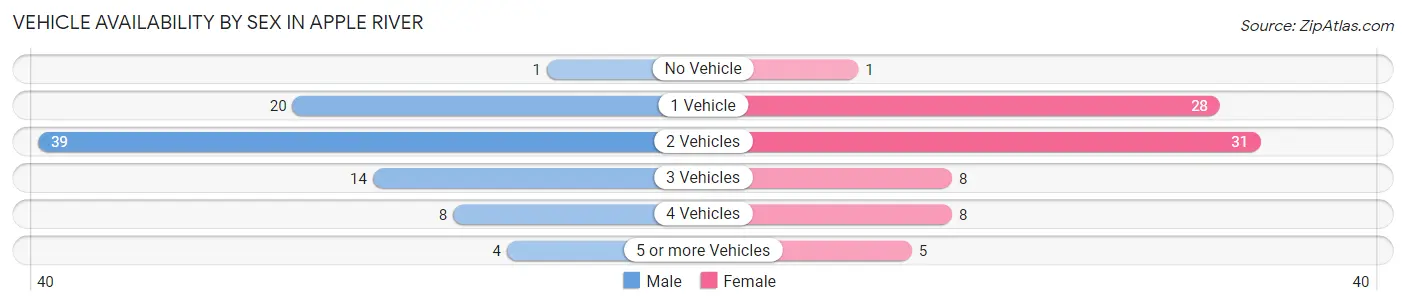
| Vehicles Available | Male | Female |
| No Vehicle | 1 (1.2%) | 1 (1.2%) |
| 1 Vehicle | 20 (23.3%) | 28 (34.6%) |
| 2 Vehicles | 39 (45.4%) | 31 (38.3%) |
| 3 Vehicles | 14 (16.3%) | 8 (9.9%) |
| 4 Vehicles | 8 (9.3%) | 8 (9.9%) |
| 5 or more Vehicles | 4 (4.6%) | 5 (6.2%) |
| Total | 86 (100.0%) | 81 (100.0%) |
Commute Time in Apple River
The most frequently occuring commute durations in Apple River are 45 to 59 minutes (28 commuters, 17.3%), 20 to 24 minutes (27 commuters, 16.7%), and 30 to 34 minutes (27 commuters, 16.7%).
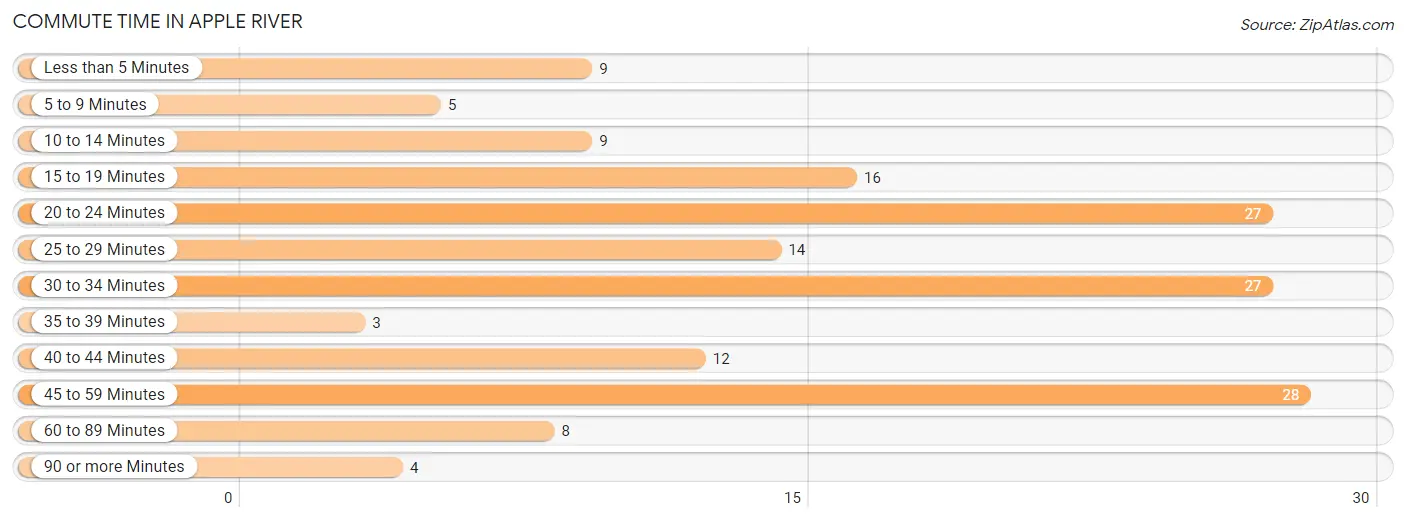
| Commute Time | # Commuters | % Commuters |
| Less than 5 Minutes | 9 | 5.6% |
| 5 to 9 Minutes | 5 | 3.1% |
| 10 to 14 Minutes | 9 | 5.6% |
| 15 to 19 Minutes | 16 | 9.9% |
| 20 to 24 Minutes | 27 | 16.7% |
| 25 to 29 Minutes | 14 | 8.6% |
| 30 to 34 Minutes | 27 | 16.7% |
| 35 to 39 Minutes | 3 | 1.8% |
| 40 to 44 Minutes | 12 | 7.4% |
| 45 to 59 Minutes | 28 | 17.3% |
| 60 to 89 Minutes | 8 | 4.9% |
| 90 or more Minutes | 4 | 2.5% |
Commute Time by Sex in Apple River
The most common commute times in Apple River are 45 to 59 minutes (20 commuters, 24.4%) for males and 20 to 24 minutes (18 commuters, 22.5%) for females.
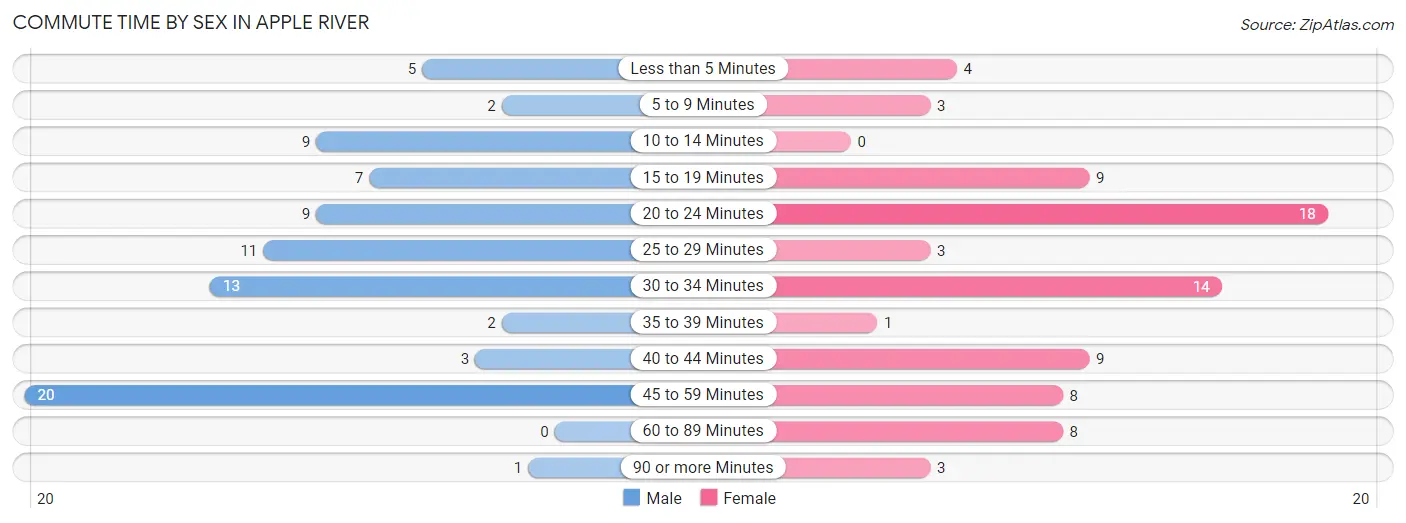
| Commute Time | Male | Female |
| Less than 5 Minutes | 5 (6.1%) | 4 (5.0%) |
| 5 to 9 Minutes | 2 (2.4%) | 3 (3.7%) |
| 10 to 14 Minutes | 9 (11.0%) | 0 (0.0%) |
| 15 to 19 Minutes | 7 (8.5%) | 9 (11.3%) |
| 20 to 24 Minutes | 9 (11.0%) | 18 (22.5%) |
| 25 to 29 Minutes | 11 (13.4%) | 3 (3.7%) |
| 30 to 34 Minutes | 13 (15.9%) | 14 (17.5%) |
| 35 to 39 Minutes | 2 (2.4%) | 1 (1.3%) |
| 40 to 44 Minutes | 3 (3.7%) | 9 (11.3%) |
| 45 to 59 Minutes | 20 (24.4%) | 8 (10.0%) |
| 60 to 89 Minutes | 0 (0.0%) | 8 (10.0%) |
| 90 or more Minutes | 1 (1.2%) | 3 (3.7%) |
Time of Departure to Work by Sex in Apple River
The most frequent times of departure to work in Apple River are 12:00 AM to 4:59 AM (14, 17.1%) for males and 7:30 AM to 7:59 AM (22, 27.5%) for females.
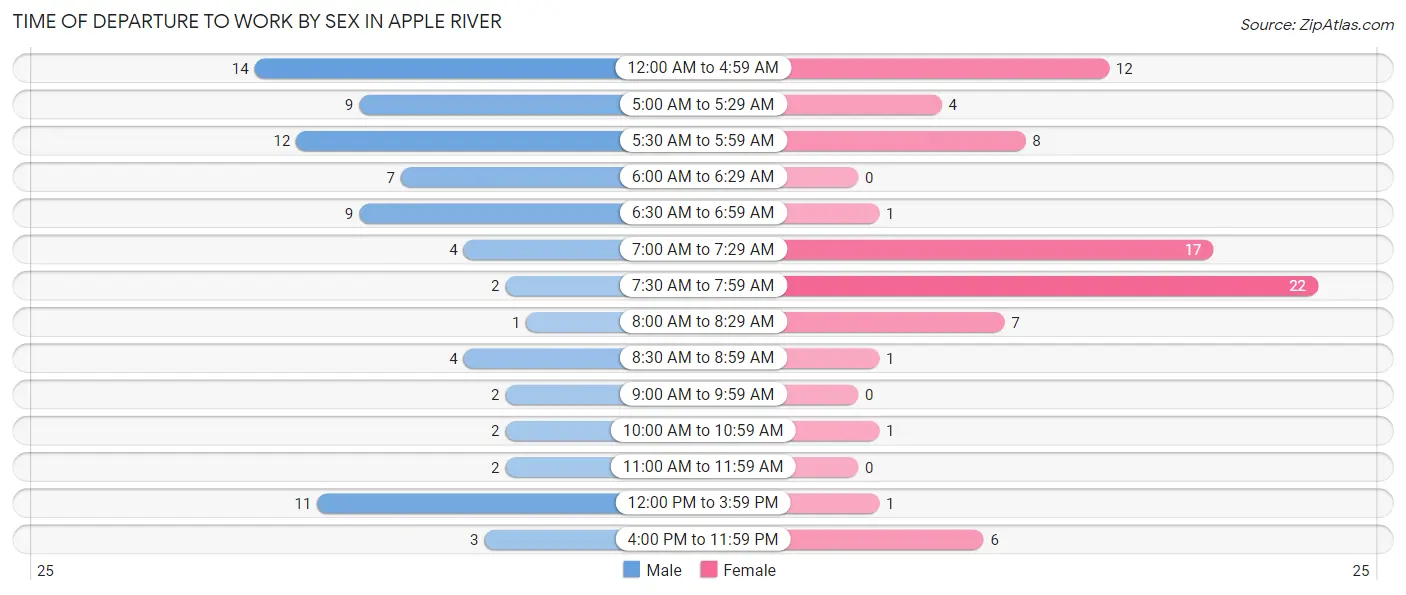
| Time of Departure | Male | Female |
| 12:00 AM to 4:59 AM | 14 (17.1%) | 12 (15.0%) |
| 5:00 AM to 5:29 AM | 9 (11.0%) | 4 (5.0%) |
| 5:30 AM to 5:59 AM | 12 (14.6%) | 8 (10.0%) |
| 6:00 AM to 6:29 AM | 7 (8.5%) | 0 (0.0%) |
| 6:30 AM to 6:59 AM | 9 (11.0%) | 1 (1.3%) |
| 7:00 AM to 7:29 AM | 4 (4.9%) | 17 (21.2%) |
| 7:30 AM to 7:59 AM | 2 (2.4%) | 22 (27.5%) |
| 8:00 AM to 8:29 AM | 1 (1.2%) | 7 (8.7%) |
| 8:30 AM to 8:59 AM | 4 (4.9%) | 1 (1.3%) |
| 9:00 AM to 9:59 AM | 2 (2.4%) | 0 (0.0%) |
| 10:00 AM to 10:59 AM | 2 (2.4%) | 1 (1.3%) |
| 11:00 AM to 11:59 AM | 2 (2.4%) | 0 (0.0%) |
| 12:00 PM to 3:59 PM | 11 (13.4%) | 1 (1.3%) |
| 4:00 PM to 11:59 PM | 3 (3.7%) | 6 (7.5%) |
| Total | 82 (100.0%) | 80 (100.0%) |
Housing Occupancy in Apple River
Occupancy by Ownership in Apple River
Of the total 153 dwellings in Apple River, owner-occupied units account for 110 (71.9%), while renter-occupied units make up 43 (28.1%).
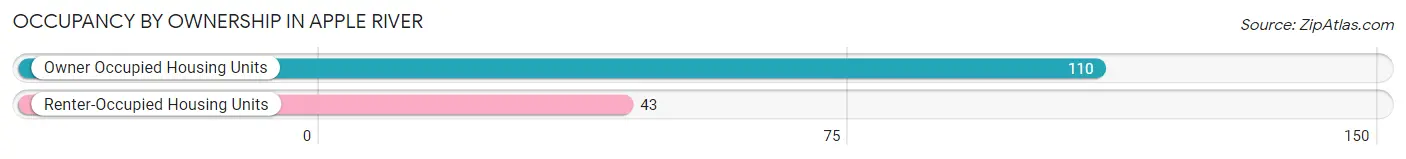
| Occupancy | # Housing Units | % Housing Units |
| Owner Occupied Housing Units | 110 | 71.9% |
| Renter-Occupied Housing Units | 43 | 28.1% |
| Total Occupied Housing Units | 153 | 100.0% |
Occupancy by Household Size in Apple River
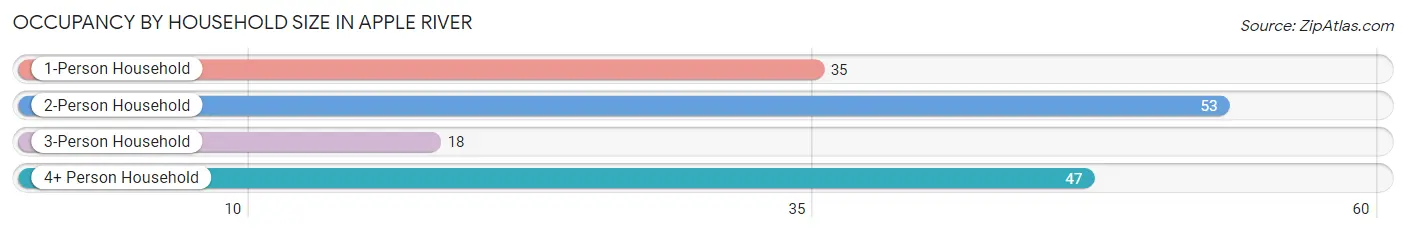
| Household Size | # Housing Units | % Housing Units |
| 1-Person Household | 35 | 22.9% |
| 2-Person Household | 53 | 34.6% |
| 3-Person Household | 18 | 11.8% |
| 4+ Person Household | 47 | 30.7% |
| Total Housing Units | 153 | 100.0% |
Occupancy by Ownership by Household Size in Apple River
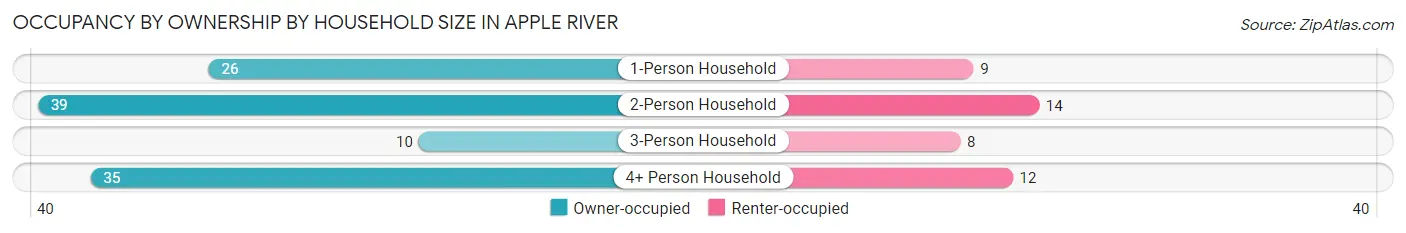
| Household Size | Owner-occupied | Renter-occupied |
| 1-Person Household | 26 (74.3%) | 9 (25.7%) |
| 2-Person Household | 39 (73.6%) | 14 (26.4%) |
| 3-Person Household | 10 (55.6%) | 8 (44.4%) |
| 4+ Person Household | 35 (74.5%) | 12 (25.5%) |
| Total Housing Units | 110 (71.9%) | 43 (28.1%) |
Occupancy by Educational Attainment in Apple River

| Household Size | Owner-occupied | Renter-occupied |
| Less than High School | 2 (50.0%) | 2 (50.0%) |
| High School Diploma | 63 (88.7%) | 8 (11.3%) |
| College/Associate Degree | 32 (60.4%) | 21 (39.6%) |
| Bachelor's Degree or higher | 13 (52.0%) | 12 (48.0%) |
Occupancy by Age of Householder in Apple River
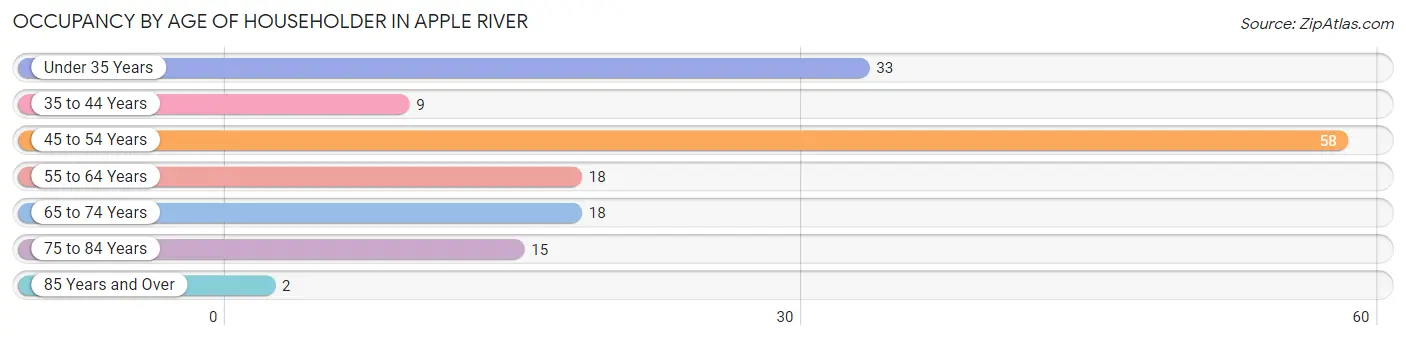
| Age Bracket | # Households | % Households |
| Under 35 Years | 33 | 21.6% |
| 35 to 44 Years | 9 | 5.9% |
| 45 to 54 Years | 58 | 37.9% |
| 55 to 64 Years | 18 | 11.8% |
| 65 to 74 Years | 18 | 11.8% |
| 75 to 84 Years | 15 | 9.8% |
| 85 Years and Over | 2 | 1.3% |
| Total | 153 | 100.0% |
Housing Finances in Apple River
Median Income by Occupancy in Apple River
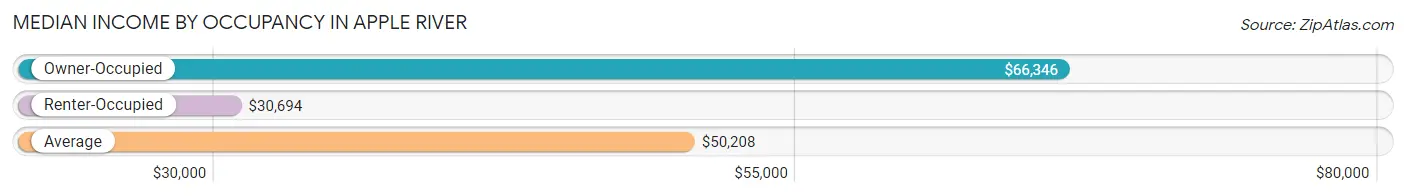
| Occupancy Type | # Households | Median Income |
| Owner-Occupied | 110 (71.9%) | $66,346 |
| Renter-Occupied | 43 (28.1%) | $30,694 |
| Average | 153 (100.0%) | $50,208 |
Occupancy by Householder Income Bracket in Apple River
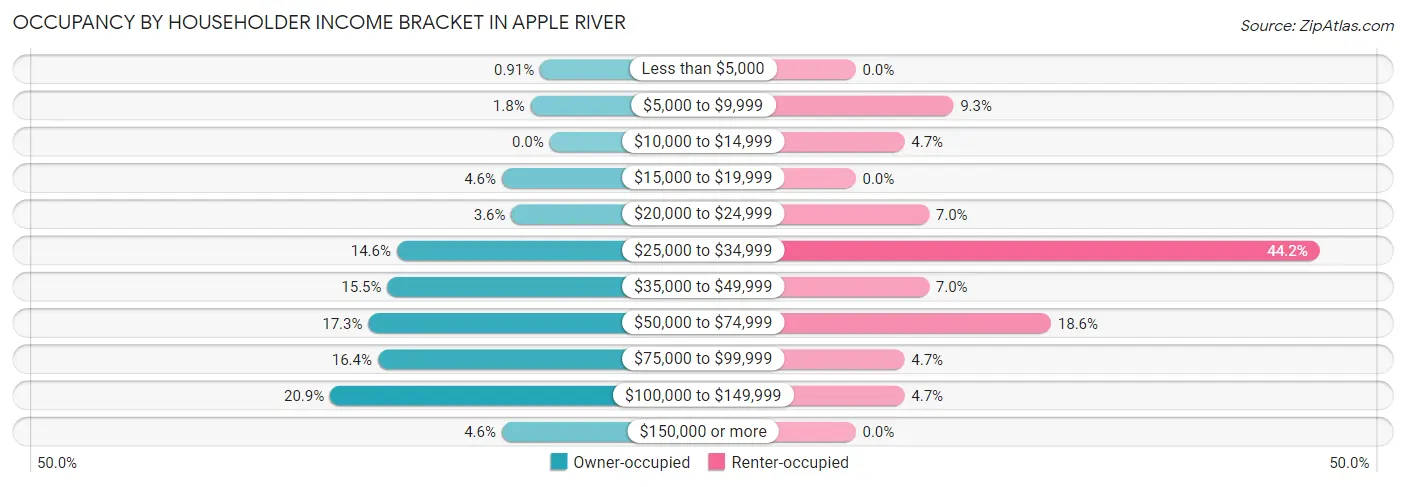
| Income Bracket | Owner-occupied | Renter-occupied |
| Less than $5,000 | 1 (0.9%) | 0 (0.0%) |
| $5,000 to $9,999 | 2 (1.8%) | 4 (9.3%) |
| $10,000 to $14,999 | 0 (0.0%) | 2 (4.6%) |
| $15,000 to $19,999 | 5 (4.5%) | 0 (0.0%) |
| $20,000 to $24,999 | 4 (3.6%) | 3 (7.0%) |
| $25,000 to $34,999 | 16 (14.5%) | 19 (44.2%) |
| $35,000 to $49,999 | 17 (15.4%) | 3 (7.0%) |
| $50,000 to $74,999 | 19 (17.3%) | 8 (18.6%) |
| $75,000 to $99,999 | 18 (16.4%) | 2 (4.6%) |
| $100,000 to $149,999 | 23 (20.9%) | 2 (4.6%) |
| $150,000 or more | 5 (4.5%) | 0 (0.0%) |
| Total | 110 (100.0%) | 43 (100.0%) |
Monthly Housing Cost Tiers in Apple River
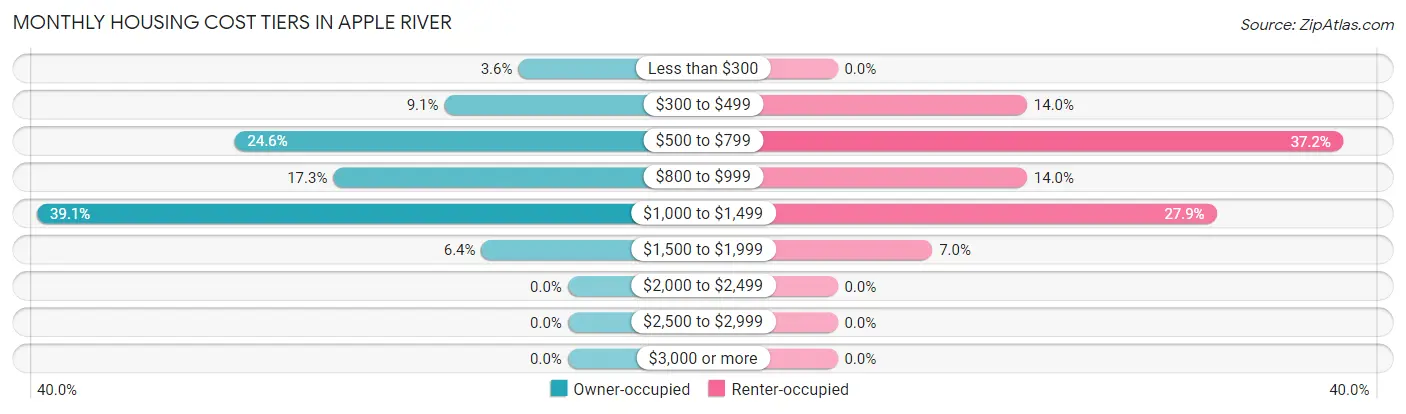
| Monthly Cost | Owner-occupied | Renter-occupied |
| Less than $300 | 4 (3.6%) | 0 (0.0%) |
| $300 to $499 | 10 (9.1%) | 6 (14.0%) |
| $500 to $799 | 27 (24.5%) | 16 (37.2%) |
| $800 to $999 | 19 (17.3%) | 6 (14.0%) |
| $1,000 to $1,499 | 43 (39.1%) | 12 (27.9%) |
| $1,500 to $1,999 | 7 (6.4%) | 3 (7.0%) |
| $2,000 to $2,499 | 0 (0.0%) | 0 (0.0%) |
| $2,500 to $2,999 | 0 (0.0%) | 0 (0.0%) |
| $3,000 or more | 0 (0.0%) | 0 (0.0%) |
| Total | 110 (100.0%) | 43 (100.0%) |
Physical Housing Characteristics in Apple River
Housing Structures in Apple River
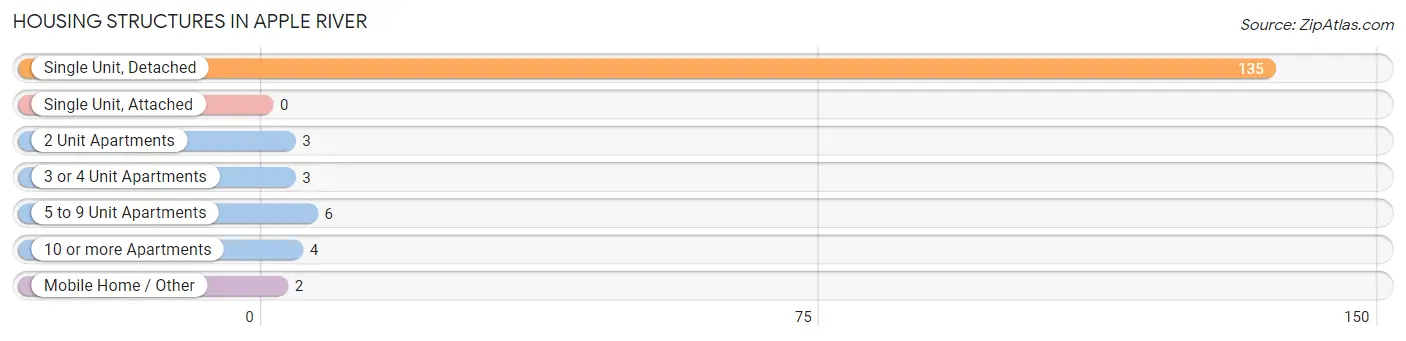
| Structure Type | # Housing Units | % Housing Units |
| Single Unit, Detached | 135 | 88.2% |
| Single Unit, Attached | 0 | 0.0% |
| 2 Unit Apartments | 3 | 2.0% |
| 3 or 4 Unit Apartments | 3 | 2.0% |
| 5 to 9 Unit Apartments | 6 | 3.9% |
| 10 or more Apartments | 4 | 2.6% |
| Mobile Home / Other | 2 | 1.3% |
| Total | 153 | 100.0% |
Housing Structures by Occupancy in Apple River
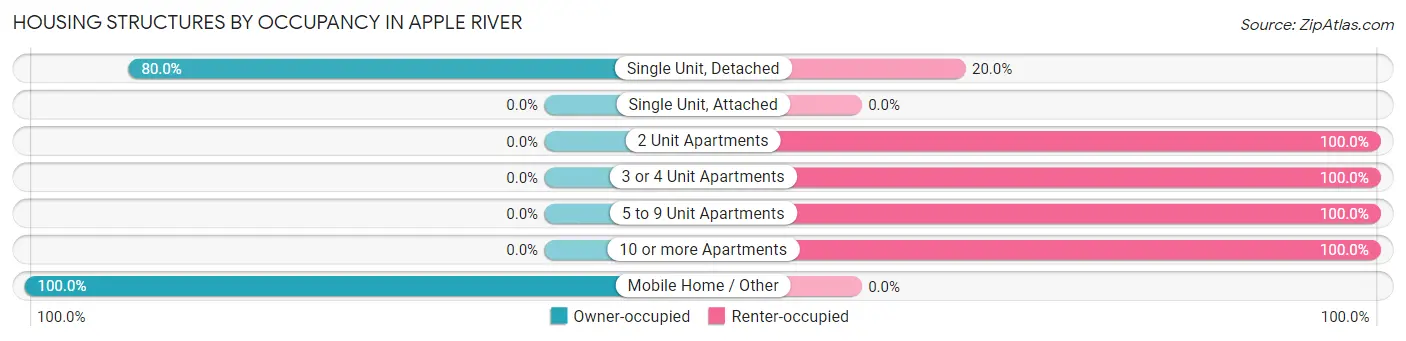
| Structure Type | Owner-occupied | Renter-occupied |
| Single Unit, Detached | 108 (80.0%) | 27 (20.0%) |
| Single Unit, Attached | 0 (0.0%) | 0 (0.0%) |
| 2 Unit Apartments | 0 (0.0%) | 3 (100.0%) |
| 3 or 4 Unit Apartments | 0 (0.0%) | 3 (100.0%) |
| 5 to 9 Unit Apartments | 0 (0.0%) | 6 (100.0%) |
| 10 or more Apartments | 0 (0.0%) | 4 (100.0%) |
| Mobile Home / Other | 2 (100.0%) | 0 (0.0%) |
| Total | 110 (71.9%) | 43 (28.1%) |
Housing Structures by Number of Rooms in Apple River
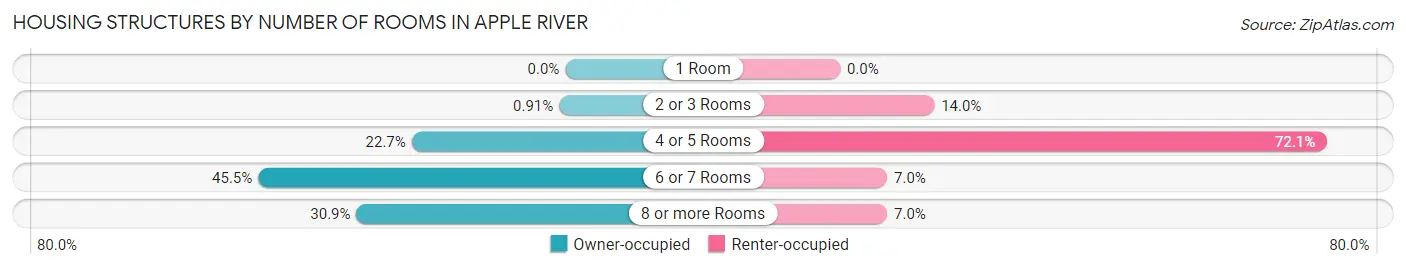
| Number of Rooms | Owner-occupied | Renter-occupied |
| 1 Room | 0 (0.0%) | 0 (0.0%) |
| 2 or 3 Rooms | 1 (0.9%) | 6 (14.0%) |
| 4 or 5 Rooms | 25 (22.7%) | 31 (72.1%) |
| 6 or 7 Rooms | 50 (45.5%) | 3 (7.0%) |
| 8 or more Rooms | 34 (30.9%) | 3 (7.0%) |
| Total | 110 (100.0%) | 43 (100.0%) |
Housing Structure by Heating Type in Apple River
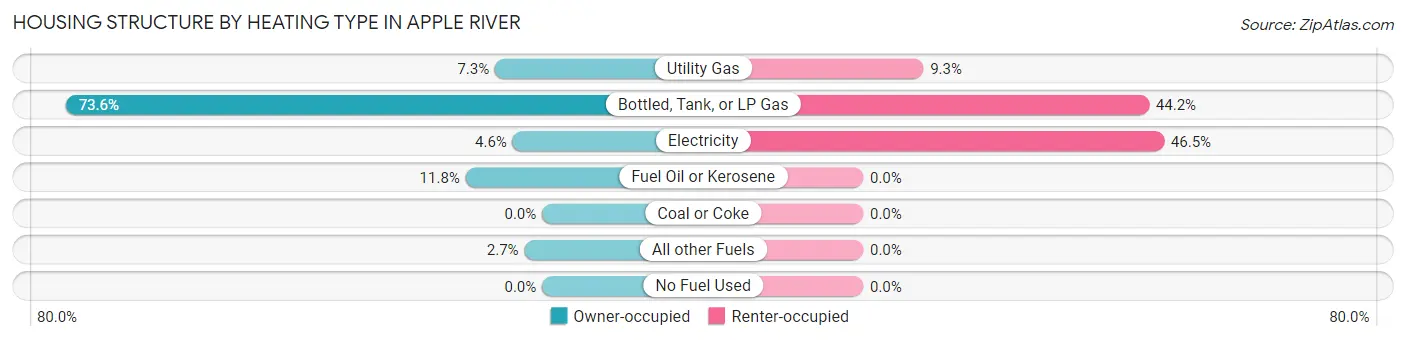
| Heating Type | Owner-occupied | Renter-occupied |
| Utility Gas | 8 (7.3%) | 4 (9.3%) |
| Bottled, Tank, or LP Gas | 81 (73.6%) | 19 (44.2%) |
| Electricity | 5 (4.5%) | 20 (46.5%) |
| Fuel Oil or Kerosene | 13 (11.8%) | 0 (0.0%) |
| Coal or Coke | 0 (0.0%) | 0 (0.0%) |
| All other Fuels | 3 (2.7%) | 0 (0.0%) |
| No Fuel Used | 0 (0.0%) | 0 (0.0%) |
| Total | 110 (100.0%) | 43 (100.0%) |
Household Vehicle Usage in Apple River
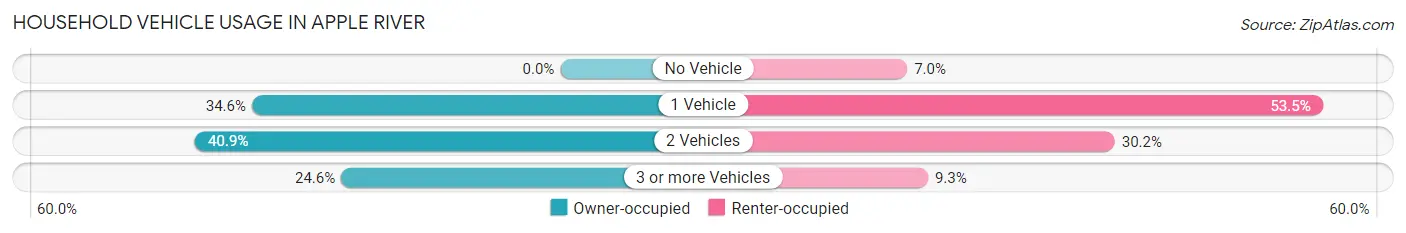
| Vehicles per Household | Owner-occupied | Renter-occupied |
| No Vehicle | 0 (0.0%) | 3 (7.0%) |
| 1 Vehicle | 38 (34.5%) | 23 (53.5%) |
| 2 Vehicles | 45 (40.9%) | 13 (30.2%) |
| 3 or more Vehicles | 27 (24.5%) | 4 (9.3%) |
| Total | 110 (100.0%) | 43 (100.0%) |
Real Estate & Mortgages in Apple River
Real Estate and Mortgage Overview in Apple River
| Characteristic | Without Mortgage | With Mortgage |
| Housing Units | 46 | 64 |
| Median Property Value | $95,000 | $80,000 |
| Median Household Income | $65,556 | $0 |
| Monthly Housing Costs | $560 | $0 |
| Real Estate Taxes | $1,893 | $0 |
Property Value by Mortgage Status in Apple River
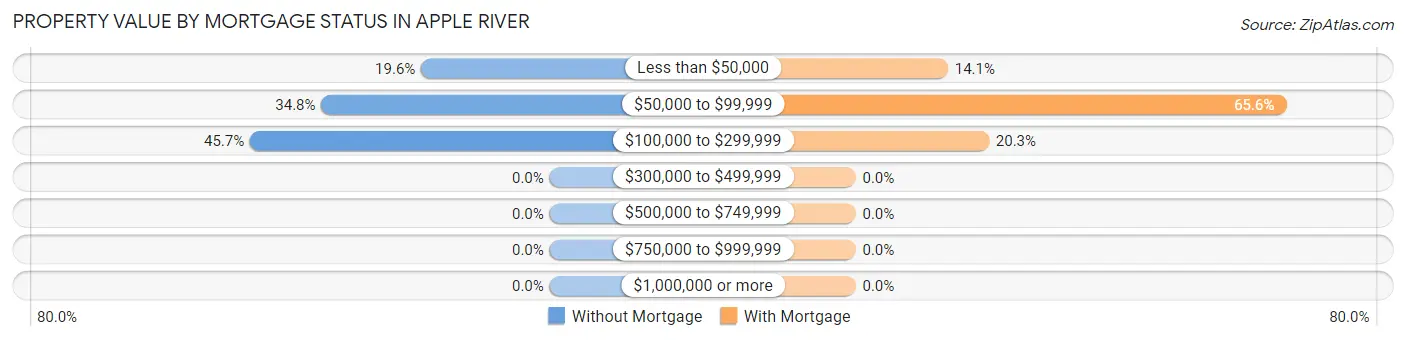
| Property Value | Without Mortgage | With Mortgage |
| Less than $50,000 | 9 (19.6%) | 9 (14.1%) |
| $50,000 to $99,999 | 16 (34.8%) | 42 (65.6%) |
| $100,000 to $299,999 | 21 (45.7%) | 13 (20.3%) |
| $300,000 to $499,999 | 0 (0.0%) | 0 (0.0%) |
| $500,000 to $749,999 | 0 (0.0%) | 0 (0.0%) |
| $750,000 to $999,999 | 0 (0.0%) | 0 (0.0%) |
| $1,000,000 or more | 0 (0.0%) | 0 (0.0%) |
| Total | 46 (100.0%) | 64 (100.0%) |
Household Income by Mortgage Status in Apple River
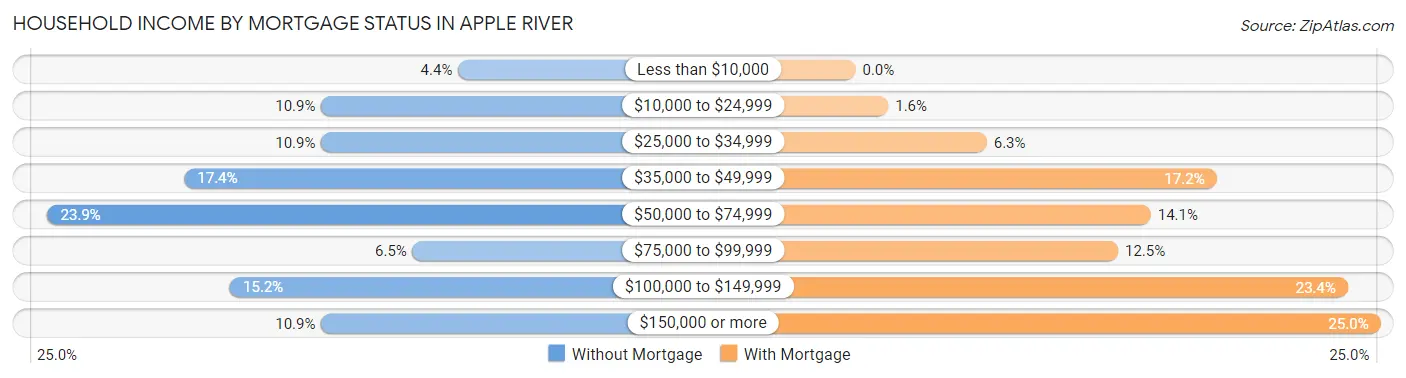
| Household Income | Without Mortgage | With Mortgage |
| Less than $10,000 | 2 (4.3%) | 0 (0.0%) |
| $10,000 to $24,999 | 5 (10.9%) | 1 (1.6%) |
| $25,000 to $34,999 | 5 (10.9%) | 4 (6.2%) |
| $35,000 to $49,999 | 8 (17.4%) | 11 (17.2%) |
| $50,000 to $74,999 | 11 (23.9%) | 9 (14.1%) |
| $75,000 to $99,999 | 3 (6.5%) | 8 (12.5%) |
| $100,000 to $149,999 | 7 (15.2%) | 15 (23.4%) |
| $150,000 or more | 5 (10.9%) | 16 (25.0%) |
| Total | 46 (100.0%) | 64 (100.0%) |
Property Value to Household Income Ratio in Apple River
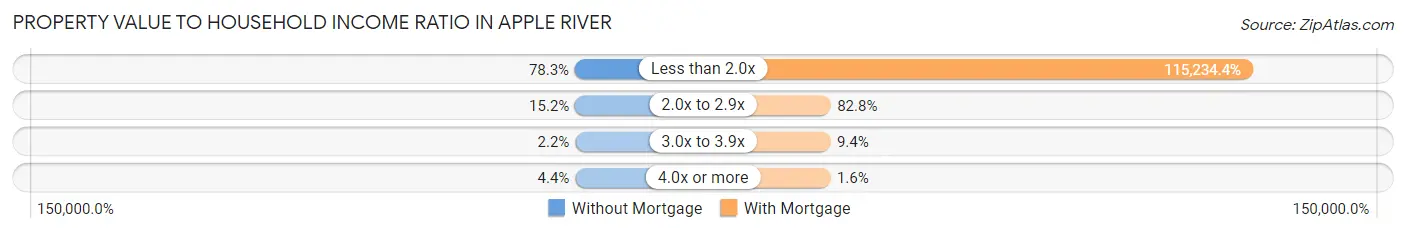
| Value-to-Income Ratio | Without Mortgage | With Mortgage |
| Less than 2.0x | 36 (78.3%) | 73,750 (115,234.4%) |
| 2.0x to 2.9x | 7 (15.2%) | 53 (82.8%) |
| 3.0x to 3.9x | 1 (2.2%) | 6 (9.4%) |
| 4.0x or more | 2 (4.3%) | 1 (1.6%) |
| Total | 46 (100.0%) | 64 (100.0%) |
Real Estate Taxes by Mortgage Status in Apple River
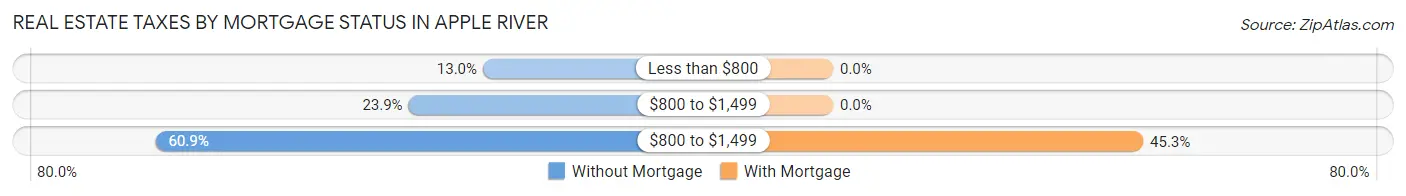
| Property Taxes | Without Mortgage | With Mortgage |
| Less than $800 | 6 (13.0%) | 0 (0.0%) |
| $800 to $1,499 | 11 (23.9%) | 0 (0.0%) |
| $800 to $1,499 | 28 (60.9%) | 29 (45.3%) |
| Total | 46 (100.0%) | 64 (100.0%) |
Health & Disability in Apple River
Health Insurance Coverage by Age in Apple River
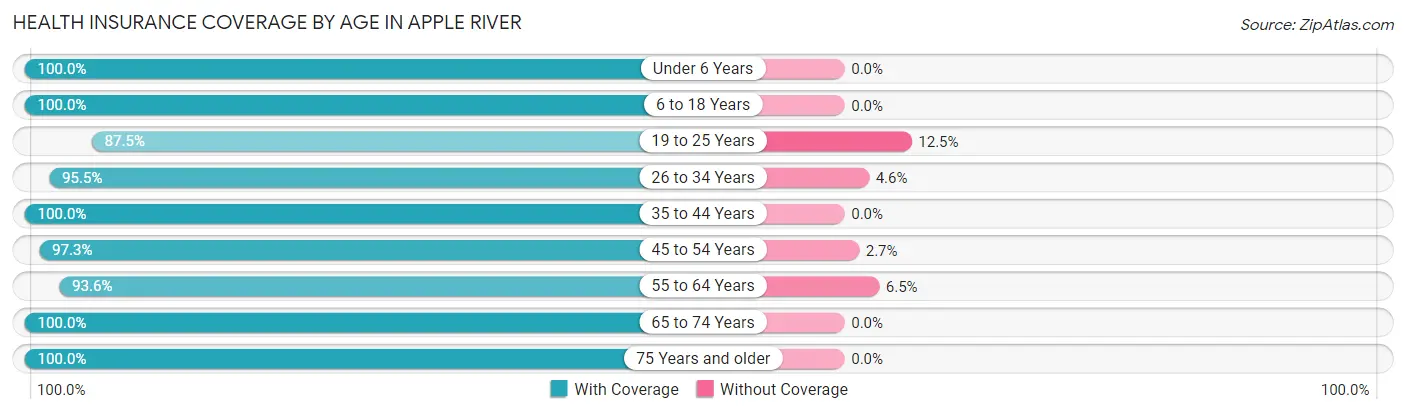
| Age Bracket | With Coverage | Without Coverage |
| Under 6 Years | 23 (100.0%) | 0 (0.0%) |
| 6 to 18 Years | 79 (100.0%) | 0 (0.0%) |
| 19 to 25 Years | 28 (87.5%) | 4 (12.5%) |
| 26 to 34 Years | 42 (95.5%) | 2 (4.5%) |
| 35 to 44 Years | 19 (100.0%) | 0 (0.0%) |
| 45 to 54 Years | 72 (97.3%) | 2 (2.7%) |
| 55 to 64 Years | 29 (93.5%) | 2 (6.5%) |
| 65 to 74 Years | 26 (100.0%) | 0 (0.0%) |
| 75 Years and older | 22 (100.0%) | 0 (0.0%) |
| Total | 340 (97.1%) | 10 (2.9%) |
Health Insurance Coverage by Citizenship Status in Apple River
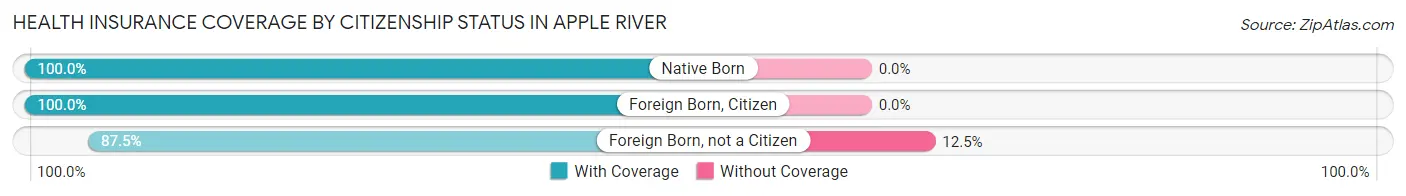
| Citizenship Status | With Coverage | Without Coverage |
| Native Born | 23 (100.0%) | 0 (0.0%) |
| Foreign Born, Citizen | 79 (100.0%) | 0 (0.0%) |
| Foreign Born, not a Citizen | 28 (87.5%) | 4 (12.5%) |
Health Insurance Coverage by Household Income in Apple River
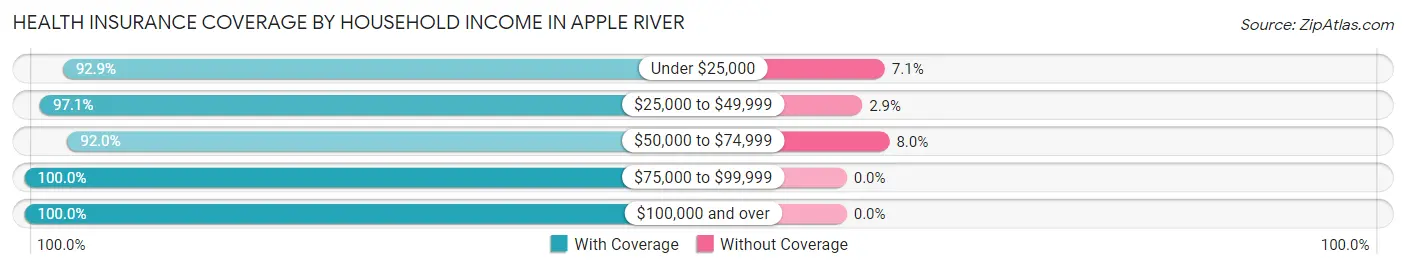
| Household Income | With Coverage | Without Coverage |
| Under $25,000 | 26 (92.9%) | 2 (7.1%) |
| $25,000 to $49,999 | 134 (97.1%) | 4 (2.9%) |
| $50,000 to $74,999 | 46 (92.0%) | 4 (8.0%) |
| $75,000 to $99,999 | 67 (100.0%) | 0 (0.0%) |
| $100,000 and over | 67 (100.0%) | 0 (0.0%) |
Public vs Private Health Insurance Coverage by Age in Apple River
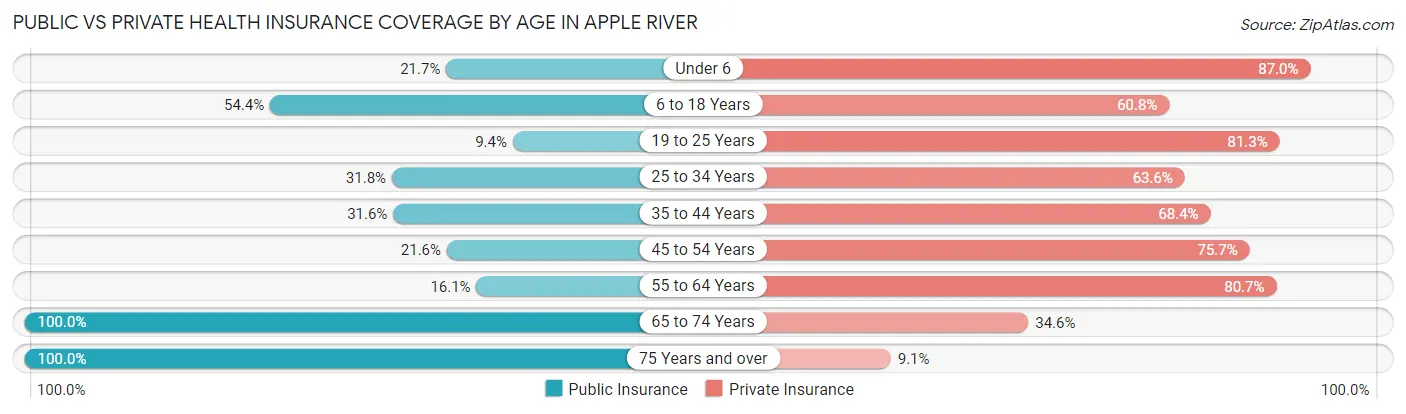
| Age Bracket | Public Insurance | Private Insurance |
| Under 6 | 5 (21.7%) | 20 (87.0%) |
| 6 to 18 Years | 43 (54.4%) | 48 (60.8%) |
| 19 to 25 Years | 3 (9.4%) | 26 (81.2%) |
| 25 to 34 Years | 14 (31.8%) | 28 (63.6%) |
| 35 to 44 Years | 6 (31.6%) | 13 (68.4%) |
| 45 to 54 Years | 16 (21.6%) | 56 (75.7%) |
| 55 to 64 Years | 5 (16.1%) | 25 (80.6%) |
| 65 to 74 Years | 26 (100.0%) | 9 (34.6%) |
| 75 Years and over | 22 (100.0%) | 2 (9.1%) |
| Total | 140 (40.0%) | 227 (64.9%) |
Disability Status by Sex by Age in Apple River
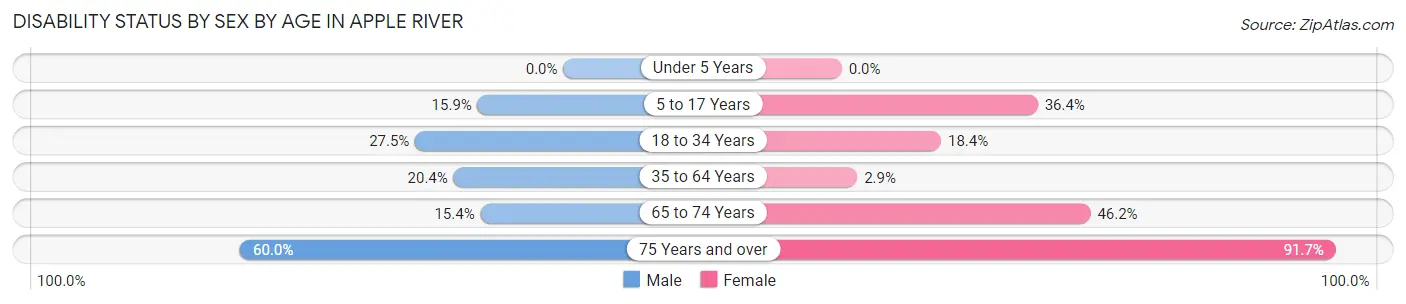
| Age Bracket | Male | Female |
| Under 5 Years | 0 (0.0%) | 0 (0.0%) |
| 5 to 17 Years | 7 (15.9%) | 12 (36.4%) |
| 18 to 34 Years | 11 (27.5%) | 7 (18.4%) |
| 35 to 64 Years | 11 (20.4%) | 2 (2.9%) |
| 65 to 74 Years | 2 (15.4%) | 6 (46.2%) |
| 75 Years and over | 6 (60.0%) | 11 (91.7%) |
Disability Class by Sex by Age in Apple River
Disability Class: Hearing Difficulty
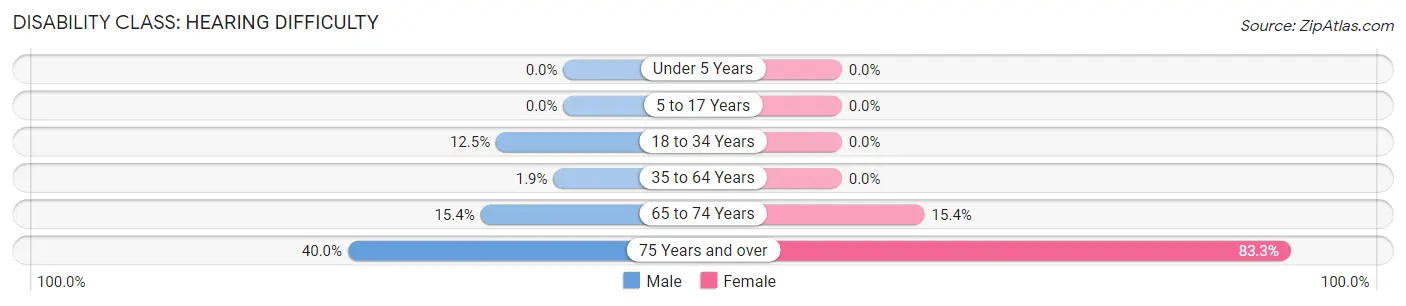
| Age Bracket | Male | Female |
| Under 5 Years | 0 (0.0%) | 0 (0.0%) |
| 5 to 17 Years | 0 (0.0%) | 0 (0.0%) |
| 18 to 34 Years | 5 (12.5%) | 0 (0.0%) |
| 35 to 64 Years | 1 (1.8%) | 0 (0.0%) |
| 65 to 74 Years | 2 (15.4%) | 2 (15.4%) |
| 75 Years and over | 4 (40.0%) | 10 (83.3%) |
Disability Class: Vision Difficulty
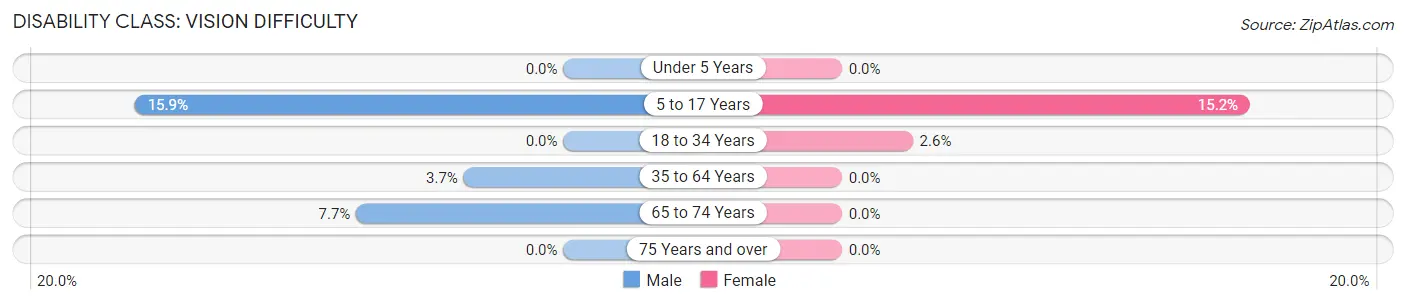
| Age Bracket | Male | Female |
| Under 5 Years | 0 (0.0%) | 0 (0.0%) |
| 5 to 17 Years | 7 (15.9%) | 5 (15.1%) |
| 18 to 34 Years | 0 (0.0%) | 1 (2.6%) |
| 35 to 64 Years | 2 (3.7%) | 0 (0.0%) |
| 65 to 74 Years | 1 (7.7%) | 0 (0.0%) |
| 75 Years and over | 0 (0.0%) | 0 (0.0%) |
Disability Class: Cognitive Difficulty
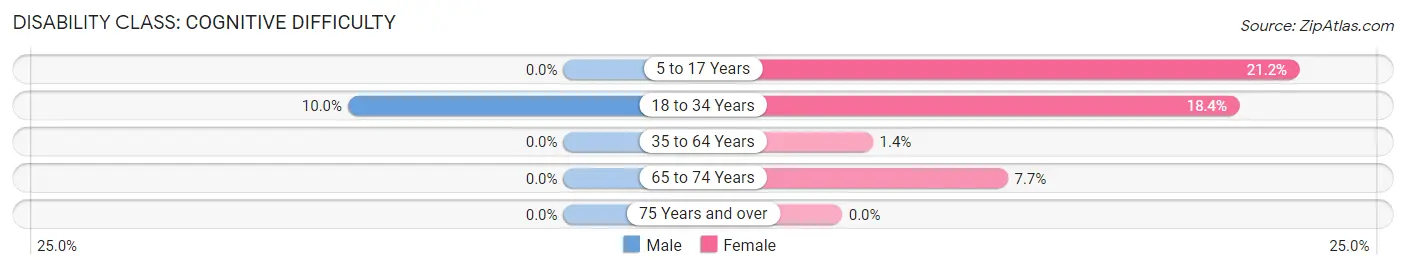
| Age Bracket | Male | Female |
| 5 to 17 Years | 0 (0.0%) | 7 (21.2%) |
| 18 to 34 Years | 4 (10.0%) | 7 (18.4%) |
| 35 to 64 Years | 0 (0.0%) | 1 (1.4%) |
| 65 to 74 Years | 0 (0.0%) | 1 (7.7%) |
| 75 Years and over | 0 (0.0%) | 0 (0.0%) |
Disability Class: Ambulatory Difficulty
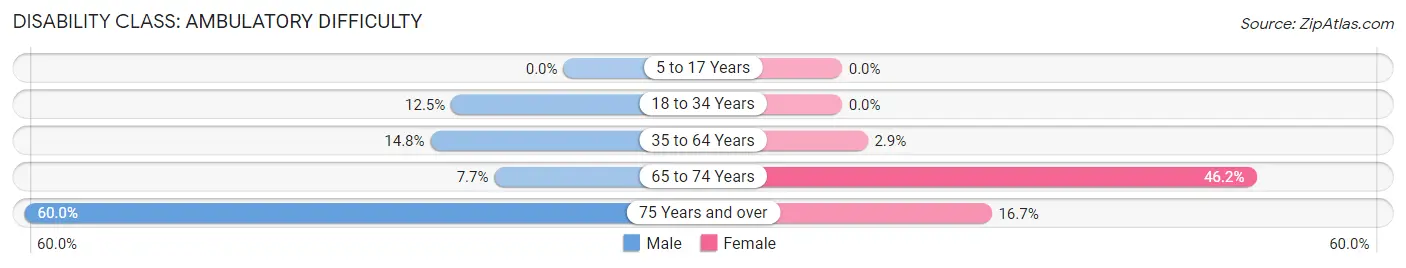
| Age Bracket | Male | Female |
| 5 to 17 Years | 0 (0.0%) | 0 (0.0%) |
| 18 to 34 Years | 5 (12.5%) | 0 (0.0%) |
| 35 to 64 Years | 8 (14.8%) | 2 (2.9%) |
| 65 to 74 Years | 1 (7.7%) | 6 (46.2%) |
| 75 Years and over | 6 (60.0%) | 2 (16.7%) |
Disability Class: Self-Care Difficulty
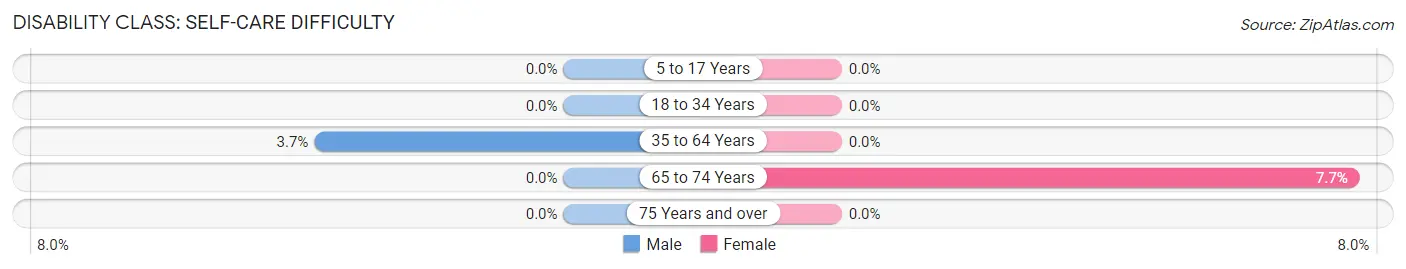
| Age Bracket | Male | Female |
| 5 to 17 Years | 0 (0.0%) | 0 (0.0%) |
| 18 to 34 Years | 0 (0.0%) | 0 (0.0%) |
| 35 to 64 Years | 2 (3.7%) | 0 (0.0%) |
| 65 to 74 Years | 0 (0.0%) | 1 (7.7%) |
| 75 Years and over | 0 (0.0%) | 0 (0.0%) |
Technology Access in Apple River
Computing Device Access in Apple River
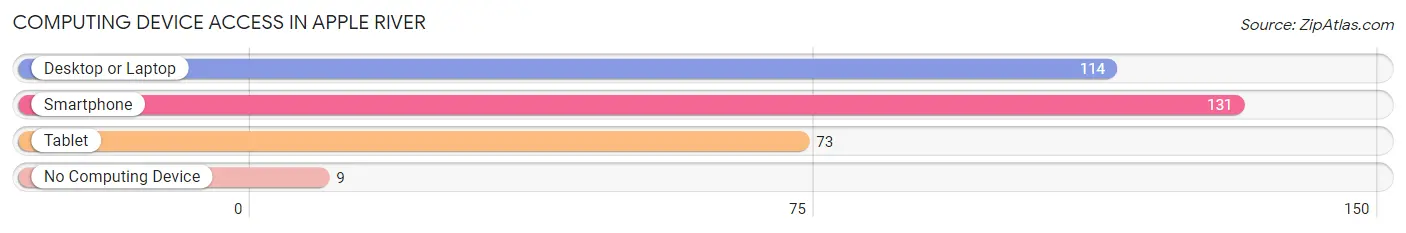
| Device Type | # Households | % Households |
| Desktop or Laptop | 114 | 74.5% |
| Smartphone | 131 | 85.6% |
| Tablet | 73 | 47.7% |
| No Computing Device | 9 | 5.9% |
| Total | 153 | 100.0% |
Internet Access in Apple River
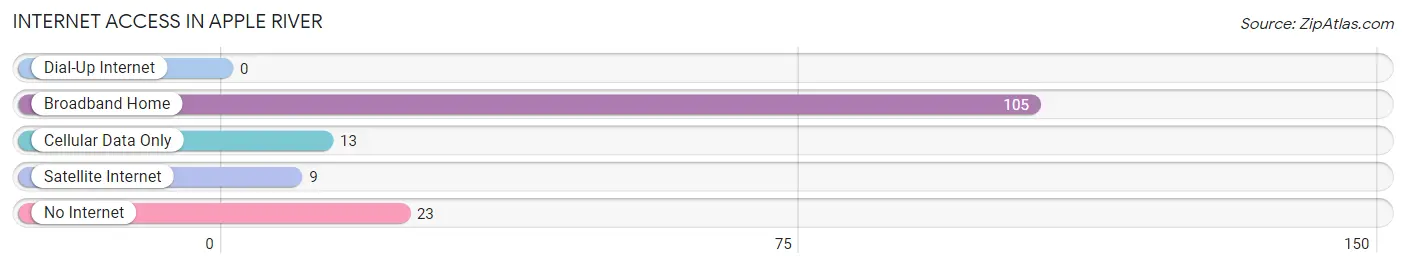
| Internet Type | # Households | % Households |
| Dial-Up Internet | 0 | 0.0% |
| Broadband Home | 105 | 68.6% |
| Cellular Data Only | 13 | 8.5% |
| Satellite Internet | 9 | 5.9% |
| No Internet | 23 | 15.0% |
| Total | 153 | 100.0% |
Apple River Summary
Apple River is a small village located in Jo Daviess County, Illinois. It is situated in the northwest corner of the state, near the Wisconsin border. The village has a population of approximately 1,000 people and is part of the Galena Micropolitan Statistical Area.
History
Apple River was first settled in 1827 by a group of settlers from New York. The village was originally known as Apple River Settlement, and was later renamed Apple River. The village was incorporated in 1856.
The village was an important stop on the stagecoach route between Galena and Dubuque, Iowa. The stagecoach route was used by settlers and miners traveling to the lead mines in the area.
The village was also an important stop on the Chicago and Northwestern Railroad, which ran through the village from 1855 to 1971. The railroad was an important factor in the growth of the village, as it allowed for the transportation of goods and people.
Geography
Apple River is located in the northwest corner of Illinois, near the Wisconsin border. The village is situated in Jo Daviess County, and is part of the Galena Micropolitan Statistical Area.
The village is located on the Apple River, which is a tributary of the Mississippi River. The river is a popular destination for fishing, canoeing, and kayaking.
The village is located in a rural area, and is surrounded by rolling hills and farmland. The village is located approximately 25 miles from Galena, and approximately 50 miles from Dubuque, Iowa.
Economy
The economy of Apple River is largely based on agriculture and tourism. The village is home to several small businesses, including restaurants, shops, and a bed and breakfast.
The village is also home to several wineries, which produce a variety of wines. The wineries are popular destinations for tourists, and attract visitors from all over the region.
The village is also home to several farms, which produce a variety of crops, including corn, soybeans, and hay. The farms are an important part of the local economy, and provide employment for many of the village’s residents.
Demographics
As of the 2010 census, the population of Apple River was 1,000. The population is largely white (97.2%), with a small percentage of African Americans (1.2%) and Hispanics (1.6%).
The median household income in the village is $45,000, and the median home value is $125,000. The village has a low unemployment rate (3.2%), and a high rate of homeownership (83.3%).
Conclusion
Apple River is a small village located in Jo Daviess County, Illinois. The village has a population of approximately 1,000 people and is part of the Galena Micropolitan Statistical Area. The village was first settled in 1827, and was an important stop on the stagecoach route between Galena and Dubuque, Iowa. The village is also home to several wineries, farms, and small businesses. The economy of the village is largely based on agriculture and tourism. The population of the village is largely white, with a small percentage of African Americans and Hispanics. The median household income in the village is $45,000, and the median home value is $125,000.
Common Questions
What is Per Capita Income in Apple River?
Per Capita income in Apple River is $25,565.
What is the Median Family Income in Apple River?
Median Family Income in Apple River is $51,667.
What is the Median Household income in Apple River?
Median Household Income in Apple River is $50,208.
What is Income or Wage Gap in Apple River?
Income or Wage Gap in Apple River is 6.6%.
Women in Apple River earn 93.4 cents for every dollar earned by a man.
What is Inequality or Gini Index in Apple River?
Inequality or Gini Index in Apple River is 0.37.
What is the Total Population of Apple River?
Total Population of Apple River is 350.
What is the Total Male Population of Apple River?
Total Male Population of Apple River is 172.
What is the Total Female Population of Apple River?
Total Female Population of Apple River is 178.
What is the Ratio of Males per 100 Females in Apple River?
There are 96.63 Males per 100 Females in Apple River.
What is the Ratio of Females per 100 Males in Apple River?
There are 103.49 Females per 100 Males in Apple River.
What is the Median Population Age in Apple River?
Median Population Age in Apple River is 33.6 Years.
What is the Average Family Size in Apple River
Average Family Size in Apple River is 2.6 People.
What is the Average Household Size in Apple River
Average Household Size in Apple River is 2.3 People.
How Large is the Labor Force in Apple River?
There are 170 People in the Labor Forcein in Apple River.
What is the Percentage of People in the Labor Force in Apple River?
64.9% of People are in the Labor Force in Apple River.
What is the Unemployment Rate in Apple River?
Unemployment Rate in Apple River is 1.8%.