West York, IL Map & Demographics
West York Map
West York Overview
$27,156
PER CAPITA INCOME
$99,000
AVG FAMILY INCOME
0.45
INEQUALITY / GINI INDEX
133
TOTAL POPULATION
29
MALE POPULATION
104
FEMALE POPULATION
27.88
MALES / 100 FEMALES
358.62
FEMALES / 100 MALES
25.6
MEDIAN AGE
3.5
AVG FAMILY SIZE
2.3
AVG HOUSEHOLD SIZE
91
LABOR FORCE [ PEOPLE ]
73.4%
PERCENT IN LABOR FORCE
West York Zip Codes
West York Area Codes
Income in West York
Income Overview in West York
| Characteristic | Number | Measure |
| Per Capita Income | 133 | $27,156 |
| Median Family Income | 30 | $99,000 |
| Mean Family Income | 30 | $112,973 |
| Median Household Income | 58 | $0 |
| Mean Household Income | 58 | $64,929 |
| Income Deficit | 30 | $0 |
| Wage / Income Gap (%) | 133 | 0.00% |
| Wage / Income Gap ($) | 133 | 100.00¢ per $1 |
| Gini / Inequality Index | 133 | 0.45 |
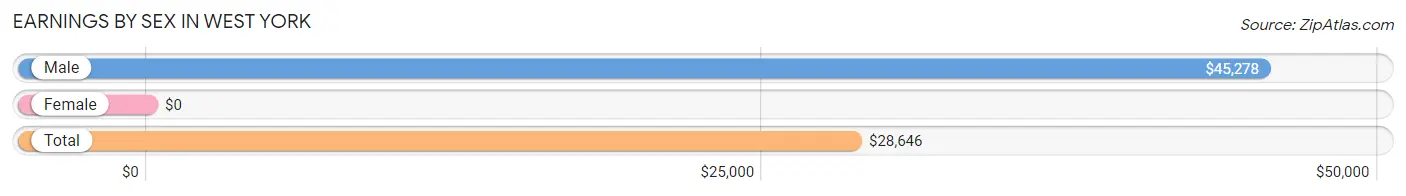
Earnings by Sex in West York
| Sex | Number | Average Earnings |
| Male | 26 (28.6%) | $45,278 |
| Female | 65 (71.4%) | $0 |
| Total | 91 (100.0%) | $28,646 |
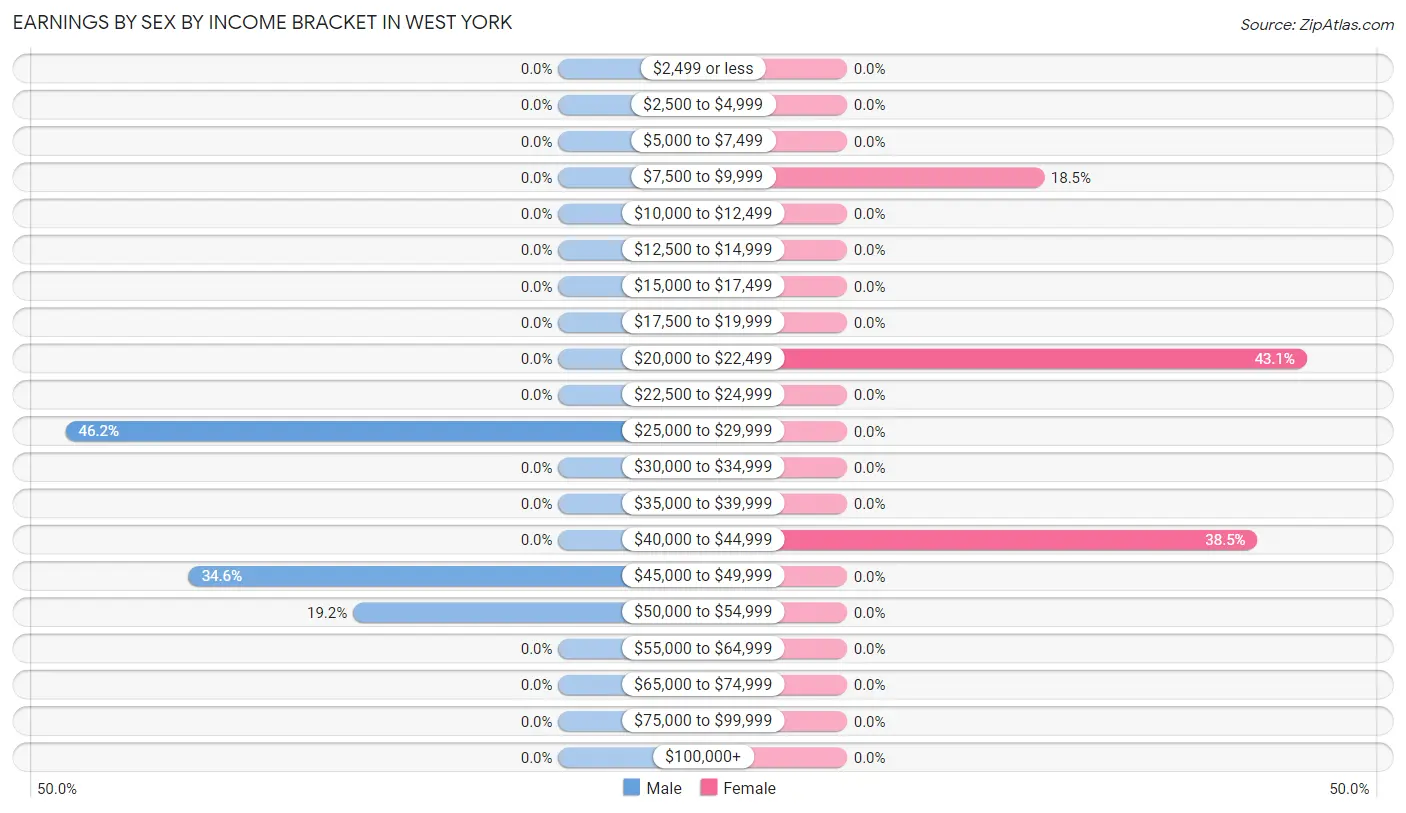
Earnings by Sex by Income Bracket in West York
The most common earnings brackets in West York are $25,000 to $29,999 for men (12 | 46.2%) and $20,000 to $22,499 for women (28 | 43.1%).
| Income | Male | Female |
| $2,499 or less | 0 (0.0%) | 0 (0.0%) |
| $2,500 to $4,999 | 0 (0.0%) | 0 (0.0%) |
| $5,000 to $7,499 | 0 (0.0%) | 0 (0.0%) |
| $7,500 to $9,999 | 0 (0.0%) | 12 (18.5%) |
| $10,000 to $12,499 | 0 (0.0%) | 0 (0.0%) |
| $12,500 to $14,999 | 0 (0.0%) | 0 (0.0%) |
| $15,000 to $17,499 | 0 (0.0%) | 0 (0.0%) |
| $17,500 to $19,999 | 0 (0.0%) | 0 (0.0%) |
| $20,000 to $22,499 | 0 (0.0%) | 28 (43.1%) |
| $22,500 to $24,999 | 0 (0.0%) | 0 (0.0%) |
| $25,000 to $29,999 | 12 (46.2%) | 0 (0.0%) |
| $30,000 to $34,999 | 0 (0.0%) | 0 (0.0%) |
| $35,000 to $39,999 | 0 (0.0%) | 0 (0.0%) |
| $40,000 to $44,999 | 0 (0.0%) | 25 (38.5%) |
| $45,000 to $49,999 | 9 (34.6%) | 0 (0.0%) |
| $50,000 to $54,999 | 5 (19.2%) | 0 (0.0%) |
| $55,000 to $64,999 | 0 (0.0%) | 0 (0.0%) |
| $65,000 to $74,999 | 0 (0.0%) | 0 (0.0%) |
| $75,000 to $99,999 | 0 (0.0%) | 0 (0.0%) |
| $100,000+ | 0 (0.0%) | 0 (0.0%) |
| Total | 26 (100.0%) | 65 (100.0%) |
Earnings by Sex by Educational Attainment in West York
| Educational Attainment | Male Income | Female Income |
| Less than High School | - | - |
| High School Diploma | - | - |
| College or Associate's Degree | - | - |
| Bachelor's Degree | - | - |
| Graduate Degree | - | - |
| Total | $45,278 | $0 |
Family Income in West York
Family Income Brackets in West York
According to the West York family income data, there are 17 families falling into the $75,000 to $99,999 income range, which is the most common income bracket and makes up 56.7% of all families.
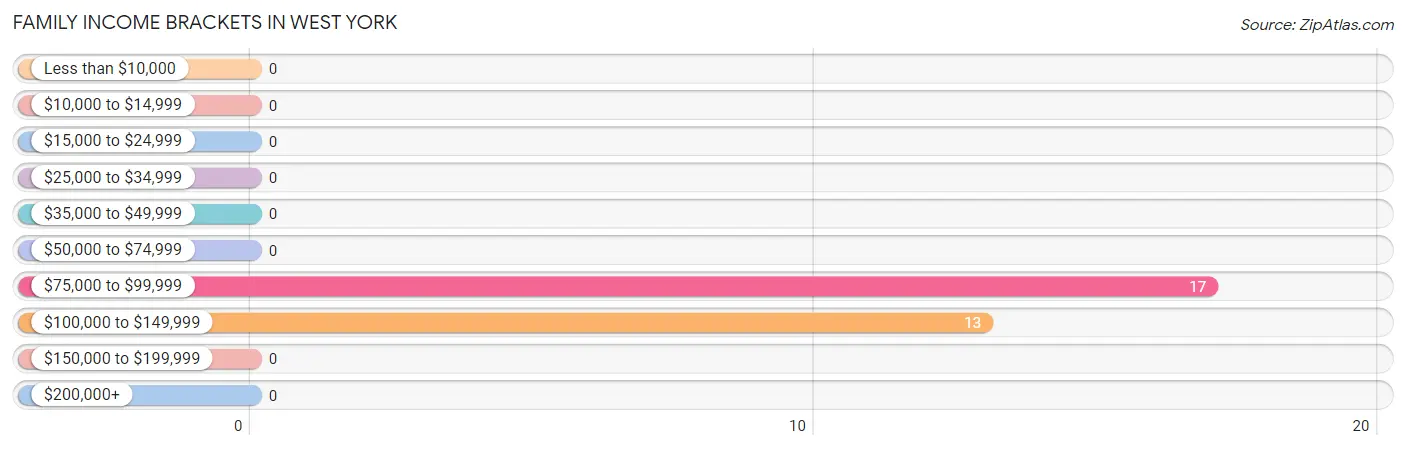
| Income Bracket | # Families | % Families |
| Less than $10,000 | 0 | 0.0% |
| $10,000 to $14,999 | 0 | 0.0% |
| $15,000 to $24,999 | 0 | 0.0% |
| $25,000 to $34,999 | 0 | 0.0% |
| $35,000 to $49,999 | 0 | 0.0% |
| $50,000 to $74,999 | 0 | 0.0% |
| $75,000 to $99,999 | 17 | 56.7% |
| $100,000 to $149,999 | 13 | 43.3% |
| $150,000 to $199,999 | 0 | 0.0% |
| $200,000+ | 0 | 0.0% |
Family Income by Famaliy Size in West York
| Income Bracket | # Families | Median Income |
| 2-Person Families | 12 (40.0%) | $0 |
| 3-Person Families | 0 (0.0%) | $0 |
| 4-Person Families | 5 (16.7%) | $0 |
| 5-Person Families | 13 (43.3%) | $0 |
| 6-Person Families | 0 (0.0%) | $0 |
| 7+ Person Families | 0 (0.0%) | $0 |
| Total | 30 (100.0%) | $99,000 |
Family Income by Number of Earners in West York
| Number of Earners | # Families | Median Income |
| No Earners | 0 (0.0%) | $0 |
| 1 Earner | 5 (16.7%) | $0 |
| 2 Earners | 12 (40.0%) | $0 |
| 3+ Earners | 13 (43.3%) | $0 |
| Total | 30 (100.0%) | $99,000 |
Household Income in West York
Household Income Brackets in West York
With 18 households falling in the category, the $10,000 to $14,999 income range is the most frequent in West York, accounting for 31.0% of all households.
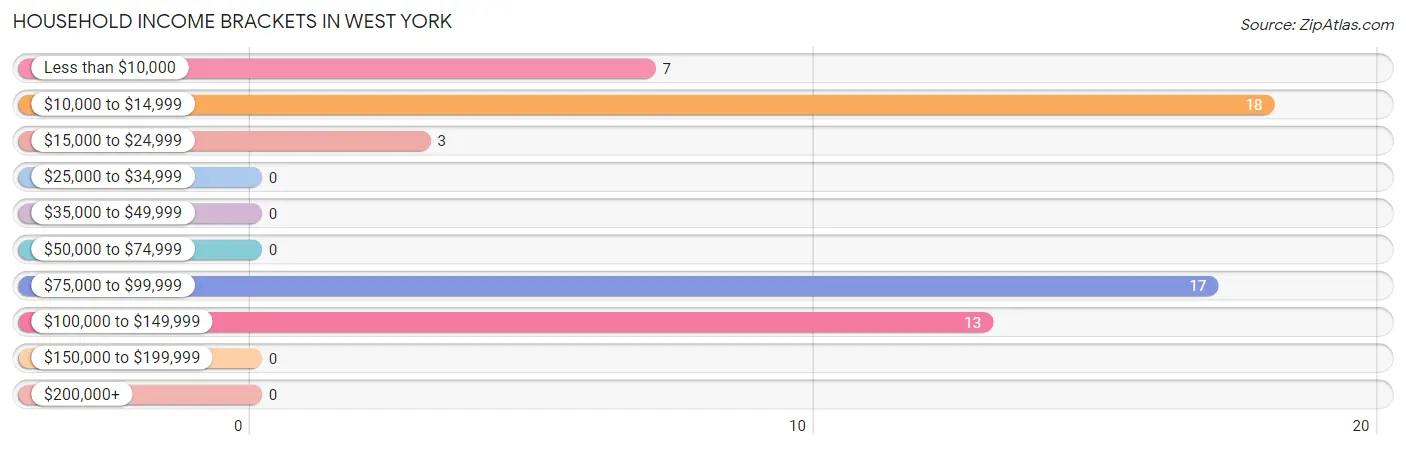
| Income Bracket | # Households | % Households |
| Less than $10,000 | 7 | 12.1% |
| $10,000 to $14,999 | 18 | 31.0% |
| $15,000 to $24,999 | 3 | 5.2% |
| $25,000 to $34,999 | 0 | 0.0% |
| $35,000 to $49,999 | 0 | 0.0% |
| $50,000 to $74,999 | 0 | 0.0% |
| $75,000 to $99,999 | 17 | 29.3% |
| $100,000 to $149,999 | 13 | 22.4% |
| $150,000 to $199,999 | 0 | 0.0% |
| $200,000+ | 0 | 0.0% |
Household Income by Householder Age in West York
The median household income in West York is $0, with the highest median household income of $13,819 found in the 45 to 64 years age bracket for the primary householder. A total of 33 households (56.9%) fall into this category. Meanwhile, the 15 to 24 years age bracket for the primary householder has the lowest median household income of $0, with 12 households (20.7%) in this group.
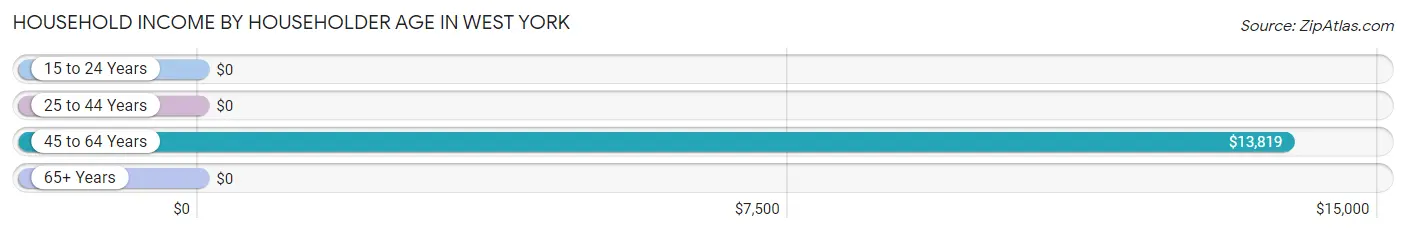
| Income Bracket | # Households | Median Income |
| 15 to 24 Years | 12 (20.7%) | $0 |
| 25 to 44 Years | 13 (22.4%) | $0 |
| 45 to 64 Years | 33 (56.9%) | $13,819 |
| 65+ Years | 0 (0.0%) | $0 |
| Total | 58 (100.0%) | $0 |
Poverty in West York
Income Below Poverty by Sex and Age in West York
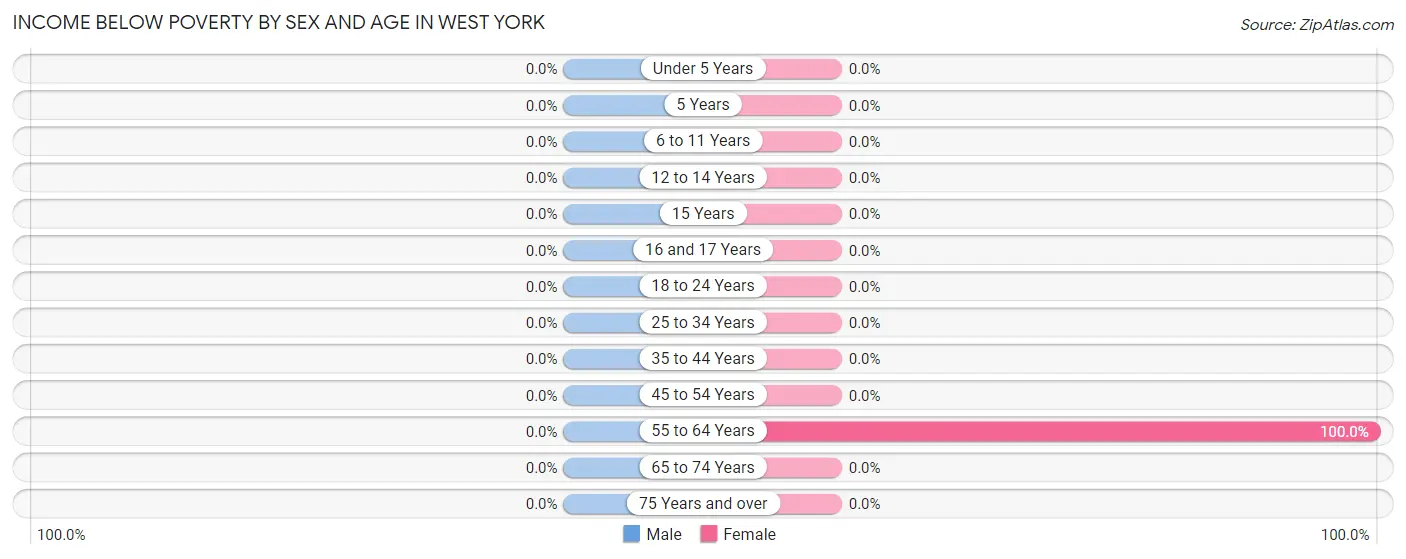
| Age Bracket | Male | Female |
| Under 5 Years | 0 (0.0%) | 0 (0.0%) |
| 5 Years | 0 (0.0%) | 0 (0.0%) |
| 6 to 11 Years | 0 (0.0%) | 0 (0.0%) |
| 12 to 14 Years | 0 (0.0%) | 0 (0.0%) |
| 15 Years | 0 (0.0%) | 0 (0.0%) |
| 16 and 17 Years | 0 (0.0%) | 0 (0.0%) |
| 18 to 24 Years | 0 (0.0%) | 0 (0.0%) |
| 25 to 34 Years | 0 (0.0%) | 0 (0.0%) |
| 35 to 44 Years | 0 (0.0%) | 0 (0.0%) |
| 45 to 54 Years | 0 (0.0%) | 0 (0.0%) |
| 55 to 64 Years | 0 (0.0%) | 25 (100.0%) |
| 65 to 74 Years | 0 (0.0%) | 0 (0.0%) |
| 75 Years and over | 0 (0.0%) | 0 (0.0%) |
| Total | 0 (0.0%) | 25 (24.0%) |
Income Above Poverty by Sex and Age in West York
According to the poverty statistics in West York, males aged 25 to 34 years and females aged 6 to 11 years are the age groups that are most secure financially, with 100.0% of males and 100.0% of females in these age groups living above the poverty line.
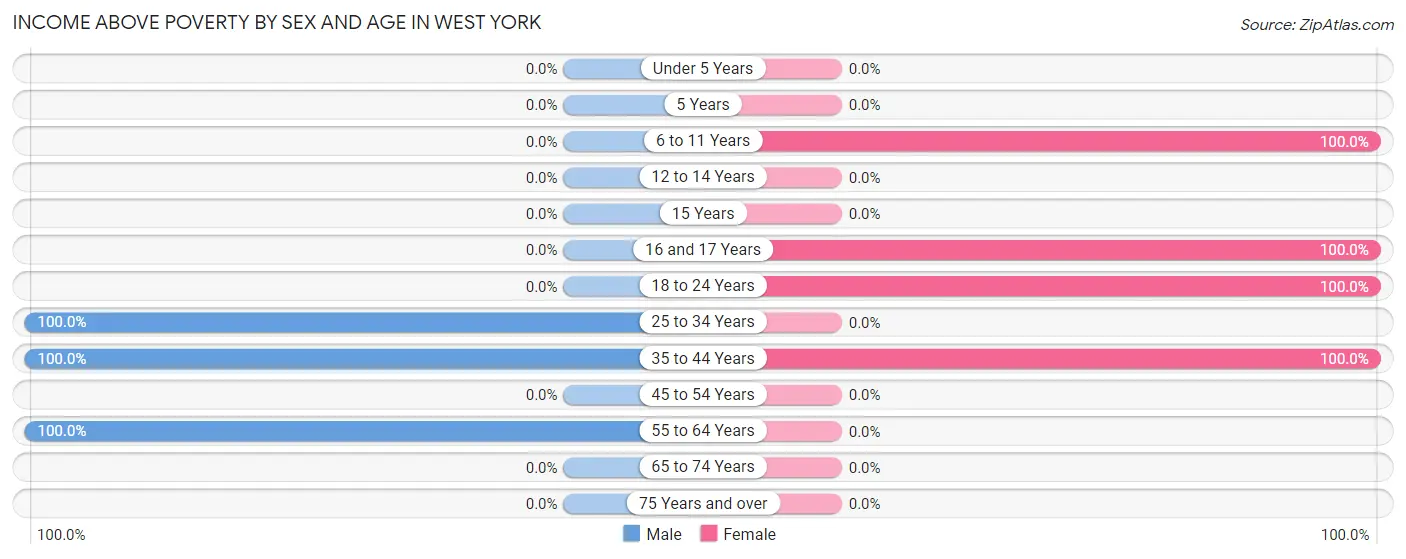
| Age Bracket | Male | Female |
| Under 5 Years | 0 (0.0%) | 0 (0.0%) |
| 5 Years | 0 (0.0%) | 0 (0.0%) |
| 6 to 11 Years | 0 (0.0%) | 9 (100.0%) |
| 12 to 14 Years | 0 (0.0%) | 0 (0.0%) |
| 15 Years | 0 (0.0%) | 0 (0.0%) |
| 16 and 17 Years | 0 (0.0%) | 12 (100.0%) |
| 18 to 24 Years | 0 (0.0%) | 40 (100.0%) |
| 25 to 34 Years | 9 (100.0%) | 0 (0.0%) |
| 35 to 44 Years | 12 (100.0%) | 18 (100.0%) |
| 45 to 54 Years | 0 (0.0%) | 0 (0.0%) |
| 55 to 64 Years | 8 (100.0%) | 0 (0.0%) |
| 65 to 74 Years | 0 (0.0%) | 0 (0.0%) |
| 75 Years and over | 0 (0.0%) | 0 (0.0%) |
| Total | 29 (100.0%) | 79 (76.0%) |
Income Below Poverty Among Married-Couple Families in West York
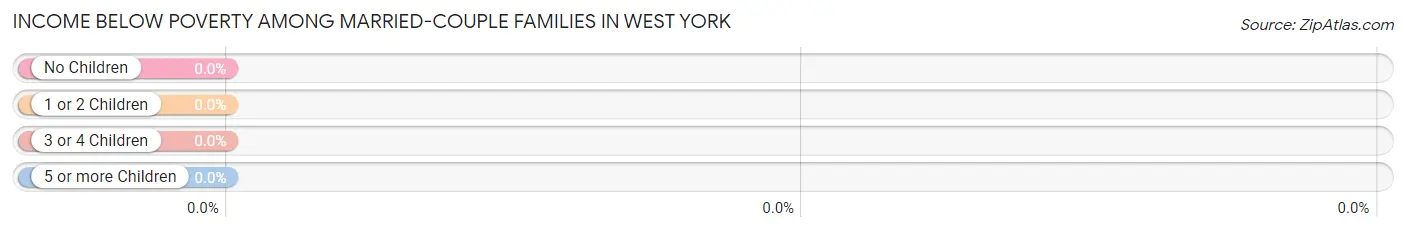
| Children | Above Poverty | Below Poverty |
| No Children | 12 (100.0%) | 0 (0.0%) |
| 1 or 2 Children | 18 (100.0%) | 0 (0.0%) |
| 3 or 4 Children | 0 (0.0%) | 0 (0.0%) |
| 5 or more Children | 0 (0.0%) | 0 (0.0%) |
| Total | 30 (100.0%) | 0 (0.0%) |
Income Below Poverty Among Single-Parent Households in West York
| Children | Single Father | Single Mother |
| No Children | 0 (0.0%) | 0 (0.0%) |
| 1 or 2 Children | 0 (0.0%) | 0 (0.0%) |
| 3 or 4 Children | 0 (0.0%) | 0 (0.0%) |
| 5 or more Children | 0 (0.0%) | 0 (0.0%) |
| Total | 0 (0.0%) | 0 (0.0%) |
Income Below Poverty Among Married-Couple vs Single-Parent Households in West York
| Children | Married-Couple Families | Single-Parent Households |
| No Children | 0 (0.0%) | 0 (0.0%) |
| 1 or 2 Children | 0 (0.0%) | 0 (0.0%) |
| 3 or 4 Children | 0 (0.0%) | 0 (0.0%) |
| 5 or more Children | 0 (0.0%) | 0 (0.0%) |
| Total | 0 (0.0%) | 0 (0.0%) |
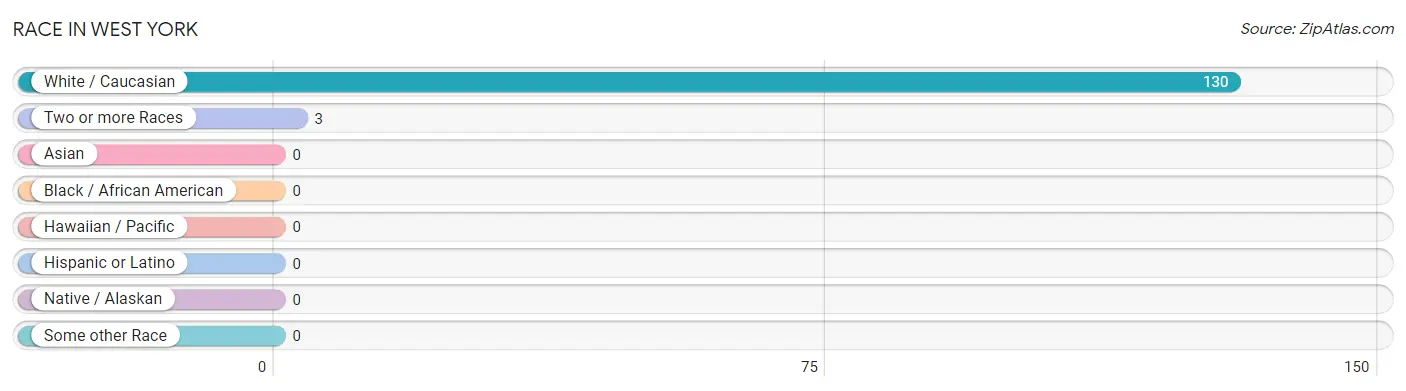
Race in West York
The most populous races in West York are White / Caucasian (130 | 97.7%), and Two or more Races (3 | 2.3%).
| Race | # Population | % Population |
| Asian | 0 | 0.0% |
| Black / African American | 0 | 0.0% |
| Hawaiian / Pacific | 0 | 0.0% |
| Hispanic or Latino | 0 | 0.0% |
| Native / Alaskan | 0 | 0.0% |
| White / Caucasian | 130 | 97.7% |
| Two or more Races | 3 | 2.3% |
| Some other Race | 0 | 0.0% |
| Total | 133 | 100.0% |
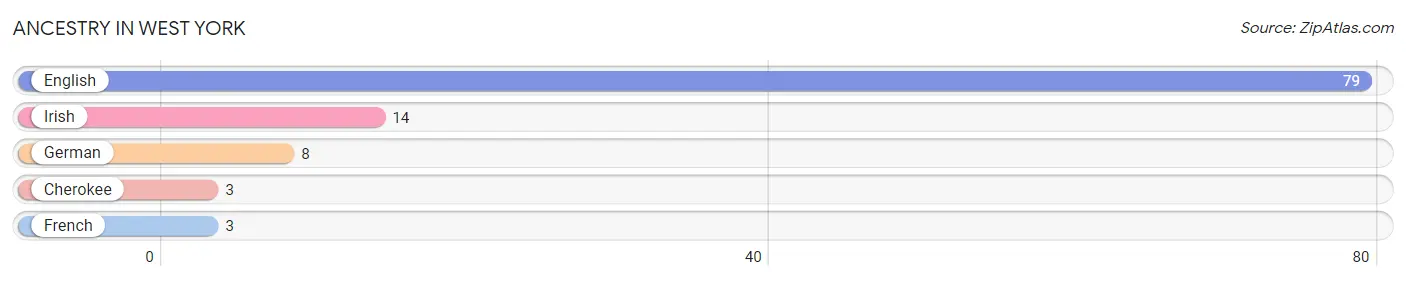
Ancestry in West York
The most populous ancestries reported in West York are English (79 | 59.4%), Irish (14 | 10.5%), German (8 | 6.0%), Cherokee (3 | 2.3%), and French (3 | 2.3%), together accounting for 80.5% of all West York residents.
| Ancestry | # Population | % Population |
| Cherokee | 3 | 2.3% |
| English | 79 | 59.4% |
| French | 3 | 2.3% |
| German | 8 | 6.0% |
| Irish | 14 | 10.5% | View All 5 Rows |
Immigrants in West York

| Immigration Origin | # Population | % Population | View All 0 Rows |
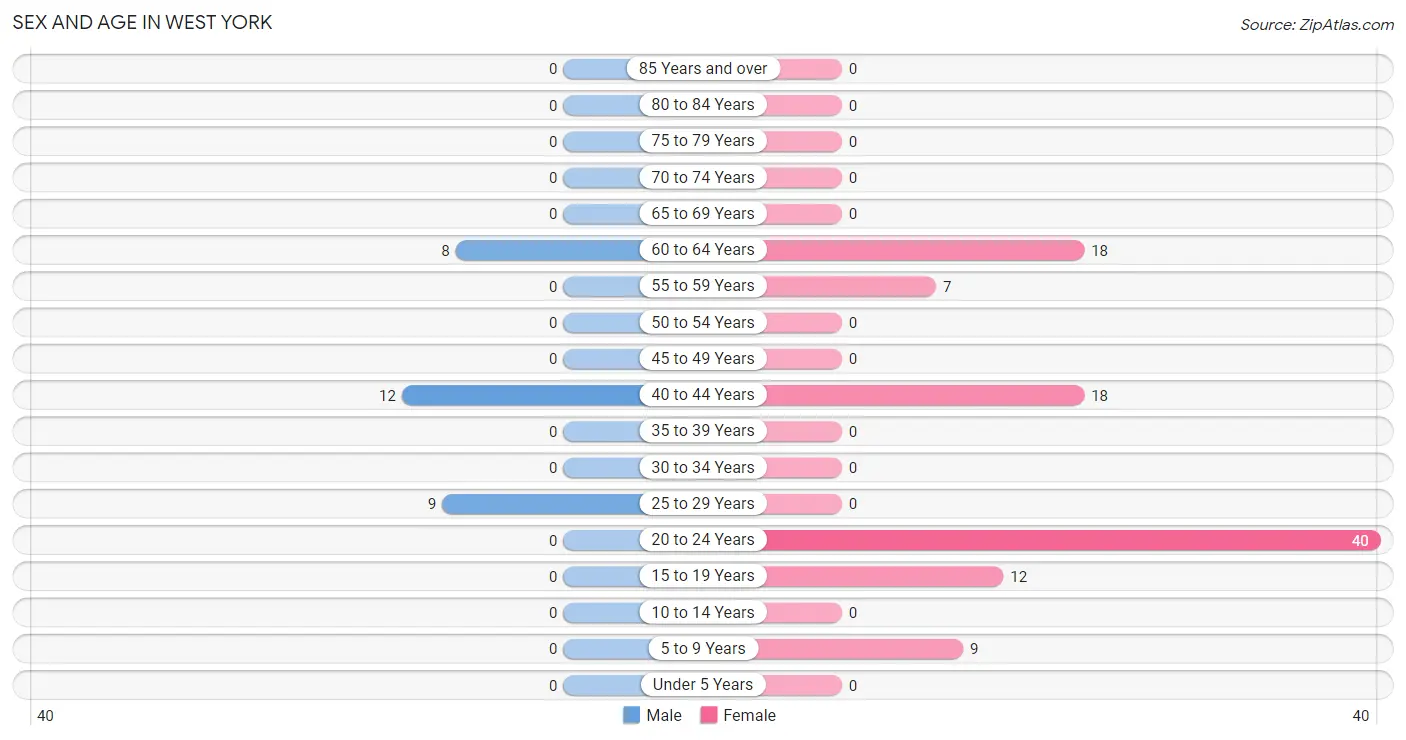
Sex and Age in West York
Sex and Age in West York
The most populous age groups in West York are 40 to 44 Years (12 | 41.4%) for men and 20 to 24 Years (40 | 38.5%) for women.
| Age Bracket | Male | Female |
| Under 5 Years | 0 (0.0%) | 0 (0.0%) |
| 5 to 9 Years | 0 (0.0%) | 9 (8.6%) |
| 10 to 14 Years | 0 (0.0%) | 0 (0.0%) |
| 15 to 19 Years | 0 (0.0%) | 12 (11.5%) |
| 20 to 24 Years | 0 (0.0%) | 40 (38.5%) |
| 25 to 29 Years | 9 (31.0%) | 0 (0.0%) |
| 30 to 34 Years | 0 (0.0%) | 0 (0.0%) |
| 35 to 39 Years | 0 (0.0%) | 0 (0.0%) |
| 40 to 44 Years | 12 (41.4%) | 18 (17.3%) |
| 45 to 49 Years | 0 (0.0%) | 0 (0.0%) |
| 50 to 54 Years | 0 (0.0%) | 0 (0.0%) |
| 55 to 59 Years | 0 (0.0%) | 7 (6.7%) |
| 60 to 64 Years | 8 (27.6%) | 18 (17.3%) |
| 65 to 69 Years | 0 (0.0%) | 0 (0.0%) |
| 70 to 74 Years | 0 (0.0%) | 0 (0.0%) |
| 75 to 79 Years | 0 (0.0%) | 0 (0.0%) |
| 80 to 84 Years | 0 (0.0%) | 0 (0.0%) |
| 85 Years and over | 0 (0.0%) | 0 (0.0%) |
| Total | 29 (100.0%) | 104 (100.0%) |
Families and Households in West York
Median Family Size in West York
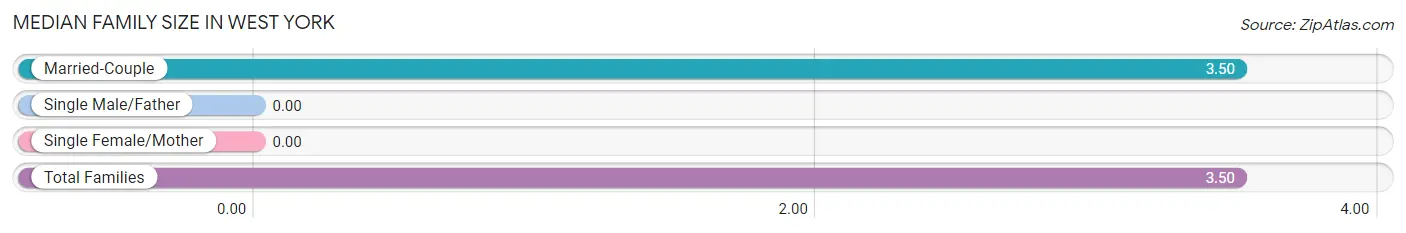
| Family Type | # Families | Family Size |
| Married-Couple | 30 (100.0%) | 3.50 |
| Single Male/Father | 0 (0.0%) | - |
| Single Female/Mother | 0 (0.0%) | - |
| Total Families | 30 (100.0%) | 3.50 |
Median Household Size in West York
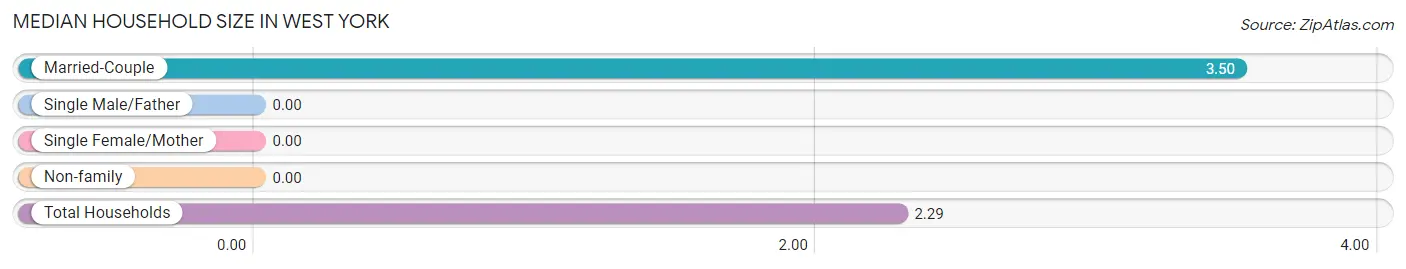
| Household Type | # Households | Household Size |
| Married-Couple | 30 (51.7%) | 3.50 |
| Single Male/Father | 0 (0.0%) | - |
| Single Female/Mother | 0 (0.0%) | - |
| Non-family | 28 (48.3%) | - |
| Total Households | 58 (100.0%) | 2.29 |
Household Size by Marriage Status in West York
Out of a total of 58 households in West York, 30 (51.7%) are family households, while 28 (48.3%) are nonfamily households. The most numerous type of family households are 5-person households, comprising 13, and the most common type of nonfamily households are 1-person households, comprising 28.
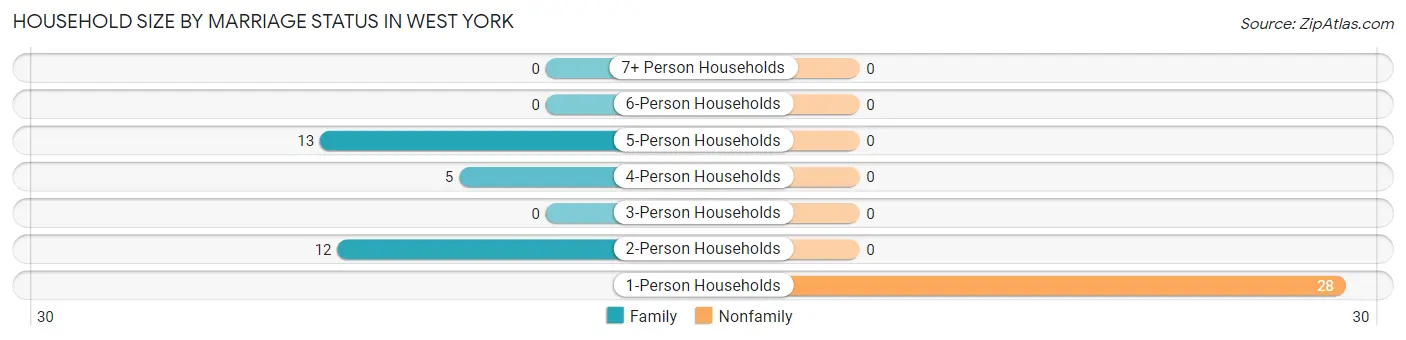
| Household Size | Family Households | Nonfamily Households |
| 1-Person Households | - | 28 (48.3%) |
| 2-Person Households | 12 (20.7%) | 0 (0.0%) |
| 3-Person Households | 0 (0.0%) | 0 (0.0%) |
| 4-Person Households | 5 (8.6%) | 0 (0.0%) |
| 5-Person Households | 13 (22.4%) | 0 (0.0%) |
| 6-Person Households | 0 (0.0%) | 0 (0.0%) |
| 7+ Person Households | 0 (0.0%) | 0 (0.0%) |
| Total | 30 (51.7%) | 28 (48.3%) |
Female Fertility in West York
Fertility by Age in West York
| Age Bracket | Women with Births | Births / 1,000 Women |
| 15 to 19 years | 0 (0.0%) | 0.0 |
| 20 to 34 years | 0 (0.0%) | 0.0 |
| 35 to 50 years | 0 (0.0%) | 0.0 |
| Total | 0 (0.0%) | 0.0 |
Fertility by Age by Marriage Status in West York
| Age Bracket | Married | Unmarried |
| 15 to 19 years | 0 (0.0%) | 0 (0.0%) |
| 20 to 34 years | 0 (0.0%) | 0 (0.0%) |
| 35 to 50 years | 0 (0.0%) | 0 (0.0%) |
| Total | 0 (0.0%) | 0 (0.0%) |
Fertility by Education in West York
| Educational Attainment | Women with Births | Births / 1,000 Women |
| Less than High School | 0 (0.0%) | 0.0 |
| High School Diploma | 0 (0.0%) | 0.0 |
| College or Associate's Degree | 0 (0.0%) | 0.0 |
| Bachelor's Degree | 0 (0.0%) | 0.0 |
| Graduate Degree | 0 (0.0%) | 0.0 |
| Total | 0 (0.0%) | 0.0 |
Fertility by Education by Marriage Status in West York
| Educational Attainment | Married | Unmarried |
| Less than High School | 0 (0.0%) | 0 (0.0%) |
| High School Diploma | 0 (0.0%) | 0 (0.0%) |
| College or Associate's Degree | 0 (0.0%) | 0 (0.0%) |
| Bachelor's Degree | 0 (0.0%) | 0 (0.0%) |
| Graduate Degree | 0 (0.0%) | 0 (0.0%) |
| Total | 0 (0.0%) | 0 (0.0%) |
Employment Characteristics in West York
Employment by Class of Employer in West York
Among the 91 employed individuals in West York, , and private company employees (91 | 100.0%) make up the most common classes of employment.
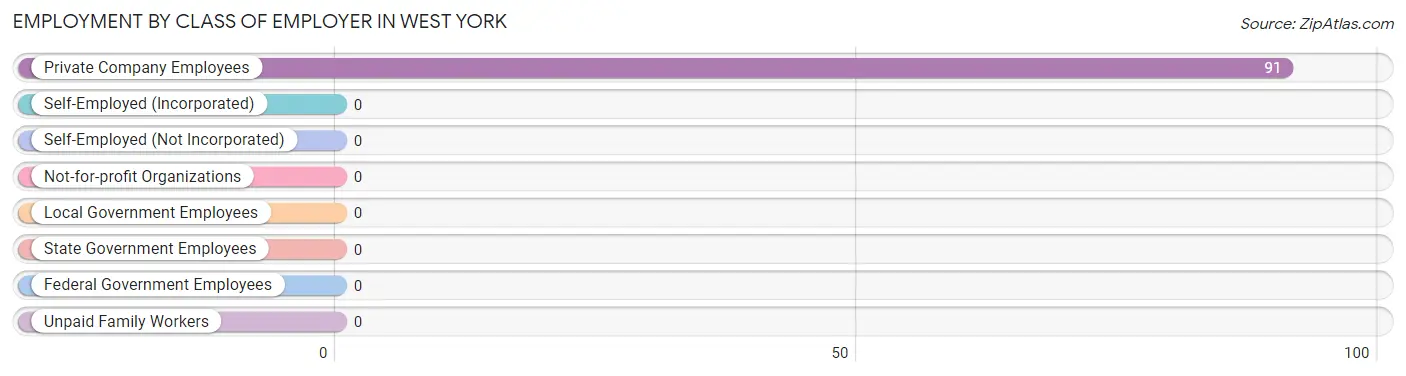
| Employer Class | # Employees | % Employees |
| Private Company Employees | 91 | 100.0% |
| Self-Employed (Incorporated) | 0 | 0.0% |
| Self-Employed (Not Incorporated) | 0 | 0.0% |
| Not-for-profit Organizations | 0 | 0.0% |
| Local Government Employees | 0 | 0.0% |
| State Government Employees | 0 | 0.0% |
| Federal Government Employees | 0 | 0.0% |
| Unpaid Family Workers | 0 | 0.0% |
| Total | 91 | 100.0% |
Employment Status by Age in West York
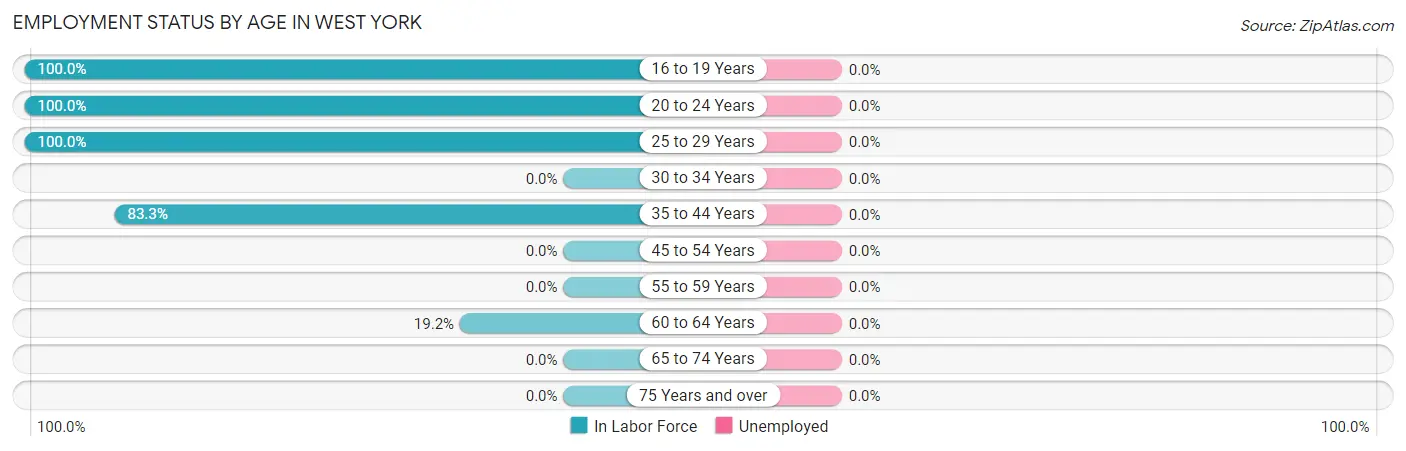
| Age Bracket | In Labor Force | Unemployed |
| 16 to 19 Years | 12 (100.0%) | 0 (0.0%) |
| 20 to 24 Years | 40 (100.0%) | 0 (0.0%) |
| 25 to 29 Years | 9 (100.0%) | 0 (0.0%) |
| 30 to 34 Years | 0 (0.0%) | 0 (0.0%) |
| 35 to 44 Years | 25 (83.3%) | 0 (0.0%) |
| 45 to 54 Years | 0 (0.0%) | 0 (0.0%) |
| 55 to 59 Years | 0 (0.0%) | 0 (0.0%) |
| 60 to 64 Years | 5 (19.2%) | 0 (0.0%) |
| 65 to 74 Years | 0 (0.0%) | 0 (0.0%) |
| 75 Years and over | 0 (0.0%) | 0 (0.0%) |
| Total | 91 (73.4%) | 0 (0.0%) |
Employment Status by Educational Attainment in West York
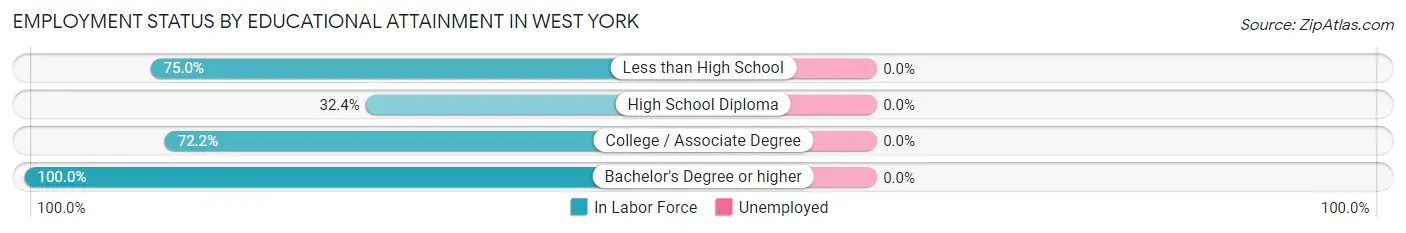
| Educational Attainment | In Labor Force | Unemployed |
| Less than High School | 9 (75.0%) | 0 (0.0%) |
| High School Diploma | 12 (32.4%) | 0 (0.0%) |
| College / Associate Degree | 13 (72.2%) | 0 (0.0%) |
| Bachelor's Degree or higher | 5 (100.0%) | 0 (0.0%) |
| Total | 39 (54.2%) | 0 (0.0%) |
Employment Occupations by Sex in West York
Management, Business, Science and Arts Occupations
The most common Management, Business, Science and Arts occupations in West York are , and Health Diagnosing & Treating (13 | 14.3%).
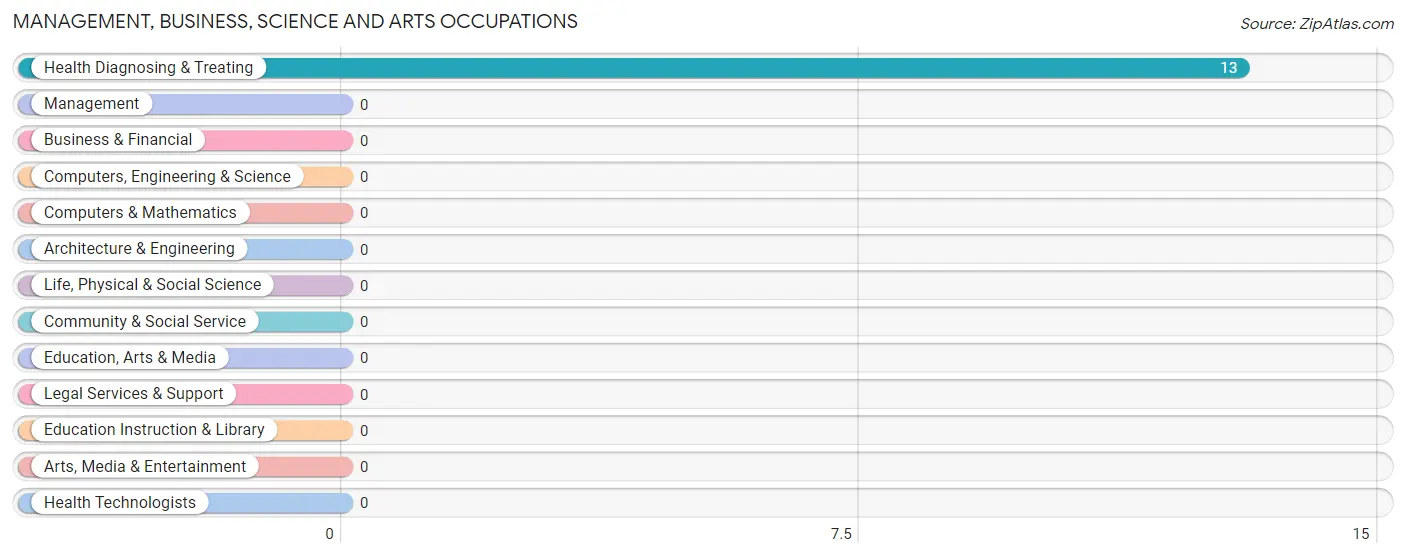
Management, Business, Science and Arts Occupations by Sex
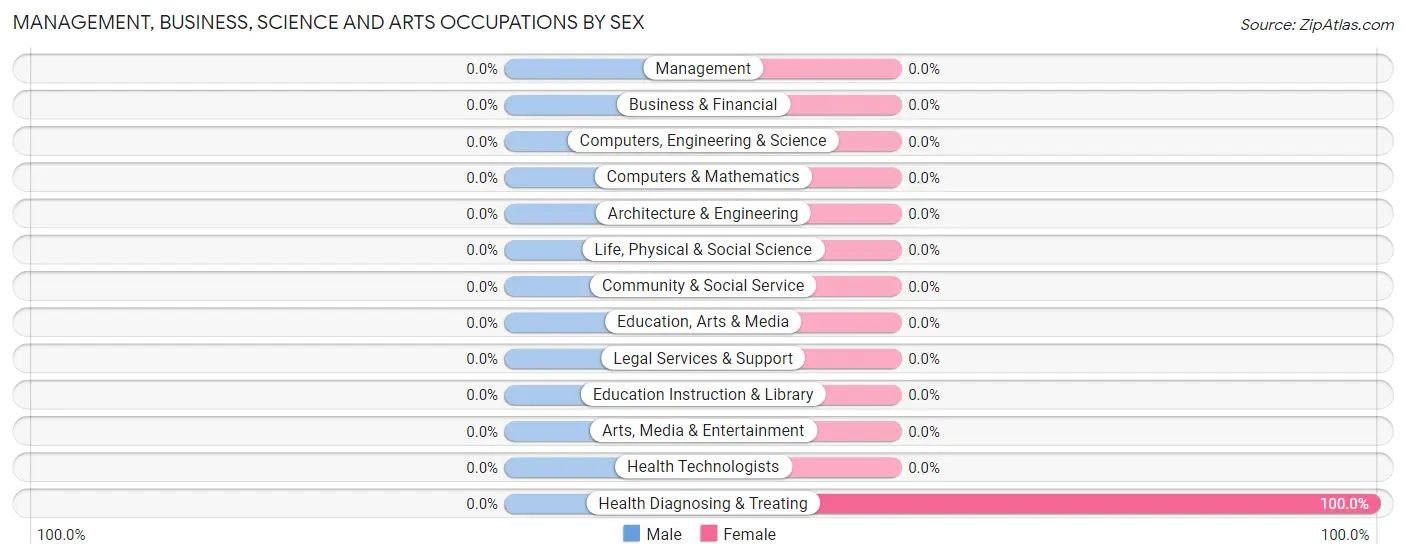
| Occupation | Male | Female |
| Management | 0 (0.0%) | 0 (0.0%) |
| Business & Financial | 0 (0.0%) | 0 (0.0%) |
| Computers, Engineering & Science | 0 (0.0%) | 0 (0.0%) |
| Computers & Mathematics | 0 (0.0%) | 0 (0.0%) |
| Architecture & Engineering | 0 (0.0%) | 0 (0.0%) |
| Life, Physical & Social Science | 0 (0.0%) | 0 (0.0%) |
| Community & Social Service | 0 (0.0%) | 0 (0.0%) |
| Education, Arts & Media | 0 (0.0%) | 0 (0.0%) |
| Legal Services & Support | 0 (0.0%) | 0 (0.0%) |
| Education Instruction & Library | 0 (0.0%) | 0 (0.0%) |
| Arts, Media & Entertainment | 0 (0.0%) | 0 (0.0%) |
| Health Diagnosing & Treating | 0 (0.0%) | 13 (100.0%) |
| Health Technologists | 0 (0.0%) | 0 (0.0%) |
| Total (Category) | 0 (0.0%) | 13 (100.0%) |
| Total (Overall) | 26 (28.6%) | 65 (71.4%) |
Services Occupations
The most common Services occupations in West York are , and Food Preparation & Serving (28 | 30.8%).
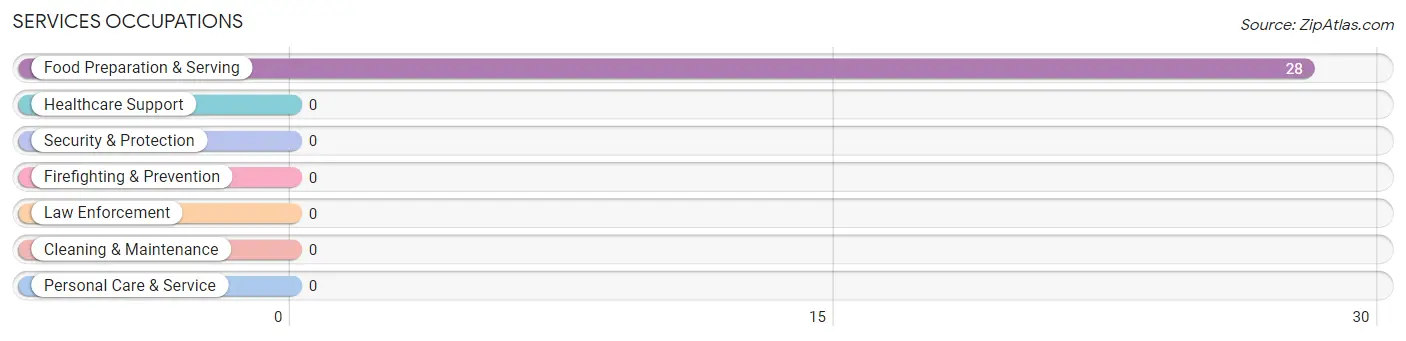
Services Occupations by Sex
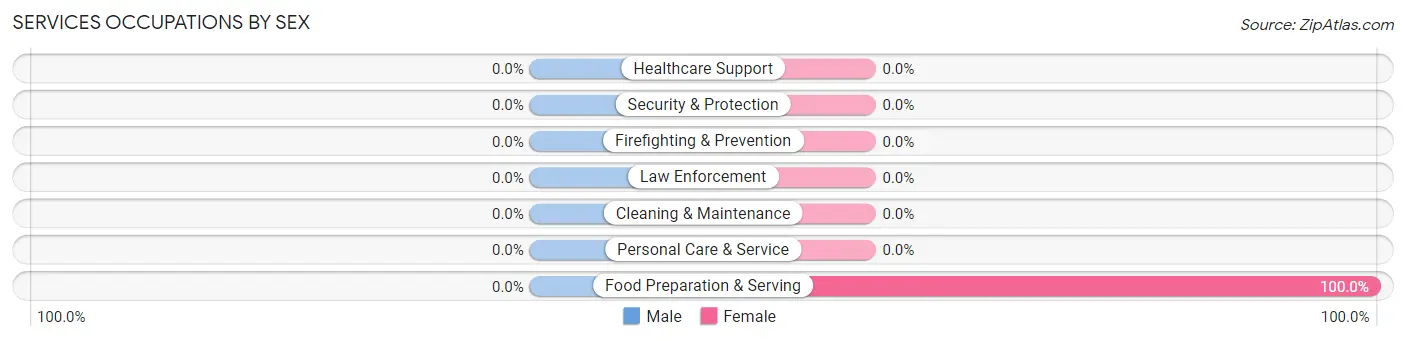
| Occupation | Male | Female |
| Healthcare Support | 0 (0.0%) | 0 (0.0%) |
| Security & Protection | 0 (0.0%) | 0 (0.0%) |
| Firefighting & Prevention | 0 (0.0%) | 0 (0.0%) |
| Law Enforcement | 0 (0.0%) | 0 (0.0%) |
| Food Preparation & Serving | 0 (0.0%) | 28 (100.0%) |
| Cleaning & Maintenance | 0 (0.0%) | 0 (0.0%) |
| Personal Care & Service | 0 (0.0%) | 0 (0.0%) |
| Total (Category) | 0 (0.0%) | 28 (100.0%) |
| Total (Overall) | 26 (28.6%) | 65 (71.4%) |
Sales and Office Occupations
The most common Sales and Office occupations in West York are , and Sales & Related (12 | 13.2%).
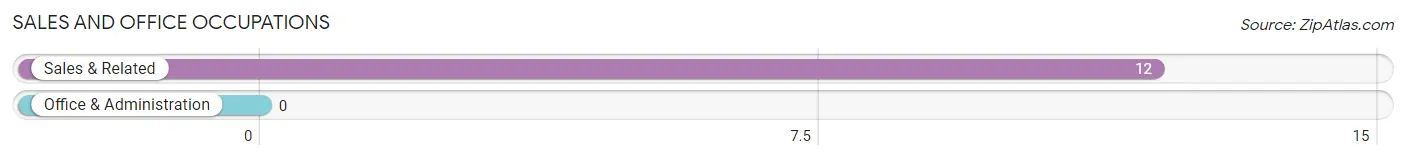
Sales and Office Occupations by Sex
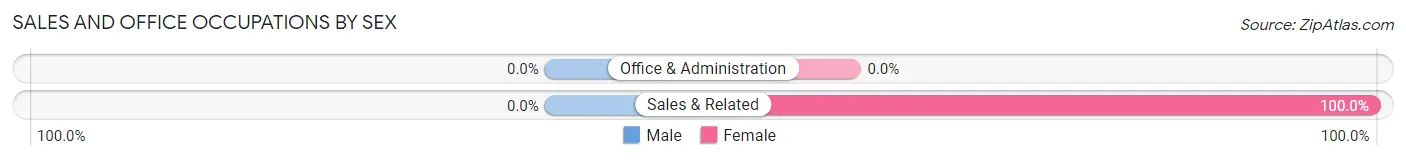
| Occupation | Male | Female |
| Sales & Related | 0 (0.0%) | 12 (100.0%) |
| Office & Administration | 0 (0.0%) | 0 (0.0%) |
| Total (Category) | 0 (0.0%) | 12 (100.0%) |
| Total (Overall) | 26 (28.6%) | 65 (71.4%) |
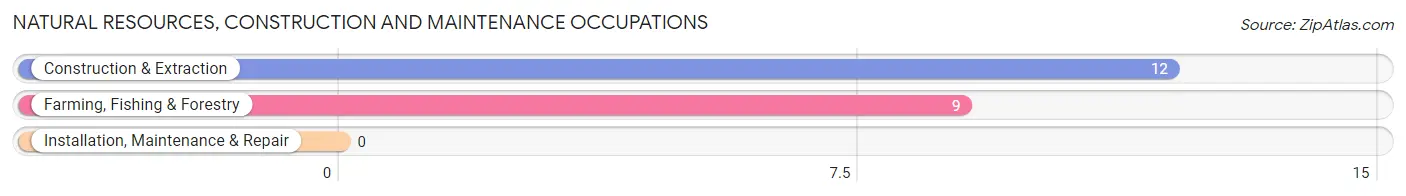
Natural Resources, Construction and Maintenance Occupations
The most common Natural Resources, Construction and Maintenance occupations in West York are Construction & Extraction (12 | 13.2%), and Farming, Fishing & Forestry (9 | 9.9%).
Natural Resources, Construction and Maintenance Occupations by Sex
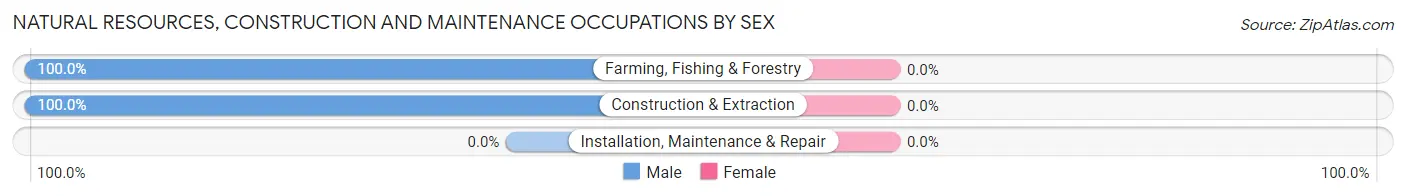
| Occupation | Male | Female |
| Farming, Fishing & Forestry | 9 (100.0%) | 0 (0.0%) |
| Construction & Extraction | 12 (100.0%) | 0 (0.0%) |
| Installation, Maintenance & Repair | 0 (0.0%) | 0 (0.0%) |
| Total (Category) | 21 (100.0%) | 0 (0.0%) |
| Total (Overall) | 26 (28.6%) | 65 (71.4%) |
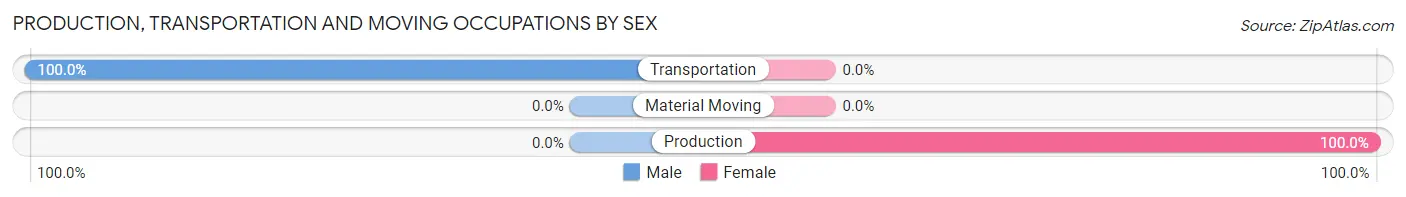
Production, Transportation and Moving Occupations
The most common Production, Transportation and Moving occupations in West York are Production (12 | 13.2%), and Transportation (5 | 5.5%).
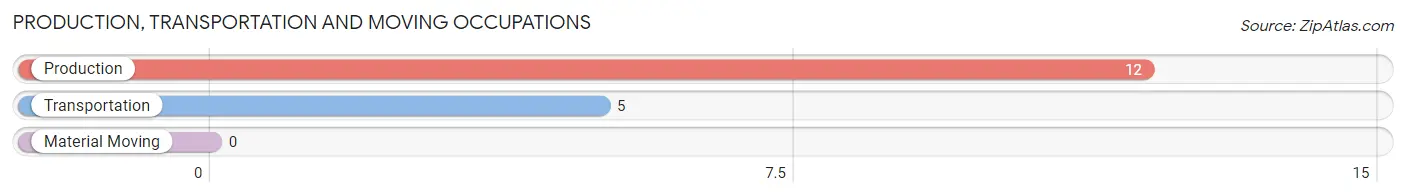
Production, Transportation and Moving Occupations by Sex
| Occupation | Male | Female |
| Production | 0 (0.0%) | 12 (100.0%) |
| Transportation | 5 (100.0%) | 0 (0.0%) |
| Material Moving | 0 (0.0%) | 0 (0.0%) |
| Total (Category) | 5 (29.4%) | 12 (70.6%) |
| Total (Overall) | 26 (28.6%) | 65 (71.4%) |
Employment Industries by Sex in West York
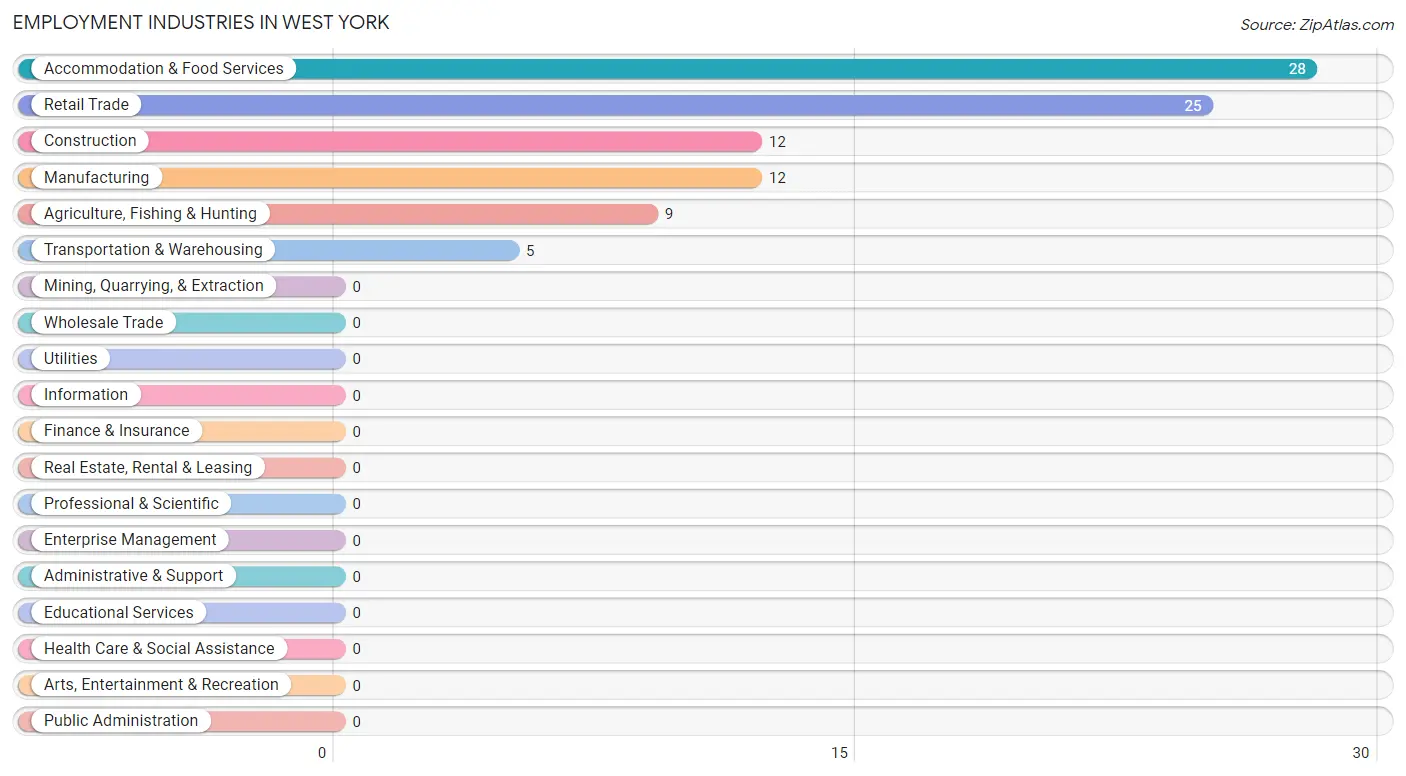
Employment Industries in West York
The major employment industries in West York include Accommodation & Food Services (28 | 30.8%), Retail Trade (25 | 27.5%), Construction (12 | 13.2%), Manufacturing (12 | 13.2%), and Agriculture, Fishing & Hunting (9 | 9.9%).
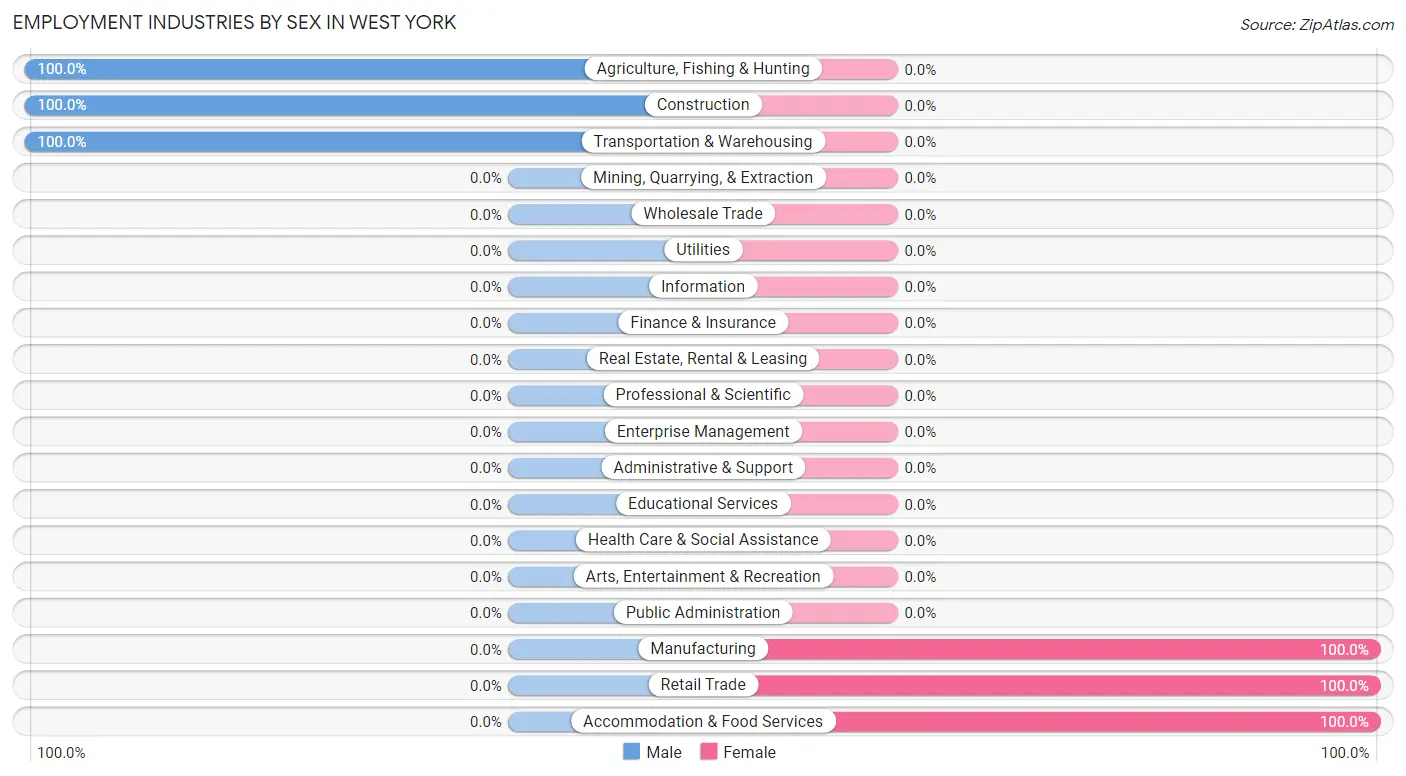
Employment Industries by Sex in West York
The West York industries that see more men than women are Agriculture, Fishing & Hunting (100.0%), Construction (100.0%), and Transportation & Warehousing (100.0%), whereas the industries that tend to have a higher number of women are Manufacturing (100.0%), Retail Trade (100.0%), and Accommodation & Food Services (100.0%).
| Industry | Male | Female |
| Agriculture, Fishing & Hunting | 9 (100.0%) | 0 (0.0%) |
| Mining, Quarrying, & Extraction | 0 (0.0%) | 0 (0.0%) |
| Construction | 12 (100.0%) | 0 (0.0%) |
| Manufacturing | 0 (0.0%) | 12 (100.0%) |
| Wholesale Trade | 0 (0.0%) | 0 (0.0%) |
| Retail Trade | 0 (0.0%) | 25 (100.0%) |
| Transportation & Warehousing | 5 (100.0%) | 0 (0.0%) |
| Utilities | 0 (0.0%) | 0 (0.0%) |
| Information | 0 (0.0%) | 0 (0.0%) |
| Finance & Insurance | 0 (0.0%) | 0 (0.0%) |
| Real Estate, Rental & Leasing | 0 (0.0%) | 0 (0.0%) |
| Professional & Scientific | 0 (0.0%) | 0 (0.0%) |
| Enterprise Management | 0 (0.0%) | 0 (0.0%) |
| Administrative & Support | 0 (0.0%) | 0 (0.0%) |
| Educational Services | 0 (0.0%) | 0 (0.0%) |
| Health Care & Social Assistance | 0 (0.0%) | 0 (0.0%) |
| Arts, Entertainment & Recreation | 0 (0.0%) | 0 (0.0%) |
| Accommodation & Food Services | 0 (0.0%) | 28 (100.0%) |
| Public Administration | 0 (0.0%) | 0 (0.0%) |
| Total | 26 (28.6%) | 65 (71.4%) |
Education in West York
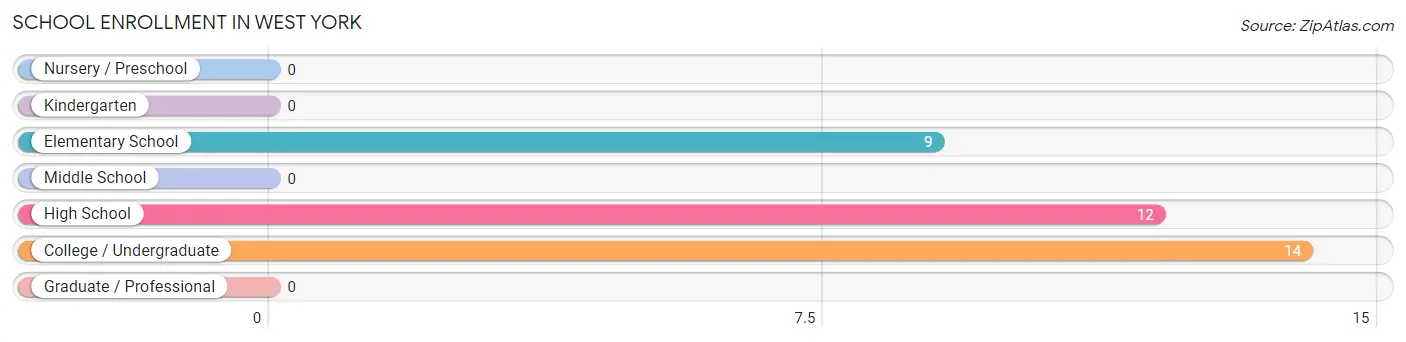
School Enrollment in West York
The most common levels of schooling among the 35 students in West York are college / undergraduate (14 | 40.0%), high school (12 | 34.3%), and elementary school (9 | 25.7%).
| School Level | # Students | % Students |
| Nursery / Preschool | 0 | 0.0% |
| Kindergarten | 0 | 0.0% |
| Elementary School | 9 | 25.7% |
| Middle School | 0 | 0.0% |
| High School | 12 | 34.3% |
| College / Undergraduate | 14 | 40.0% |
| Graduate / Professional | 0 | 0.0% |
| Total | 35 | 100.0% |
School Enrollment by Age by Funding Source in West York
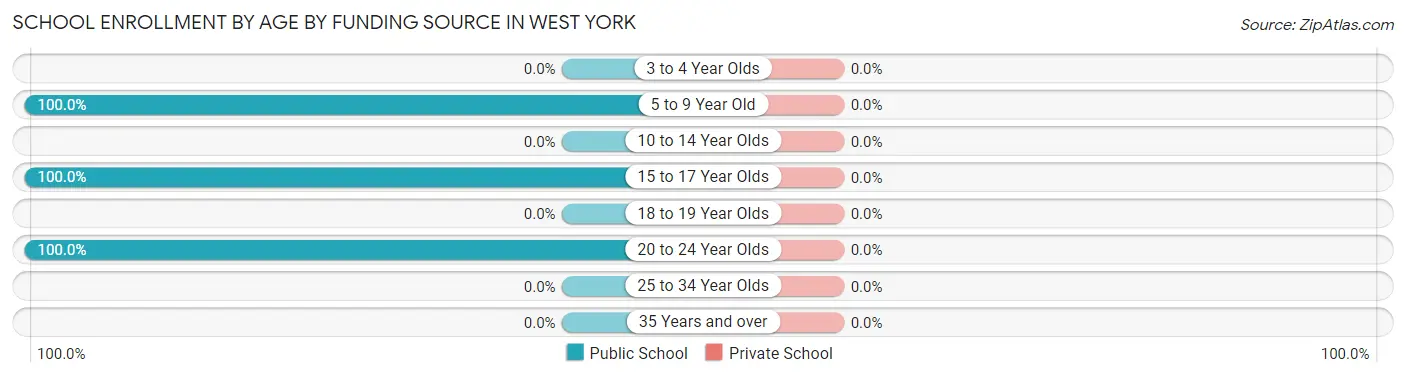
| Age Bracket | Public School | Private School |
| 3 to 4 Year Olds | 0 (0.0%) | 0 (0.0%) |
| 5 to 9 Year Old | 9 (100.0%) | 0 (0.0%) |
| 10 to 14 Year Olds | 0 (0.0%) | 0 (0.0%) |
| 15 to 17 Year Olds | 12 (100.0%) | 0 (0.0%) |
| 18 to 19 Year Olds | 0 (0.0%) | 0 (0.0%) |
| 20 to 24 Year Olds | 14 (100.0%) | 0 (0.0%) |
| 25 to 34 Year Olds | 0 (0.0%) | 0 (0.0%) |
| 35 Years and over | 0 (0.0%) | 0 (0.0%) |
| Total | 35 (100.0%) | 0 (0.0%) |
Educational Attainment by Field of Study in West York
, and arts & humanities (5 | 100.0%) are the most common fields of study among 5 individuals in West York who have obtained a bachelor's degree or higher.
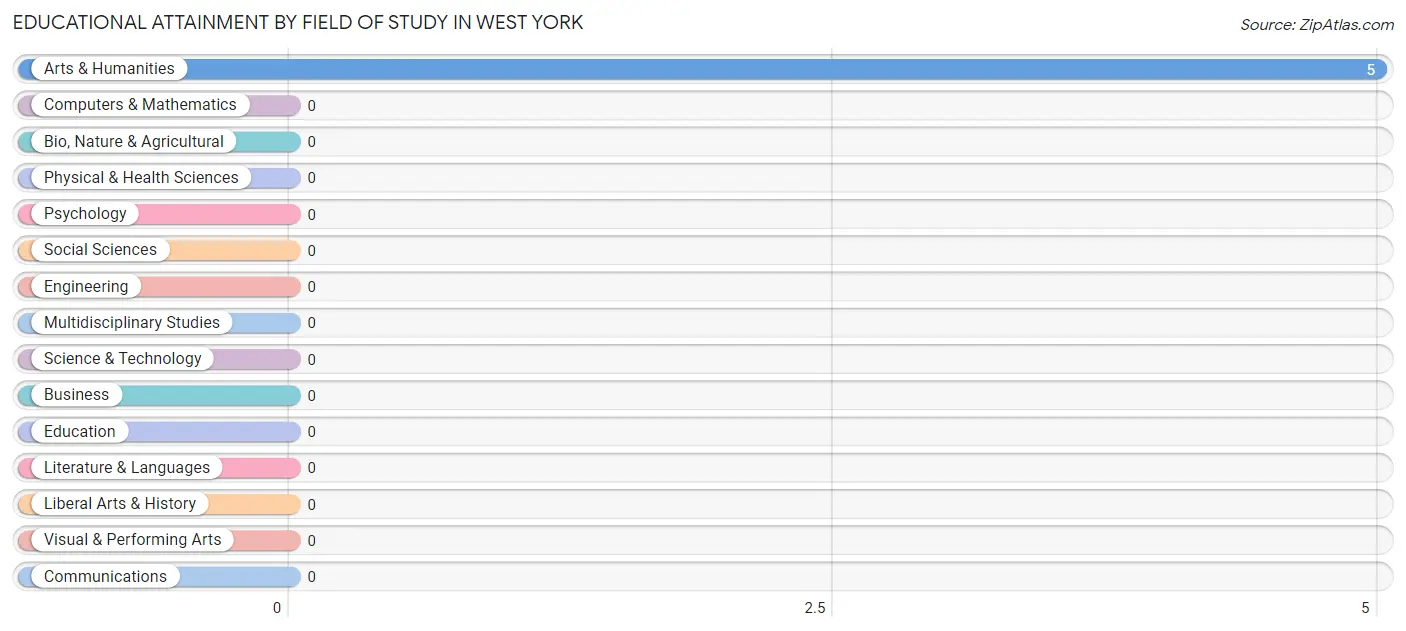
| Field of Study | # Graduates | % Graduates |
| Computers & Mathematics | 0 | 0.0% |
| Bio, Nature & Agricultural | 0 | 0.0% |
| Physical & Health Sciences | 0 | 0.0% |
| Psychology | 0 | 0.0% |
| Social Sciences | 0 | 0.0% |
| Engineering | 0 | 0.0% |
| Multidisciplinary Studies | 0 | 0.0% |
| Science & Technology | 0 | 0.0% |
| Business | 0 | 0.0% |
| Education | 0 | 0.0% |
| Literature & Languages | 0 | 0.0% |
| Liberal Arts & History | 0 | 0.0% |
| Visual & Performing Arts | 0 | 0.0% |
| Communications | 0 | 0.0% |
| Arts & Humanities | 5 | 100.0% |
| Total | 5 | 100.0% |
Transportation & Commute in West York
Vehicle Availability by Sex in West York
The most prevalent vehicle ownership categories in West York are males with 5 or more vehicles (12, accounting for 46.2%) and females with 5 or more vehicles (53, making up 18.5%).
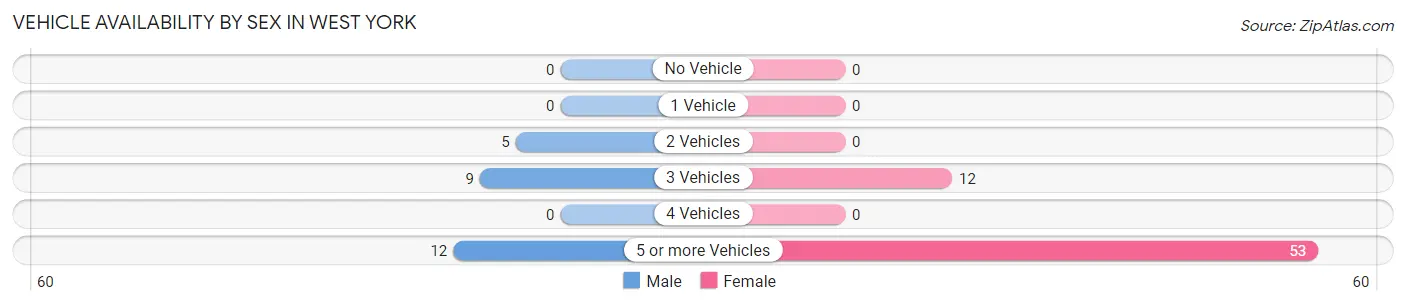
| Vehicles Available | Male | Female |
| No Vehicle | 0 (0.0%) | 0 (0.0%) |
| 1 Vehicle | 0 (0.0%) | 0 (0.0%) |
| 2 Vehicles | 5 (19.2%) | 0 (0.0%) |
| 3 Vehicles | 9 (34.6%) | 12 (18.5%) |
| 4 Vehicles | 0 (0.0%) | 0 (0.0%) |
| 5 or more Vehicles | 12 (46.2%) | 53 (81.5%) |
| Total | 26 (100.0%) | 65 (100.0%) |
Commute Time in West York
The most frequently occuring commute durations in West York are 25 to 29 minutes (52 commuters, 57.1%), 30 to 34 minutes (13 commuters, 14.3%), and 20 to 24 minutes (12 commuters, 13.2%).
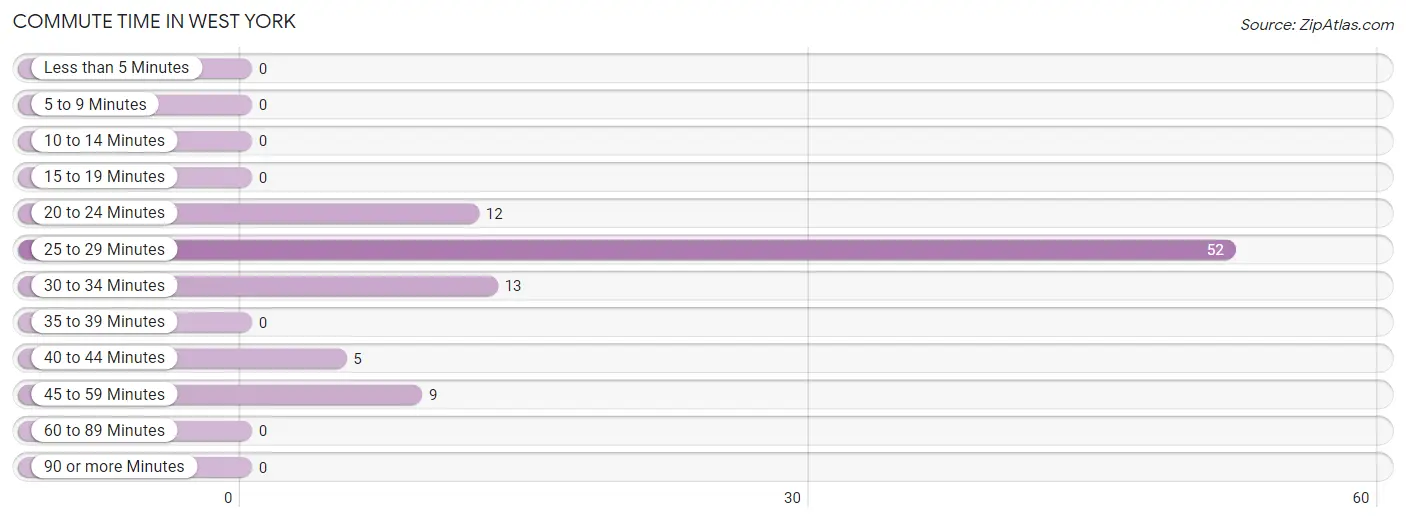
| Commute Time | # Commuters | % Commuters |
| Less than 5 Minutes | 0 | 0.0% |
| 5 to 9 Minutes | 0 | 0.0% |
| 10 to 14 Minutes | 0 | 0.0% |
| 15 to 19 Minutes | 0 | 0.0% |
| 20 to 24 Minutes | 12 | 13.2% |
| 25 to 29 Minutes | 52 | 57.1% |
| 30 to 34 Minutes | 13 | 14.3% |
| 35 to 39 Minutes | 0 | 0.0% |
| 40 to 44 Minutes | 5 | 5.5% |
| 45 to 59 Minutes | 9 | 9.9% |
| 60 to 89 Minutes | 0 | 0.0% |
| 90 or more Minutes | 0 | 0.0% |
Commute Time by Sex in West York
The most common commute times in West York are 25 to 29 minutes (12 commuters, 46.2%) for males and 25 to 29 minutes (40 commuters, 61.5%) for females.
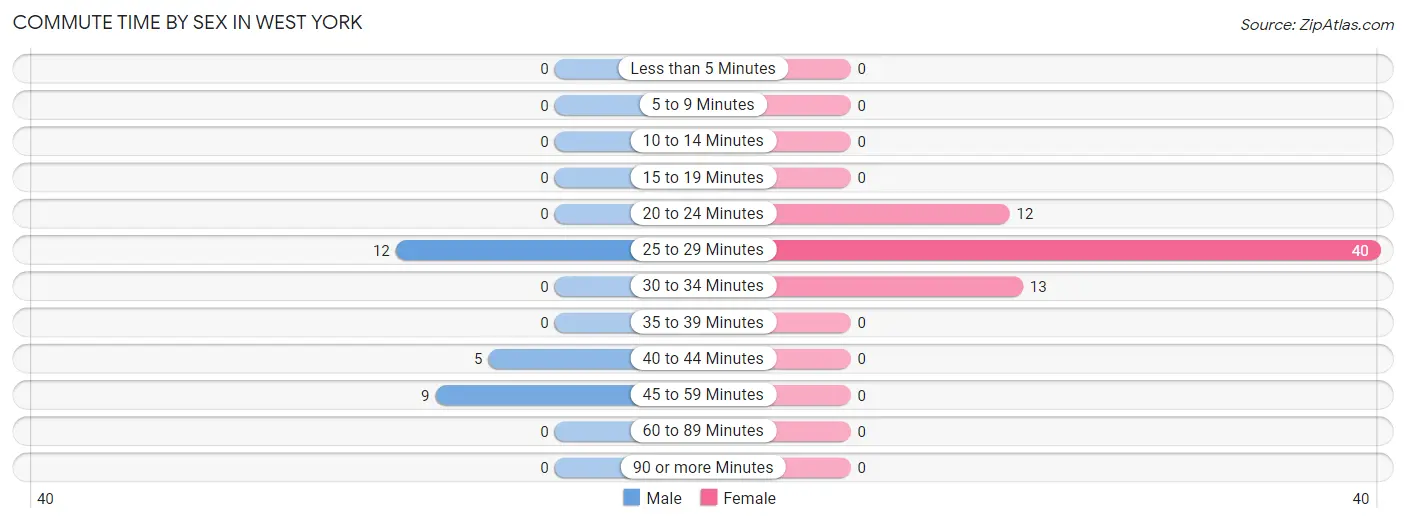
| Commute Time | Male | Female |
| Less than 5 Minutes | 0 (0.0%) | 0 (0.0%) |
| 5 to 9 Minutes | 0 (0.0%) | 0 (0.0%) |
| 10 to 14 Minutes | 0 (0.0%) | 0 (0.0%) |
| 15 to 19 Minutes | 0 (0.0%) | 0 (0.0%) |
| 20 to 24 Minutes | 0 (0.0%) | 12 (18.5%) |
| 25 to 29 Minutes | 12 (46.2%) | 40 (61.5%) |
| 30 to 34 Minutes | 0 (0.0%) | 13 (20.0%) |
| 35 to 39 Minutes | 0 (0.0%) | 0 (0.0%) |
| 40 to 44 Minutes | 5 (19.2%) | 0 (0.0%) |
| 45 to 59 Minutes | 9 (34.6%) | 0 (0.0%) |
| 60 to 89 Minutes | 0 (0.0%) | 0 (0.0%) |
| 90 or more Minutes | 0 (0.0%) | 0 (0.0%) |
Time of Departure to Work by Sex in West York
The most frequent times of departure to work in West York are 5:30 AM to 5:59 AM (12, 46.2%) for males and 7:30 AM to 7:59 AM (14, 21.5%) for females.
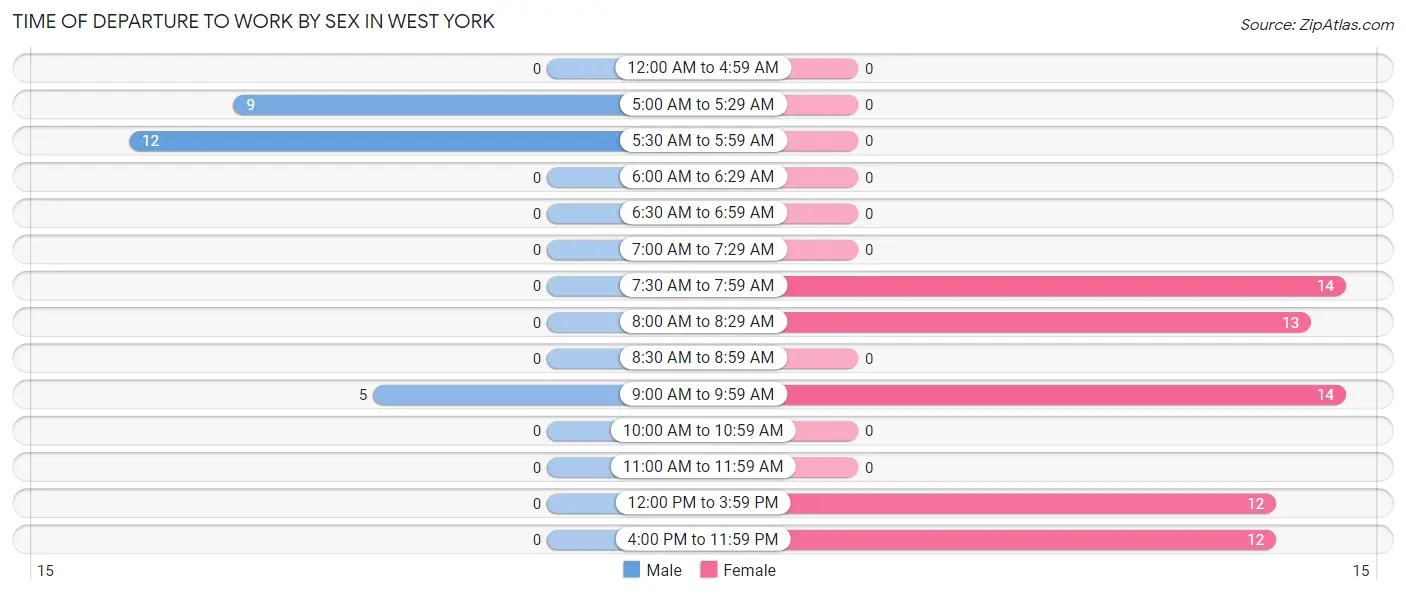
| Time of Departure | Male | Female |
| 12:00 AM to 4:59 AM | 0 (0.0%) | 0 (0.0%) |
| 5:00 AM to 5:29 AM | 9 (34.6%) | 0 (0.0%) |
| 5:30 AM to 5:59 AM | 12 (46.2%) | 0 (0.0%) |
| 6:00 AM to 6:29 AM | 0 (0.0%) | 0 (0.0%) |
| 6:30 AM to 6:59 AM | 0 (0.0%) | 0 (0.0%) |
| 7:00 AM to 7:29 AM | 0 (0.0%) | 0 (0.0%) |
| 7:30 AM to 7:59 AM | 0 (0.0%) | 14 (21.5%) |
| 8:00 AM to 8:29 AM | 0 (0.0%) | 13 (20.0%) |
| 8:30 AM to 8:59 AM | 0 (0.0%) | 0 (0.0%) |
| 9:00 AM to 9:59 AM | 5 (19.2%) | 14 (21.5%) |
| 10:00 AM to 10:59 AM | 0 (0.0%) | 0 (0.0%) |
| 11:00 AM to 11:59 AM | 0 (0.0%) | 0 (0.0%) |
| 12:00 PM to 3:59 PM | 0 (0.0%) | 12 (18.5%) |
| 4:00 PM to 11:59 PM | 0 (0.0%) | 12 (18.5%) |
| Total | 26 (100.0%) | 65 (100.0%) |
Housing Occupancy in West York
Occupancy by Ownership in West York
Of the total 58 dwellings in West York, owner-occupied units account for 40 (69.0%), while renter-occupied units make up 18 (31.0%).
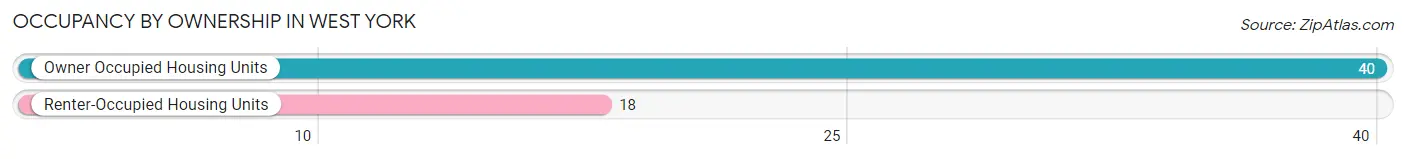
| Occupancy | # Housing Units | % Housing Units |
| Owner Occupied Housing Units | 40 | 69.0% |
| Renter-Occupied Housing Units | 18 | 31.0% |
| Total Occupied Housing Units | 58 | 100.0% |
Occupancy by Household Size in West York
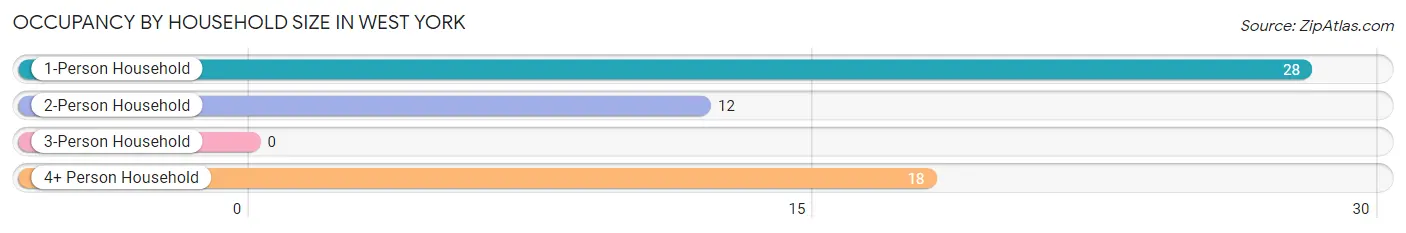
| Household Size | # Housing Units | % Housing Units |
| 1-Person Household | 28 | 48.3% |
| 2-Person Household | 12 | 20.7% |
| 3-Person Household | 0 | 0.0% |
| 4+ Person Household | 18 | 31.0% |
| Total Housing Units | 58 | 100.0% |
Occupancy by Ownership by Household Size in West York
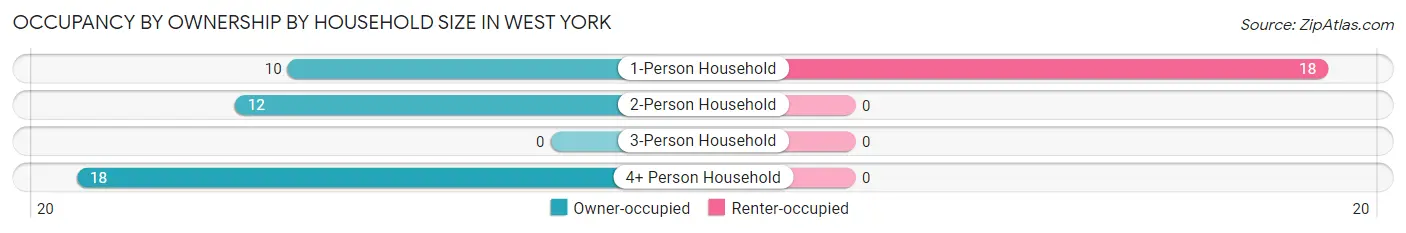
| Household Size | Owner-occupied | Renter-occupied |
| 1-Person Household | 10 (35.7%) | 18 (64.3%) |
| 2-Person Household | 12 (100.0%) | 0 (0.0%) |
| 3-Person Household | 0 (0.0%) | 0 (0.0%) |
| 4+ Person Household | 18 (100.0%) | 0 (0.0%) |
| Total Housing Units | 40 (69.0%) | 18 (31.0%) |
Occupancy by Educational Attainment in West York
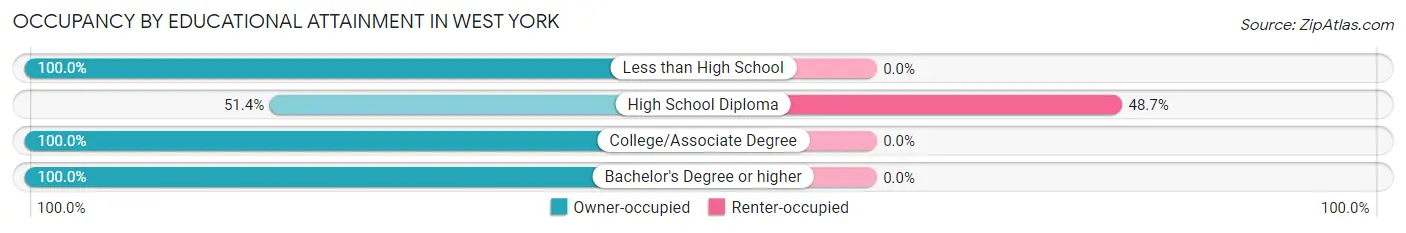
| Household Size | Owner-occupied | Renter-occupied |
| Less than High School | 3 (100.0%) | 0 (0.0%) |
| High School Diploma | 19 (51.3%) | 18 (48.6%) |
| College/Associate Degree | 13 (100.0%) | 0 (0.0%) |
| Bachelor's Degree or higher | 5 (100.0%) | 0 (0.0%) |
Occupancy by Age of Householder in West York
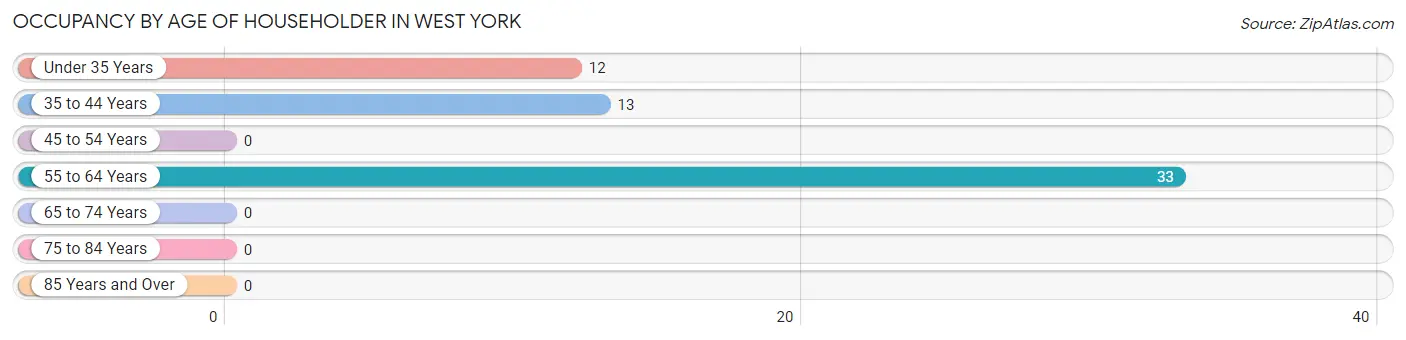
| Age Bracket | # Households | % Households |
| Under 35 Years | 12 | 20.7% |
| 35 to 44 Years | 13 | 22.4% |
| 45 to 54 Years | 0 | 0.0% |
| 55 to 64 Years | 33 | 56.9% |
| 65 to 74 Years | 0 | 0.0% |
| 75 to 84 Years | 0 | 0.0% |
| 85 Years and Over | 0 | 0.0% |
| Total | 58 | 100.0% |
Housing Finances in West York
Median Income by Occupancy in West York
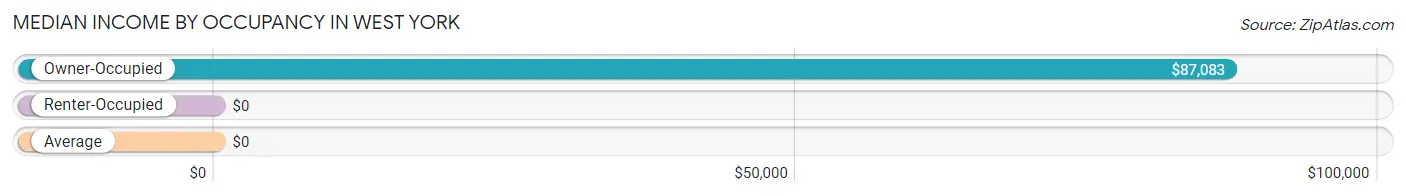
| Occupancy Type | # Households | Median Income |
| Owner-Occupied | 40 (69.0%) | $87,083 |
| Renter-Occupied | 18 (31.0%) | $0 |
| Average | 58 (100.0%) | $0 |
Occupancy by Householder Income Bracket in West York
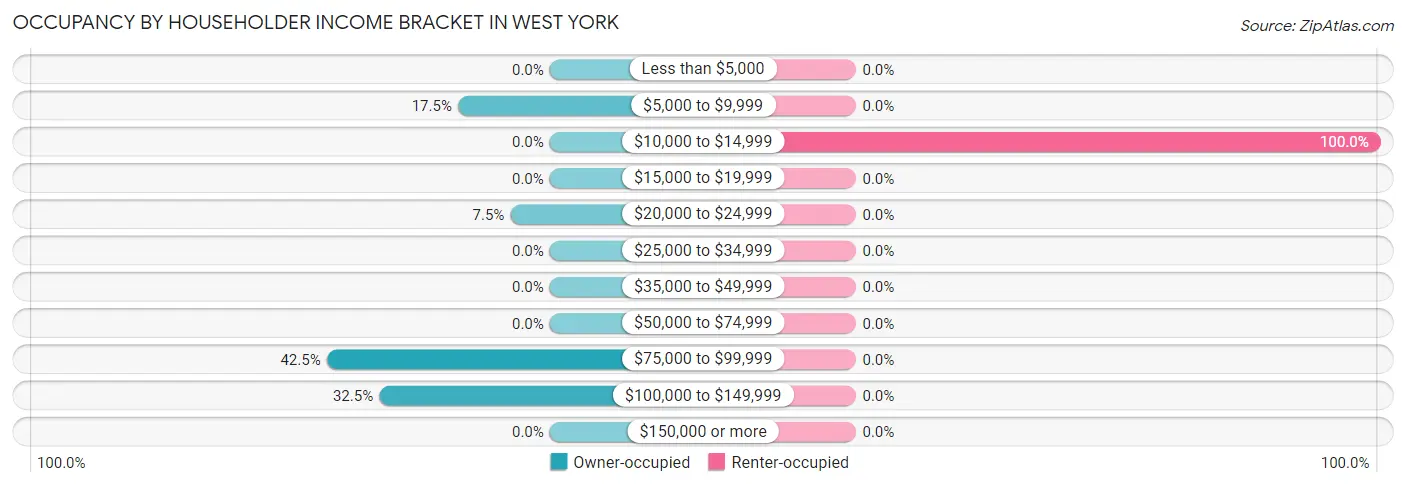
| Income Bracket | Owner-occupied | Renter-occupied |
| Less than $5,000 | 0 (0.0%) | 0 (0.0%) |
| $5,000 to $9,999 | 7 (17.5%) | 0 (0.0%) |
| $10,000 to $14,999 | 0 (0.0%) | 18 (100.0%) |
| $15,000 to $19,999 | 0 (0.0%) | 0 (0.0%) |
| $20,000 to $24,999 | 3 (7.5%) | 0 (0.0%) |
| $25,000 to $34,999 | 0 (0.0%) | 0 (0.0%) |
| $35,000 to $49,999 | 0 (0.0%) | 0 (0.0%) |
| $50,000 to $74,999 | 0 (0.0%) | 0 (0.0%) |
| $75,000 to $99,999 | 17 (42.5%) | 0 (0.0%) |
| $100,000 to $149,999 | 13 (32.5%) | 0 (0.0%) |
| $150,000 or more | 0 (0.0%) | 0 (0.0%) |
| Total | 40 (100.0%) | 18 (100.0%) |
Monthly Housing Cost Tiers in West York
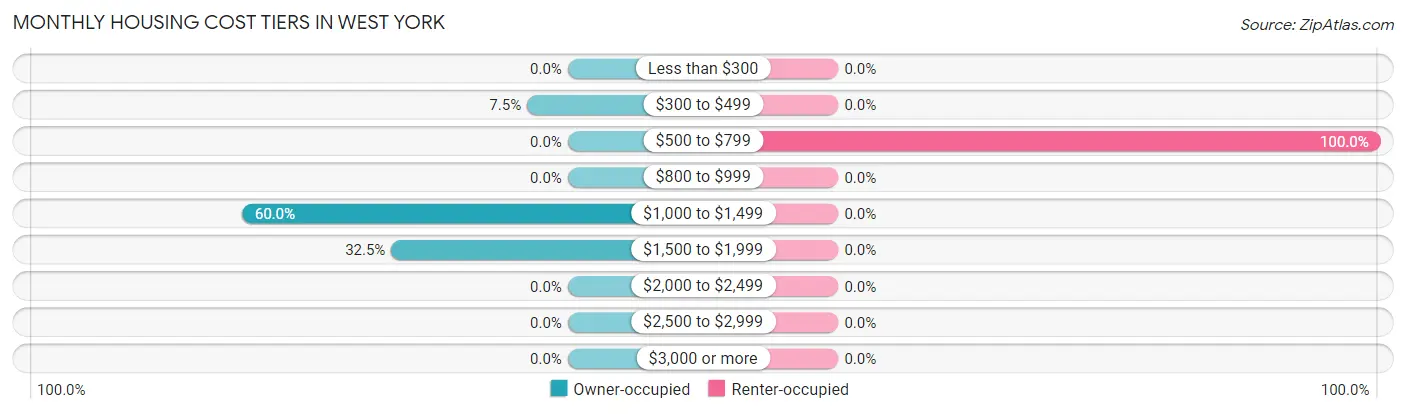
| Monthly Cost | Owner-occupied | Renter-occupied |
| Less than $300 | 0 (0.0%) | 0 (0.0%) |
| $300 to $499 | 3 (7.5%) | 0 (0.0%) |
| $500 to $799 | 0 (0.0%) | 18 (100.0%) |
| $800 to $999 | 0 (0.0%) | 0 (0.0%) |
| $1,000 to $1,499 | 24 (60.0%) | 0 (0.0%) |
| $1,500 to $1,999 | 13 (32.5%) | 0 (0.0%) |
| $2,000 to $2,499 | 0 (0.0%) | 0 (0.0%) |
| $2,500 to $2,999 | 0 (0.0%) | 0 (0.0%) |
| $3,000 or more | 0 (0.0%) | 0 (0.0%) |
| Total | 40 (100.0%) | 18 (100.0%) |
Physical Housing Characteristics in West York
Housing Structures in West York
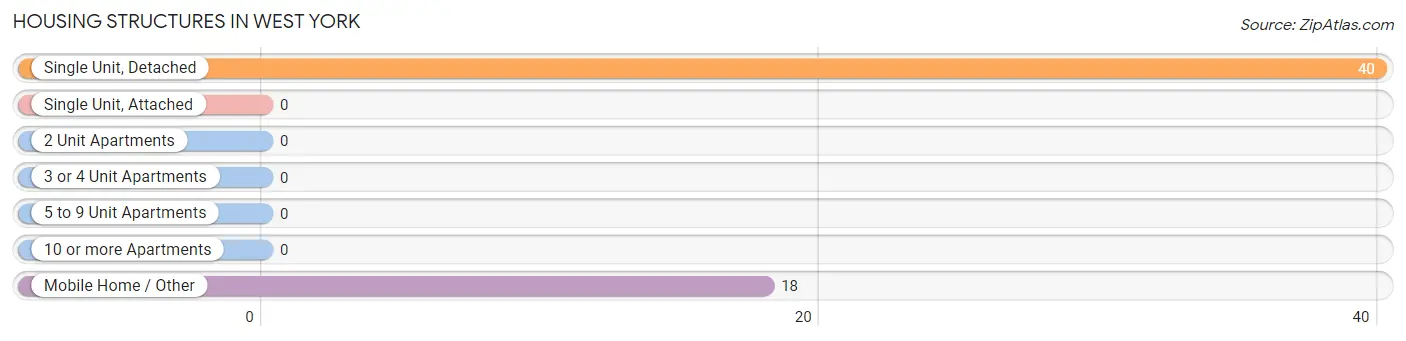
| Structure Type | # Housing Units | % Housing Units |
| Single Unit, Detached | 40 | 69.0% |
| Single Unit, Attached | 0 | 0.0% |
| 2 Unit Apartments | 0 | 0.0% |
| 3 or 4 Unit Apartments | 0 | 0.0% |
| 5 to 9 Unit Apartments | 0 | 0.0% |
| 10 or more Apartments | 0 | 0.0% |
| Mobile Home / Other | 18 | 31.0% |
| Total | 58 | 100.0% |
Housing Structures by Occupancy in West York
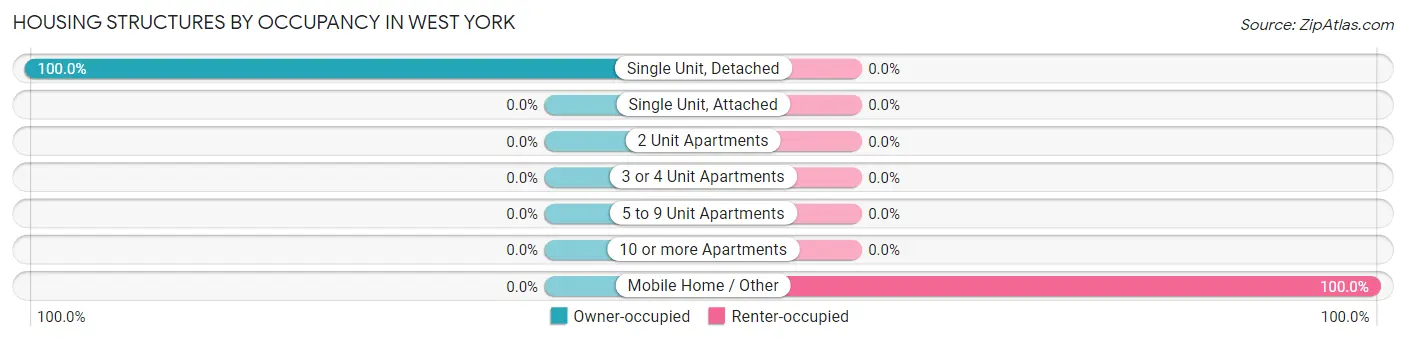
| Structure Type | Owner-occupied | Renter-occupied |
| Single Unit, Detached | 40 (100.0%) | 0 (0.0%) |
| Single Unit, Attached | 0 (0.0%) | 0 (0.0%) |
| 2 Unit Apartments | 0 (0.0%) | 0 (0.0%) |
| 3 or 4 Unit Apartments | 0 (0.0%) | 0 (0.0%) |
| 5 to 9 Unit Apartments | 0 (0.0%) | 0 (0.0%) |
| 10 or more Apartments | 0 (0.0%) | 0 (0.0%) |
| Mobile Home / Other | 0 (0.0%) | 18 (100.0%) |
| Total | 40 (69.0%) | 18 (31.0%) |
Housing Structures by Number of Rooms in West York
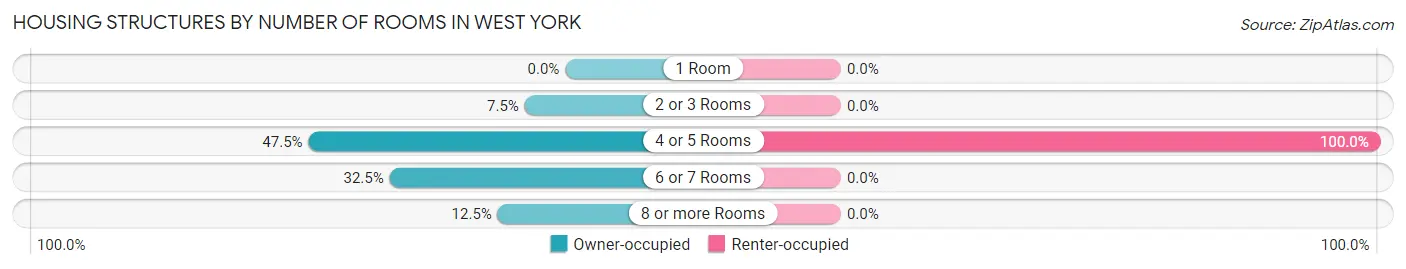
| Number of Rooms | Owner-occupied | Renter-occupied |
| 1 Room | 0 (0.0%) | 0 (0.0%) |
| 2 or 3 Rooms | 3 (7.5%) | 0 (0.0%) |
| 4 or 5 Rooms | 19 (47.5%) | 18 (100.0%) |
| 6 or 7 Rooms | 13 (32.5%) | 0 (0.0%) |
| 8 or more Rooms | 5 (12.5%) | 0 (0.0%) |
| Total | 40 (100.0%) | 18 (100.0%) |
Housing Structure by Heating Type in West York
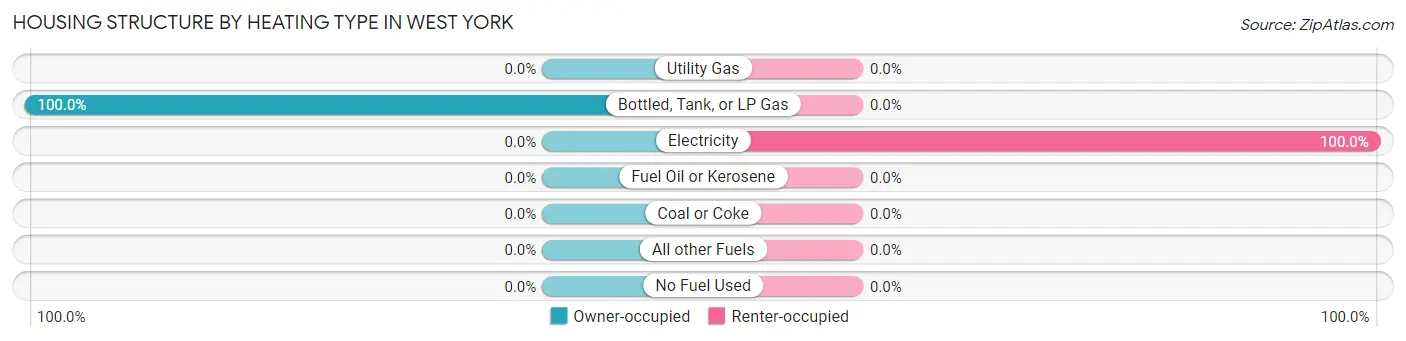
| Heating Type | Owner-occupied | Renter-occupied |
| Utility Gas | 0 (0.0%) | 0 (0.0%) |
| Bottled, Tank, or LP Gas | 40 (100.0%) | 0 (0.0%) |
| Electricity | 0 (0.0%) | 18 (100.0%) |
| Fuel Oil or Kerosene | 0 (0.0%) | 0 (0.0%) |
| Coal or Coke | 0 (0.0%) | 0 (0.0%) |
| All other Fuels | 0 (0.0%) | 0 (0.0%) |
| No Fuel Used | 0 (0.0%) | 0 (0.0%) |
| Total | 40 (100.0%) | 18 (100.0%) |
Household Vehicle Usage in West York
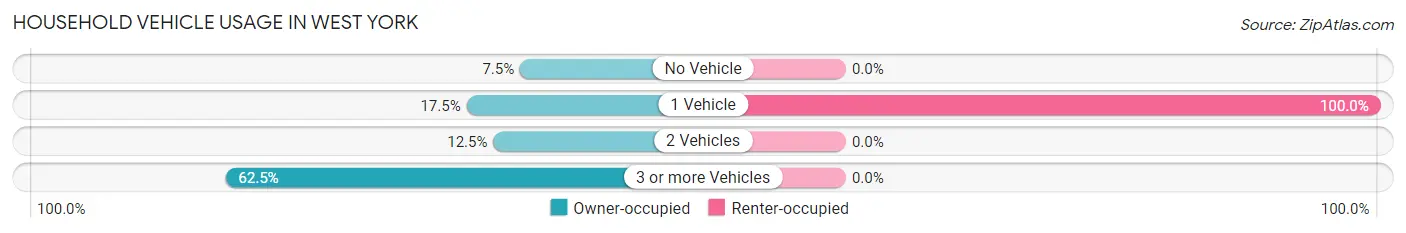
| Vehicles per Household | Owner-occupied | Renter-occupied |
| No Vehicle | 3 (7.5%) | 0 (0.0%) |
| 1 Vehicle | 7 (17.5%) | 18 (100.0%) |
| 2 Vehicles | 5 (12.5%) | 0 (0.0%) |
| 3 or more Vehicles | 25 (62.5%) | 0 (0.0%) |
| Total | 40 (100.0%) | 18 (100.0%) |
Real Estate & Mortgages in West York
Real Estate and Mortgage Overview in West York
| Characteristic | Without Mortgage | With Mortgage |
| Housing Units | 0 | 40 |
| Median Property Value | - | - |
| Median Household Income | - | - |
| Monthly Housing Costs | - | - |
| Real Estate Taxes | - | - |
Property Value by Mortgage Status in West York
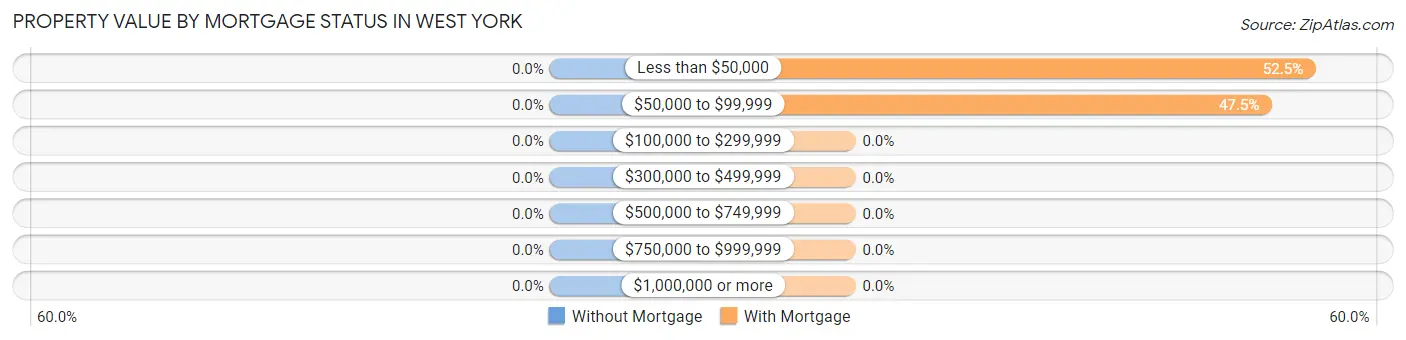
| Property Value | Without Mortgage | With Mortgage |
| Less than $50,000 | 0 (0.0%) | 21 (52.5%) |
| $50,000 to $99,999 | 0 (0.0%) | 19 (47.5%) |
| $100,000 to $299,999 | 0 (0.0%) | 0 (0.0%) |
| $300,000 to $499,999 | 0 (0.0%) | 0 (0.0%) |
| $500,000 to $749,999 | 0 (0.0%) | 0 (0.0%) |
| $750,000 to $999,999 | 0 (0.0%) | 0 (0.0%) |
| $1,000,000 or more | 0 (0.0%) | 0 (0.0%) |
| Total | 0 (0.0%) | 40 (100.0%) |
Household Income by Mortgage Status in West York
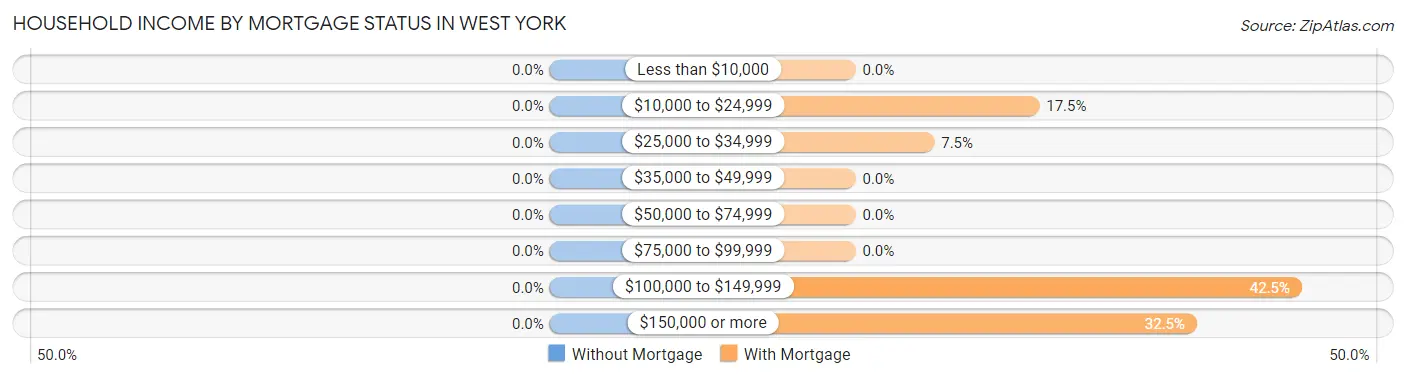
| Household Income | Without Mortgage | With Mortgage |
| Less than $10,000 | 0 (0.0%) | 0 (0.0%) |
| $10,000 to $24,999 | 0 (0.0%) | 7 (17.5%) |
| $25,000 to $34,999 | 0 (0.0%) | 3 (7.5%) |
| $35,000 to $49,999 | 0 (0.0%) | 0 (0.0%) |
| $50,000 to $74,999 | 0 (0.0%) | 0 (0.0%) |
| $75,000 to $99,999 | 0 (0.0%) | 0 (0.0%) |
| $100,000 to $149,999 | 0 (0.0%) | 17 (42.5%) |
| $150,000 or more | 0 (0.0%) | 13 (32.5%) |
| Total | 0 (0.0%) | 40 (100.0%) |
Property Value to Household Income Ratio in West York
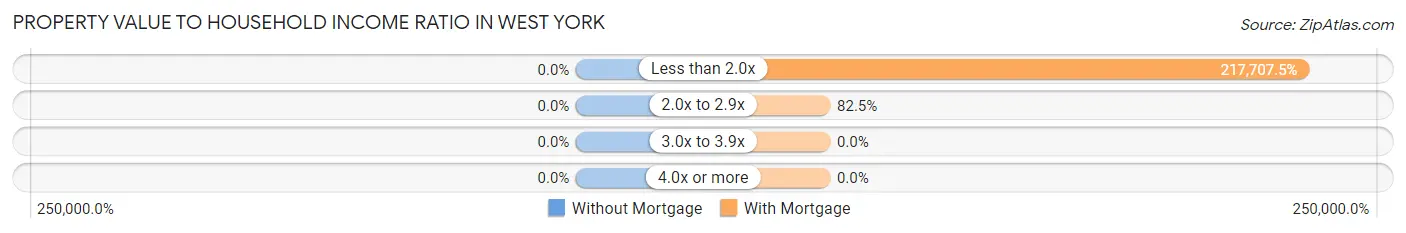
| Value-to-Income Ratio | Without Mortgage | With Mortgage |
| Less than 2.0x | 0 (0.0%) | 87,083 (217,707.5%) |
| 2.0x to 2.9x | 0 (0.0%) | 33 (82.5%) |
| 3.0x to 3.9x | 0 (0.0%) | 0 (0.0%) |
| 4.0x or more | 0 (0.0%) | 0 (0.0%) |
| Total | 0 (0.0%) | 40 (100.0%) |
Real Estate Taxes by Mortgage Status in West York
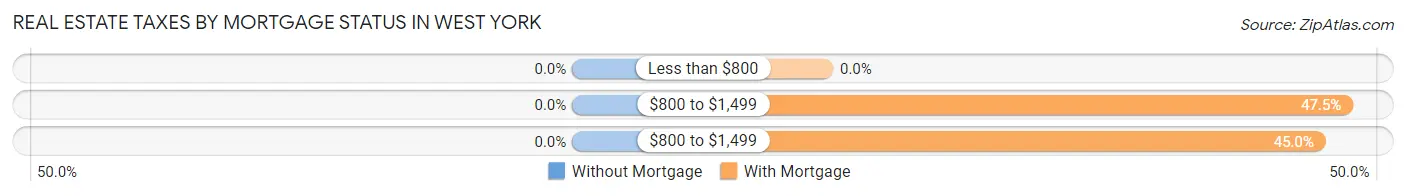
| Property Taxes | Without Mortgage | With Mortgage |
| Less than $800 | 0 (0.0%) | 0 (0.0%) |
| $800 to $1,499 | 0 (0.0%) | 19 (47.5%) |
| $800 to $1,499 | 0 (0.0%) | 18 (45.0%) |
| Total | 0 (0.0%) | 40 (100.0%) |
Health & Disability in West York
Health Insurance Coverage by Age in West York
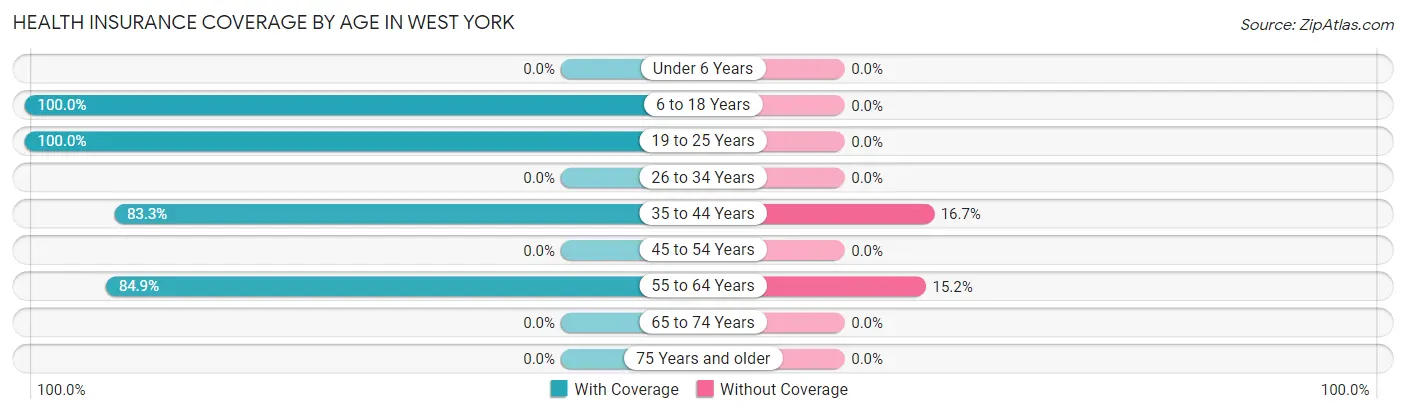
| Age Bracket | With Coverage | Without Coverage |
| Under 6 Years | 0 (0.0%) | 0 (0.0%) |
| 6 to 18 Years | 21 (100.0%) | 0 (0.0%) |
| 19 to 25 Years | 49 (100.0%) | 0 (0.0%) |
| 26 to 34 Years | 0 (0.0%) | 0 (0.0%) |
| 35 to 44 Years | 25 (83.3%) | 5 (16.7%) |
| 45 to 54 Years | 0 (0.0%) | 0 (0.0%) |
| 55 to 64 Years | 28 (84.9%) | 5 (15.1%) |
| 65 to 74 Years | 0 (0.0%) | 0 (0.0%) |
| 75 Years and older | 0 (0.0%) | 0 (0.0%) |
| Total | 123 (92.5%) | 10 (7.5%) |
Health Insurance Coverage by Citizenship Status in West York
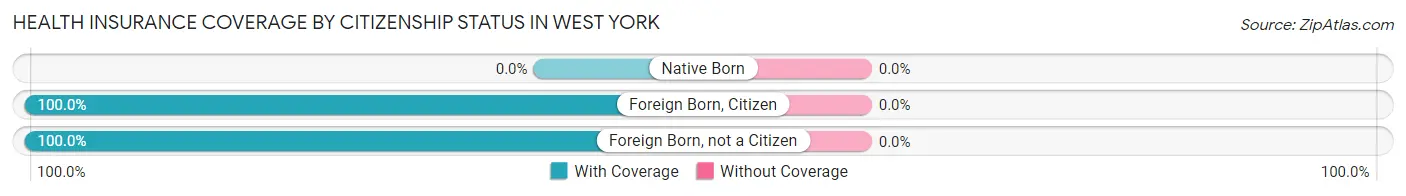
| Citizenship Status | With Coverage | Without Coverage |
| Native Born | 0 (0.0%) | 0 (0.0%) |
| Foreign Born, Citizen | 21 (100.0%) | 0 (0.0%) |
| Foreign Born, not a Citizen | 49 (100.0%) | 0 (0.0%) |
Health Insurance Coverage by Household Income in West York
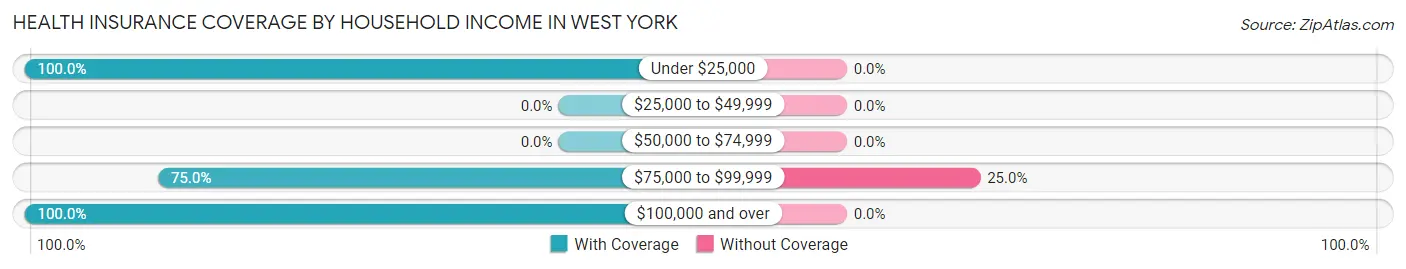
| Household Income | With Coverage | Without Coverage |
| Under $25,000 | 28 (100.0%) | 0 (0.0%) |
| $25,000 to $49,999 | 0 (0.0%) | 0 (0.0%) |
| $50,000 to $74,999 | 0 (0.0%) | 0 (0.0%) |
| $75,000 to $99,999 | 30 (75.0%) | 10 (25.0%) |
| $100,000 and over | 65 (100.0%) | 0 (0.0%) |
Public vs Private Health Insurance Coverage by Age in West York
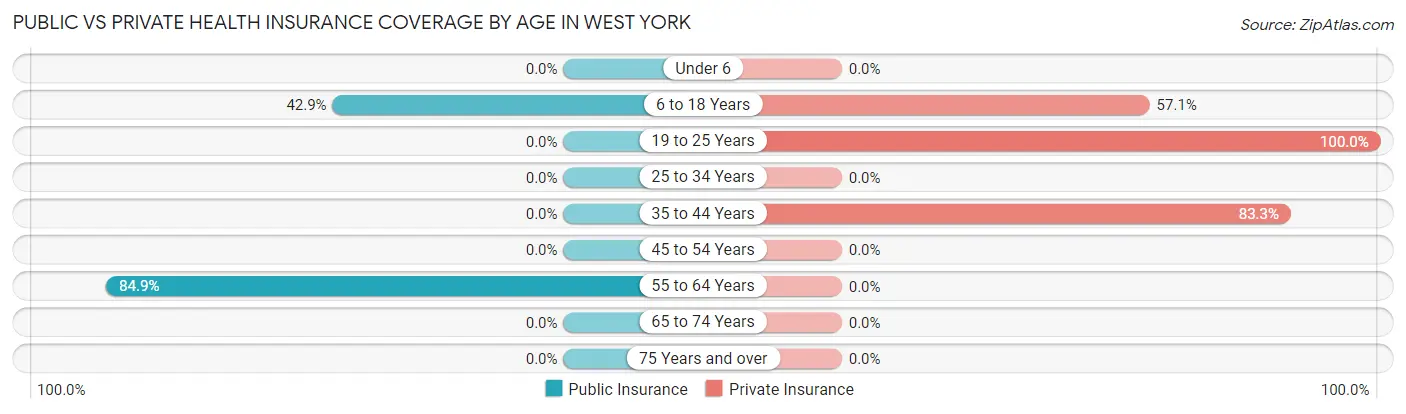
| Age Bracket | Public Insurance | Private Insurance |
| Under 6 | 0 (0.0%) | 0 (0.0%) |
| 6 to 18 Years | 9 (42.9%) | 12 (57.1%) |
| 19 to 25 Years | 0 (0.0%) | 49 (100.0%) |
| 25 to 34 Years | 0 (0.0%) | 0 (0.0%) |
| 35 to 44 Years | 0 (0.0%) | 25 (83.3%) |
| 45 to 54 Years | 0 (0.0%) | 0 (0.0%) |
| 55 to 64 Years | 28 (84.9%) | 0 (0.0%) |
| 65 to 74 Years | 0 (0.0%) | 0 (0.0%) |
| 75 Years and over | 0 (0.0%) | 0 (0.0%) |
| Total | 37 (27.8%) | 86 (64.7%) |
Disability Status by Sex by Age in West York
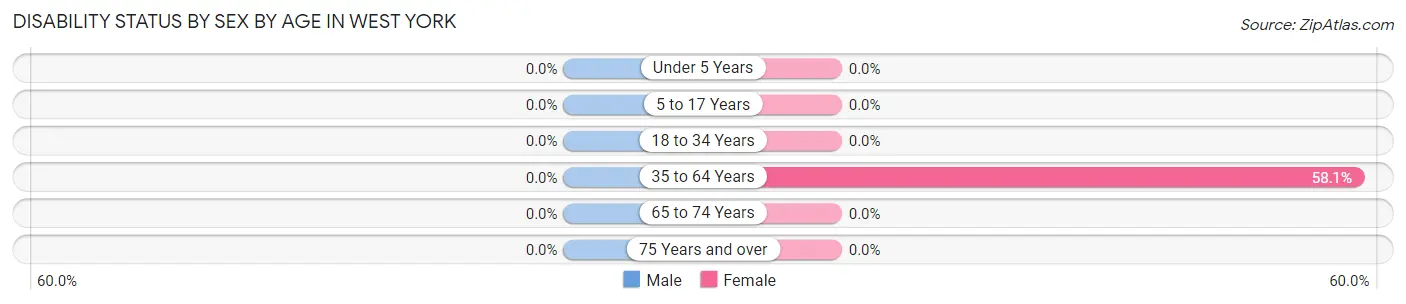
| Age Bracket | Male | Female |
| Under 5 Years | 0 (0.0%) | 0 (0.0%) |
| 5 to 17 Years | 0 (0.0%) | 0 (0.0%) |
| 18 to 34 Years | 0 (0.0%) | 0 (0.0%) |
| 35 to 64 Years | 0 (0.0%) | 25 (58.1%) |
| 65 to 74 Years | 0 (0.0%) | 0 (0.0%) |
| 75 Years and over | 0 (0.0%) | 0 (0.0%) |
Disability Class by Sex by Age in West York
Disability Class: Hearing Difficulty
| Age Bracket | Male | Female |
| Under 5 Years | 0 (0.0%) | 0 (0.0%) |
| 5 to 17 Years | 0 (0.0%) | 0 (0.0%) |
| 18 to 34 Years | 0 (0.0%) | 0 (0.0%) |
| 35 to 64 Years | 0 (0.0%) | 0 (0.0%) |
| 65 to 74 Years | 0 (0.0%) | 0 (0.0%) |
| 75 Years and over | 0 (0.0%) | 0 (0.0%) |
Disability Class: Vision Difficulty
| Age Bracket | Male | Female |
| Under 5 Years | 0 (0.0%) | 0 (0.0%) |
| 5 to 17 Years | 0 (0.0%) | 0 (0.0%) |
| 18 to 34 Years | 0 (0.0%) | 0 (0.0%) |
| 35 to 64 Years | 0 (0.0%) | 0 (0.0%) |
| 65 to 74 Years | 0 (0.0%) | 0 (0.0%) |
| 75 Years and over | 0 (0.0%) | 0 (0.0%) |
Disability Class: Cognitive Difficulty
| Age Bracket | Male | Female |
| 5 to 17 Years | 0 (0.0%) | 0 (0.0%) |
| 18 to 34 Years | 0 (0.0%) | 0 (0.0%) |
| 35 to 64 Years | 0 (0.0%) | 18 (41.9%) |
| 65 to 74 Years | 0 (0.0%) | 0 (0.0%) |
| 75 Years and over | 0 (0.0%) | 0 (0.0%) |
Disability Class: Ambulatory Difficulty
| Age Bracket | Male | Female |
| 5 to 17 Years | 0 (0.0%) | 0 (0.0%) |
| 18 to 34 Years | 0 (0.0%) | 0 (0.0%) |
| 35 to 64 Years | 0 (0.0%) | 25 (58.1%) |
| 65 to 74 Years | 0 (0.0%) | 0 (0.0%) |
| 75 Years and over | 0 (0.0%) | 0 (0.0%) |
Disability Class: Self-Care Difficulty
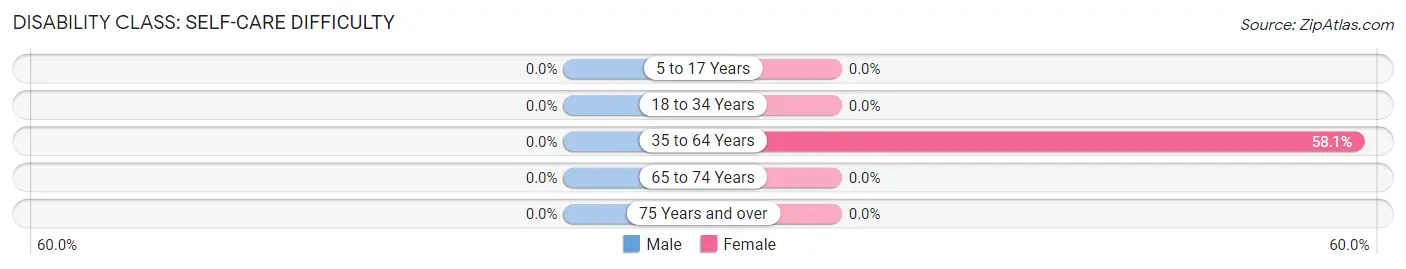
| Age Bracket | Male | Female |
| 5 to 17 Years | 0 (0.0%) | 0 (0.0%) |
| 18 to 34 Years | 0 (0.0%) | 0 (0.0%) |
| 35 to 64 Years | 0 (0.0%) | 25 (58.1%) |
| 65 to 74 Years | 0 (0.0%) | 0 (0.0%) |
| 75 Years and over | 0 (0.0%) | 0 (0.0%) |
Technology Access in West York
Computing Device Access in West York
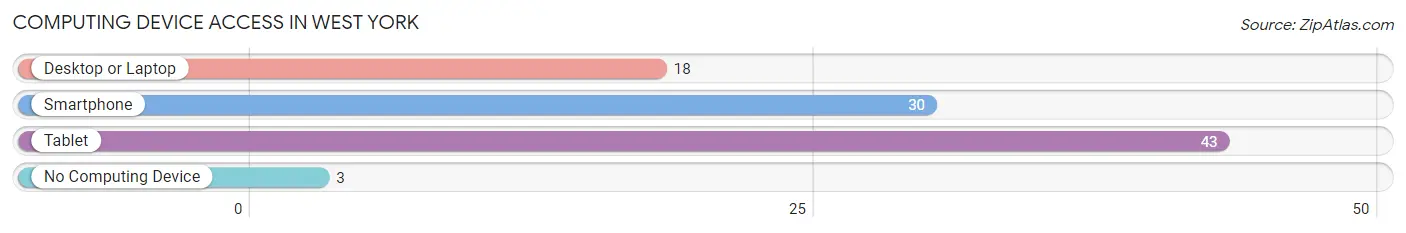
| Device Type | # Households | % Households |
| Desktop or Laptop | 18 | 31.0% |
| Smartphone | 30 | 51.7% |
| Tablet | 43 | 74.1% |
| No Computing Device | 3 | 5.2% |
| Total | 58 | 100.0% |
Internet Access in West York
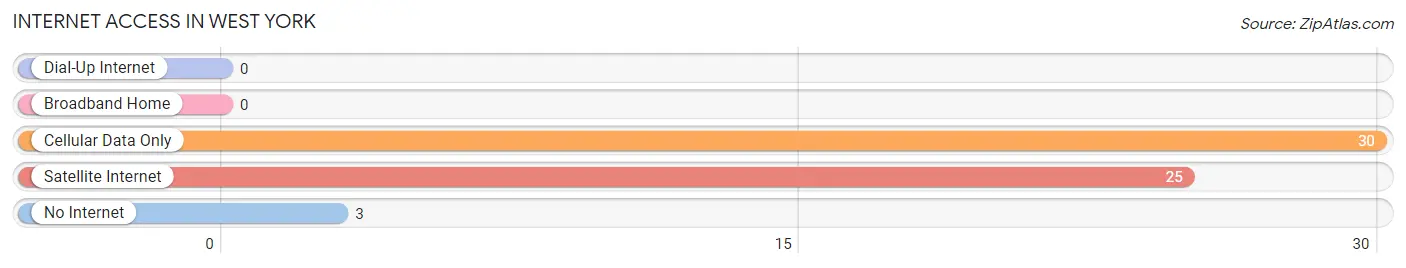
| Internet Type | # Households | % Households |
| Dial-Up Internet | 0 | 0.0% |
| Broadband Home | 0 | 0.0% |
| Cellular Data Only | 30 | 51.7% |
| Satellite Internet | 25 | 43.1% |
| No Internet | 3 | 5.2% |
| Total | 58 | 100.0% |
West York Summary
History
West York is a small village located in the state of Illinois, in the United States. It is located in the county of Stark, and is part of the Peoria metropolitan area. The village was founded in 1854, and was originally known as Westfield. The name was changed to West York in 1868.
The village was founded by a group of settlers from New York, who were looking for a place to settle and start a new life. The settlers were attracted to the area due to its fertile soil and abundant natural resources. The village was initially a farming community, and the settlers quickly established a thriving agricultural economy.
The village grew steadily over the years, and by the early 1900s, it had become a bustling community. The village was home to a variety of businesses, including a general store, a blacksmith shop, a post office, and a school. The village also had a number of churches, including the First Baptist Church, which was founded in 1871.
The village was also home to a number of notable people, including the famous author and poet, Carl Sandburg, who was born in West York in 1878.
Geography
West York is located in the state of Illinois, in the United States. It is located in the county of Stark, and is part of the Peoria metropolitan area. The village is situated on the banks of the Spoon River, and is surrounded by rolling hills and farmland.
The village is located approximately 30 miles south of Peoria, and is accessible via Interstate 74. The village is also located near the cities of Kewanee and Galva.
The village has a total area of 0.7 square miles, all of which is land. The village has a humid continental climate, with hot summers and cold winters.
Economy
West York is a small village, and its economy is largely based on agriculture. The village is home to a number of farms, which produce a variety of crops, including corn, soybeans, and wheat. The village also has a number of small businesses, including a general store, a post office, and a school.
The village is also home to a number of manufacturing companies, which produce a variety of products, including furniture, clothing, and automotive parts. The village is also home to a number of restaurants, which serve a variety of cuisines, including American, Mexican, and Italian.
Demographics
As of the 2010 census, the village had a population of 1,093. The population is predominantly white, with a small percentage of African Americans and Hispanics. The median age of the population is 43.7 years, and the median household income is $45,000.
The village has a high rate of homeownership, with over 80% of the population owning their own homes. The village also has a high rate of educational attainment, with over 90% of the population having at least a high school diploma.
Conclusion
West York is a small village located in the state of Illinois, in the United States. It is located in the county of Stark, and is part of the Peoria metropolitan area. The village was founded in 1854, and was originally known as Westfield. The village has a total area of 0.7 square miles, all of which is land. The village has a humid continental climate, with hot summers and cold winters.
The village has a population of 1,093, and is predominantly white, with a small percentage of African Americans and Hispanics. The village has a high rate of homeownership, with over 80% of the population owning their own homes. The village also has a high rate of educational attainment, with over 90% of the population having at least a high school diploma.
The village's economy is largely based on agriculture, with a number of farms producing a variety of crops. The village also has a number of small businesses, including a general store, a post office, and a school. The village is also home to a number of manufacturing companies, which produce a variety of products, including furniture, clothing, and automotive parts.
Common Questions
What is Per Capita Income in West York?
Per Capita income in West York is $27,156.
What is the Median Family Income in West York?
Median Family Income in West York is $99,000.
What is Inequality or Gini Index in West York?
Inequality or Gini Index in West York is 0.45.
What is the Total Population of West York?
Total Population of West York is 133.
What is the Total Male Population of West York?
Total Male Population of West York is 29.
What is the Total Female Population of West York?
Total Female Population of West York is 104.
What is the Ratio of Males per 100 Females in West York?
There are 27.88 Males per 100 Females in West York.
What is the Ratio of Females per 100 Males in West York?
There are 358.62 Females per 100 Males in West York.
What is the Median Population Age in West York?
Median Population Age in West York is 25.6 Years.
What is the Average Family Size in West York
Average Family Size in West York is 3.5 People.
What is the Average Household Size in West York
Average Household Size in West York is 2.3 People.
How Large is the Labor Force in West York?
There are 91 People in the Labor Forcein in West York.
What is the Percentage of People in the Labor Force in West York?
73.4% of People are in the Labor Force in West York.