Evans, GA Map & Demographics
Evans Map
Evans Overview
$47,760
PER CAPITA INCOME
$140,329
AVG FAMILY INCOME
$125,325
AVG HOUSEHOLD INCOME
39.6%
WAGE / INCOME GAP [ % ]
60.4¢/ $1
WAGE / INCOME GAP [ $ ]
0.37
INEQUALITY / GINI INDEX
37,456
TOTAL POPULATION
18,996
MALE POPULATION
18,460
FEMALE POPULATION
102.90
MALES / 100 FEMALES
97.18
FEMALES / 100 MALES
41.9
MEDIAN AGE
3.6
AVG FAMILY SIZE
3.2
AVG HOUSEHOLD SIZE
18,464
LABOR FORCE [ PEOPLE ]
62.4%
PERCENT IN LABOR FORCE
5.5%
UNEMPLOYMENT RATE
Evans Zip Codes
Evans Area Codes
Income in Evans
Income Overview in Evans
Per Capita Income in Evans is $47,760, while median incomes of families and households are $140,329 and $125,325 respectively.
| Characteristic | Number | Measure |
| Per Capita Income | 37,456 | $47,760 |
| Median Family Income | 9,255 | $140,329 |
| Mean Family Income | 9,255 | $152,962 |
| Median Household Income | 11,582 | $125,325 |
| Mean Household Income | 11,582 | $139,315 |
| Income Deficit | 9,255 | $0 |
| Wage / Income Gap (%) | 37,456 | 39.57% |
| Wage / Income Gap ($) | 37,456 | 60.43¢ per $1 |
| Gini / Inequality Index | 37,456 | 0.37 |
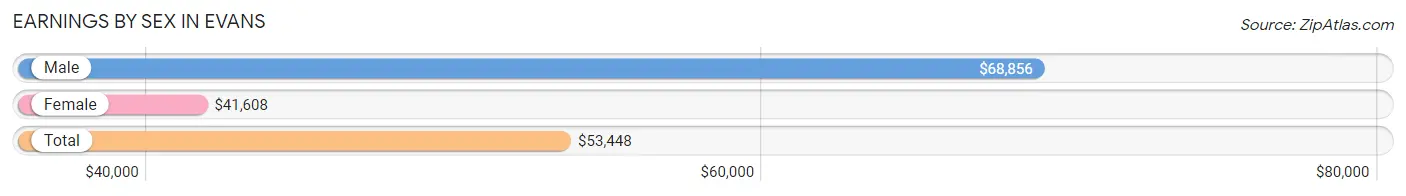
Earnings by Sex in Evans
Average Earnings in Evans are $53,448, $68,856 for men and $41,608 for women, a difference of 39.6%.
| Sex | Number | Average Earnings |
| Male | 10,334 (54.1%) | $68,856 |
| Female | 8,782 (45.9%) | $41,608 |
| Total | 19,116 (100.0%) | $53,448 |
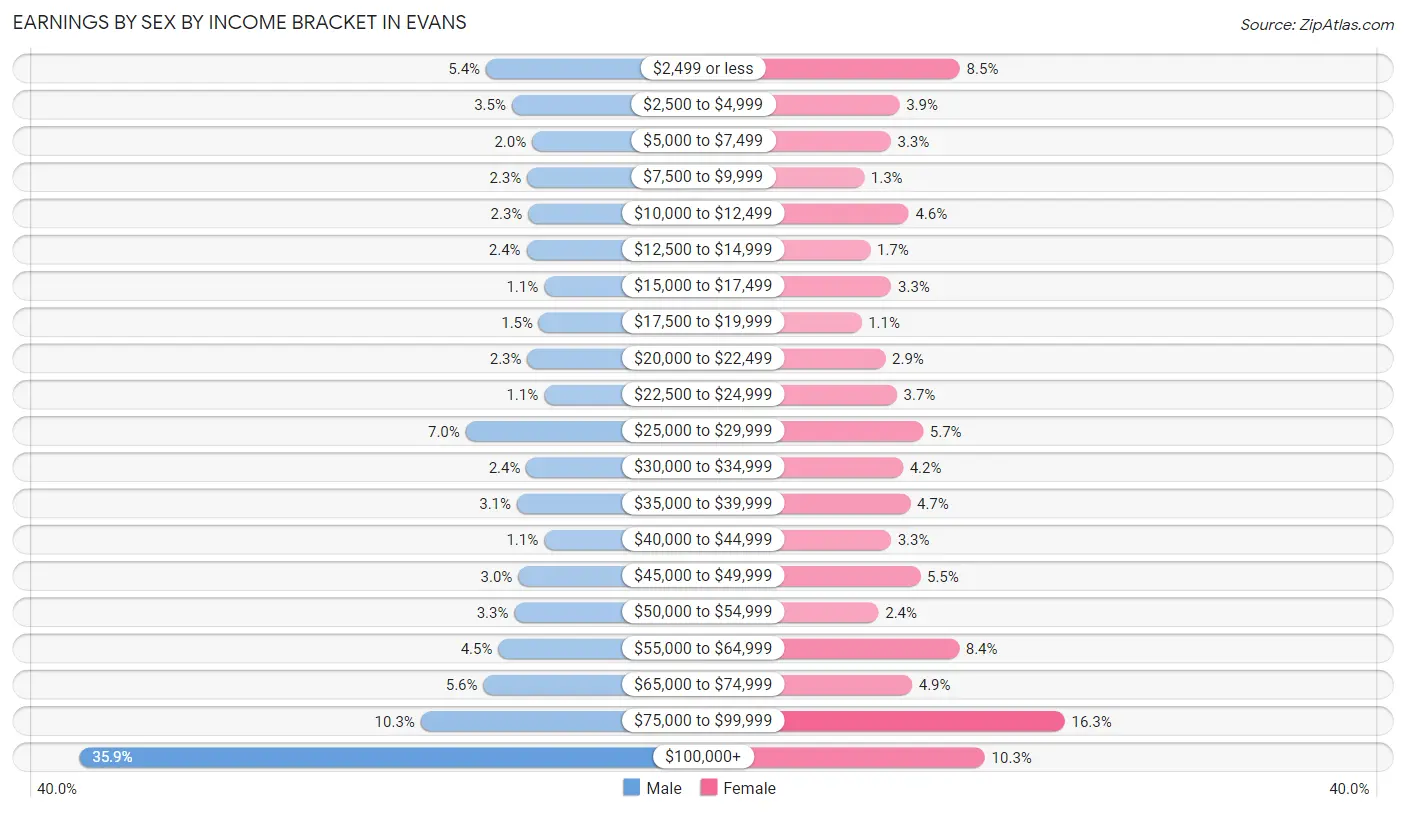
Earnings by Sex by Income Bracket in Evans
The most common earnings brackets in Evans are $100,000+ for men (3,710 | 35.9%) and $75,000 to $99,999 for women (1,433 | 16.3%).
| Income | Male | Female |
| $2,499 or less | 561 (5.4%) | 743 (8.5%) |
| $2,500 to $4,999 | 361 (3.5%) | 345 (3.9%) |
| $5,000 to $7,499 | 204 (2.0%) | 288 (3.3%) |
| $7,500 to $9,999 | 242 (2.3%) | 112 (1.3%) |
| $10,000 to $12,499 | 234 (2.3%) | 406 (4.6%) |
| $12,500 to $14,999 | 247 (2.4%) | 153 (1.7%) |
| $15,000 to $17,499 | 111 (1.1%) | 292 (3.3%) |
| $17,500 to $19,999 | 151 (1.5%) | 95 (1.1%) |
| $20,000 to $22,499 | 240 (2.3%) | 252 (2.9%) |
| $22,500 to $24,999 | 111 (1.1%) | 328 (3.7%) |
| $25,000 to $29,999 | 718 (7.0%) | 501 (5.7%) |
| $30,000 to $34,999 | 248 (2.4%) | 368 (4.2%) |
| $35,000 to $39,999 | 321 (3.1%) | 416 (4.7%) |
| $40,000 to $44,999 | 111 (1.1%) | 289 (3.3%) |
| $45,000 to $49,999 | 311 (3.0%) | 482 (5.5%) |
| $50,000 to $54,999 | 341 (3.3%) | 207 (2.4%) |
| $55,000 to $64,999 | 465 (4.5%) | 737 (8.4%) |
| $65,000 to $74,999 | 581 (5.6%) | 428 (4.9%) |
| $75,000 to $99,999 | 1,066 (10.3%) | 1,433 (16.3%) |
| $100,000+ | 3,710 (35.9%) | 907 (10.3%) |
| Total | 10,334 (100.0%) | 8,782 (100.0%) |
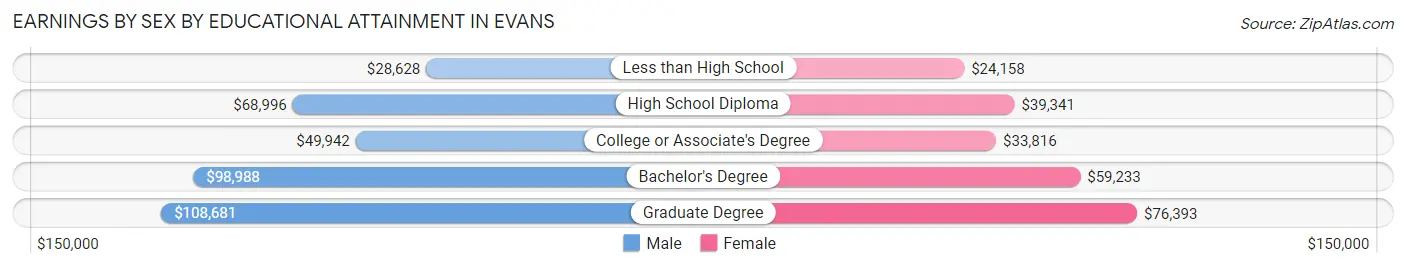
Earnings by Sex by Educational Attainment in Evans
Average earnings in Evans are $83,131 for men and $48,739 for women, a difference of 41.4%. Men with an educational attainment of graduate degree enjoy the highest average annual earnings of $108,681, while those with less than high school education earn the least with $28,628. Women with an educational attainment of graduate degree earn the most with the average annual earnings of $76,393, while those with less than high school education have the smallest earnings of $24,158.
| Educational Attainment | Male Income | Female Income |
| Less than High School | $28,628 | $24,158 |
| High School Diploma | $68,996 | $39,341 |
| College or Associate's Degree | $49,942 | $33,816 |
| Bachelor's Degree | $98,988 | $59,233 |
| Graduate Degree | $108,681 | $76,393 |
| Total | $83,131 | $48,739 |
Family Income in Evans
Family Income Brackets in Evans
According to the Evans family income data, there are 2,425 families falling into the $100,000 to $149,999 income range, which is the most common income bracket and makes up 26.2% of all families. Conversely, the $10,000 to $14,999 income bracket is the least frequent group with only 19 families (0.2%) belonging to this category.
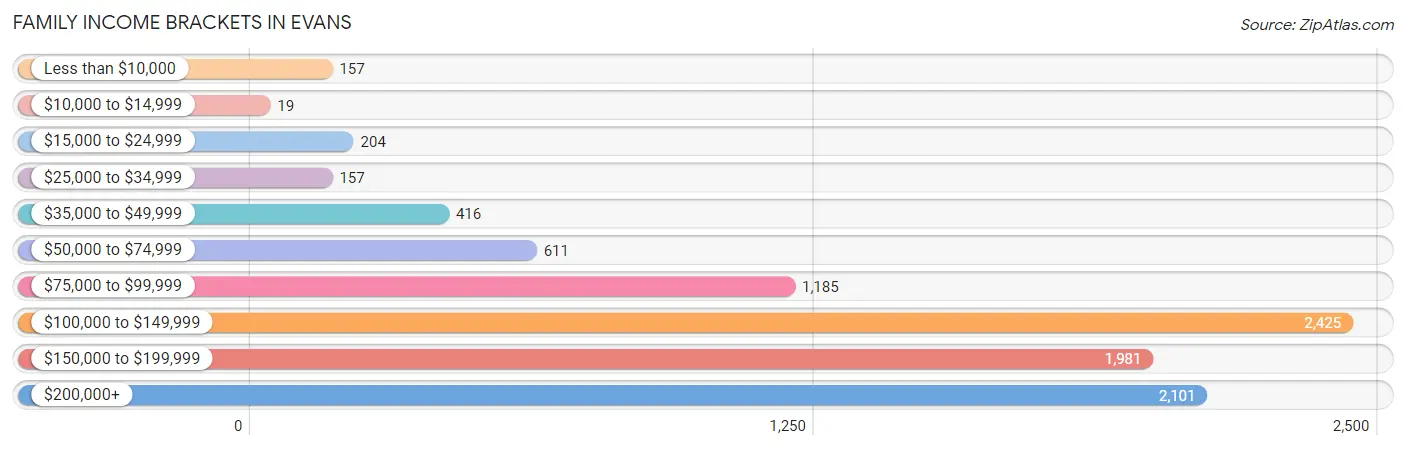
| Income Bracket | # Families | % Families |
| Less than $10,000 | 157 | 1.7% |
| $10,000 to $14,999 | 19 | 0.2% |
| $15,000 to $24,999 | 204 | 2.2% |
| $25,000 to $34,999 | 157 | 1.7% |
| $35,000 to $49,999 | 416 | 4.5% |
| $50,000 to $74,999 | 611 | 6.6% |
| $75,000 to $99,999 | 1,185 | 12.8% |
| $100,000 to $149,999 | 2,425 | 26.2% |
| $150,000 to $199,999 | 1,981 | 21.4% |
| $200,000+ | 2,101 | 22.7% |
Family Income by Famaliy Size in Evans
5-person families (773 | 8.4%) account for the highest median family income in Evans with $167,450 per family, while 2-person families (4,102 | 44.3%) have the highest median income of $63,428 per family member.
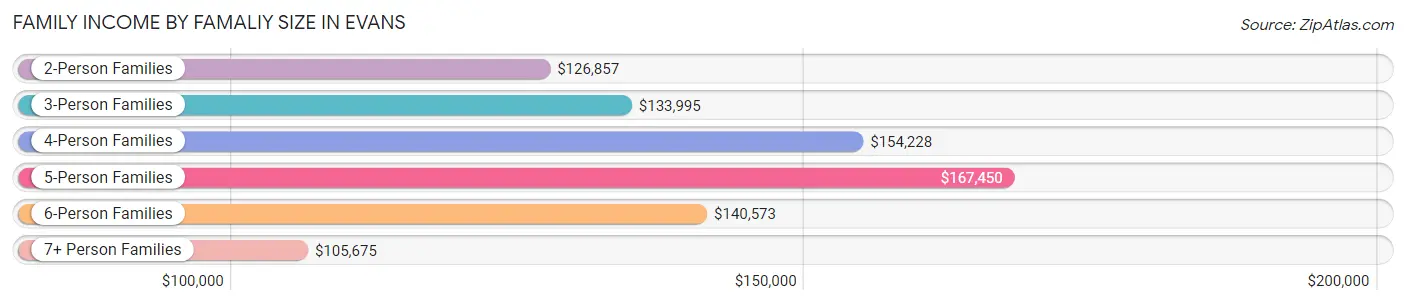
| Income Bracket | # Families | Median Income |
| 2-Person Families | 4,102 (44.3%) | $126,857 |
| 3-Person Families | 2,105 (22.7%) | $133,995 |
| 4-Person Families | 1,917 (20.7%) | $154,228 |
| 5-Person Families | 773 (8.4%) | $167,450 |
| 6-Person Families | 257 (2.8%) | $140,573 |
| 7+ Person Families | 101 (1.1%) | $105,675 |
| Total | 9,255 (100.0%) | $140,329 |
Family Income by Number of Earners in Evans
The median family income in Evans is $140,329, with families comprising 3+ earners (1,144) having the highest median family income of $189,651, while families with no earners (1,469) have the lowest median family income of $85,688, accounting for 12.4% and 15.9% of families, respectively.
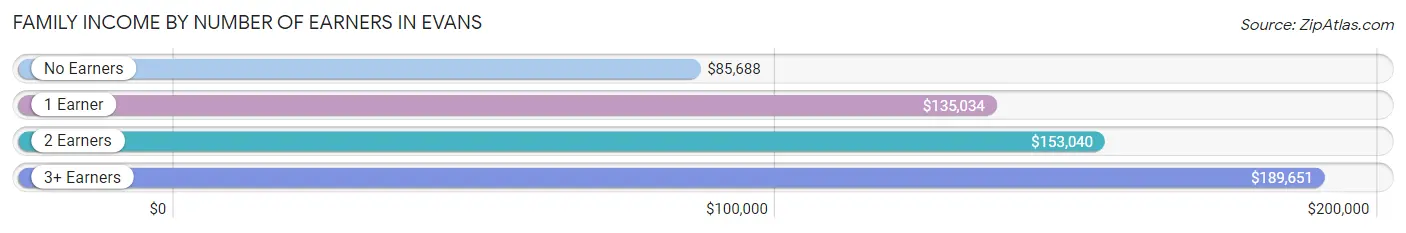
| Number of Earners | # Families | Median Income |
| No Earners | 1,469 (15.9%) | $85,688 |
| 1 Earner | 2,777 (30.0%) | $135,034 |
| 2 Earners | 3,865 (41.8%) | $153,040 |
| 3+ Earners | 1,144 (12.4%) | $189,651 |
| Total | 9,255 (100.0%) | $140,329 |
Household Income in Evans
Household Income Brackets in Evans
With 2,733 households falling in the category, the $100,000 to $149,999 income range is the most frequent in Evans, accounting for 23.6% of all households. In contrast, only 69 households (0.6%) fall into the $10,000 to $14,999 income bracket, making it the least populous group.
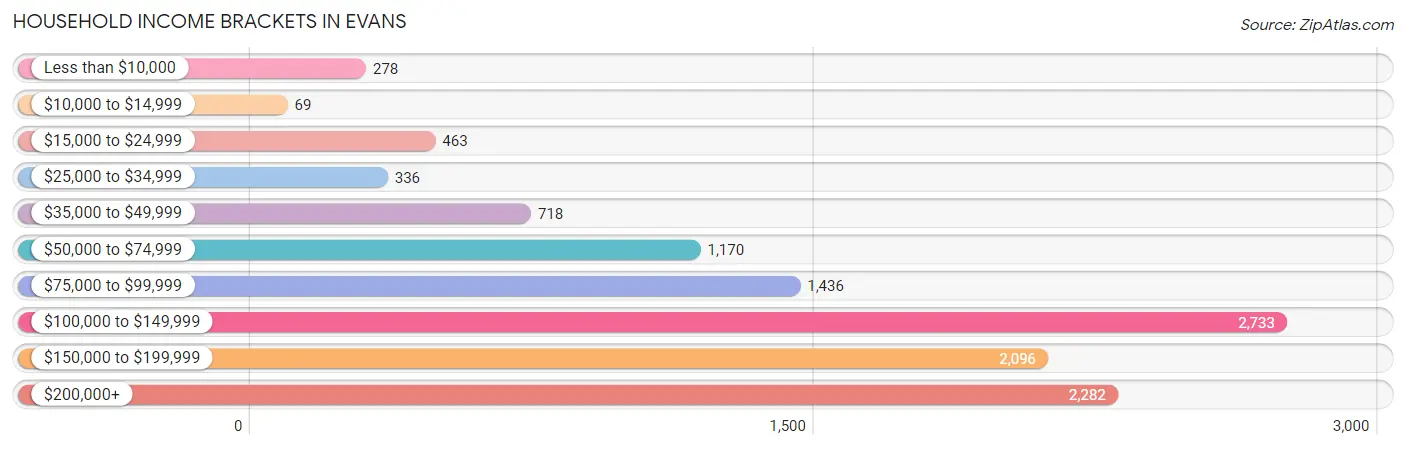
| Income Bracket | # Households | % Households |
| Less than $10,000 | 278 | 2.4% |
| $10,000 to $14,999 | 69 | 0.6% |
| $15,000 to $24,999 | 463 | 4.0% |
| $25,000 to $34,999 | 336 | 2.9% |
| $35,000 to $49,999 | 718 | 6.2% |
| $50,000 to $74,999 | 1,170 | 10.1% |
| $75,000 to $99,999 | 1,436 | 12.4% |
| $100,000 to $149,999 | 2,733 | 23.6% |
| $150,000 to $199,999 | 2,096 | 18.1% |
| $200,000+ | 2,282 | 19.7% |
Household Income by Householder Age in Evans
The median household income in Evans is $125,325, with the highest median household income of $156,208 found in the 45 to 64 years age bracket for the primary householder. A total of 4,501 households (38.9%) fall into this category. Meanwhile, the 65+ years age bracket for the primary householder has the lowest median household income of $86,641, with 3,750 households (32.4%) in this group.
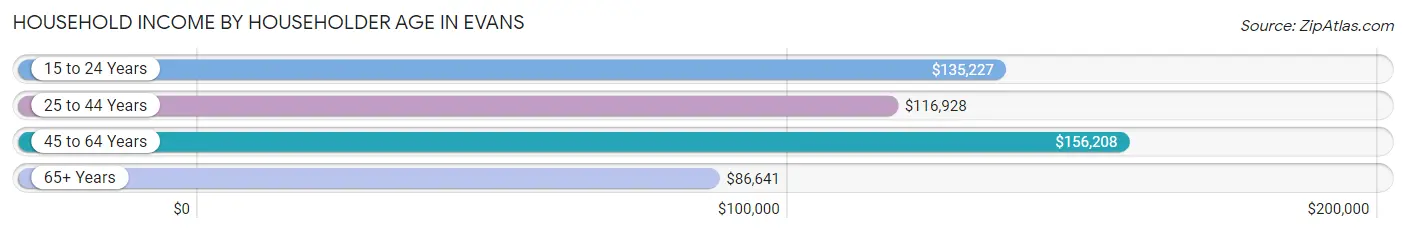
| Income Bracket | # Households | Median Income |
| 15 to 24 Years | 140 (1.2%) | $135,227 |
| 25 to 44 Years | 3,191 (27.6%) | $116,928 |
| 45 to 64 Years | 4,501 (38.9%) | $156,208 |
| 65+ Years | 3,750 (32.4%) | $86,641 |
| Total | 11,582 (100.0%) | $125,325 |
Poverty in Evans
Income Below Poverty by Sex and Age in Evans
With 6.1% poverty level for males and 5.6% for females among the residents of Evans, 15 year old males and 12 to 14 year old females are the most vulnerable to poverty, with 86 males (24.7%) and 97 females (17.4%) in their respective age groups living below the poverty level.
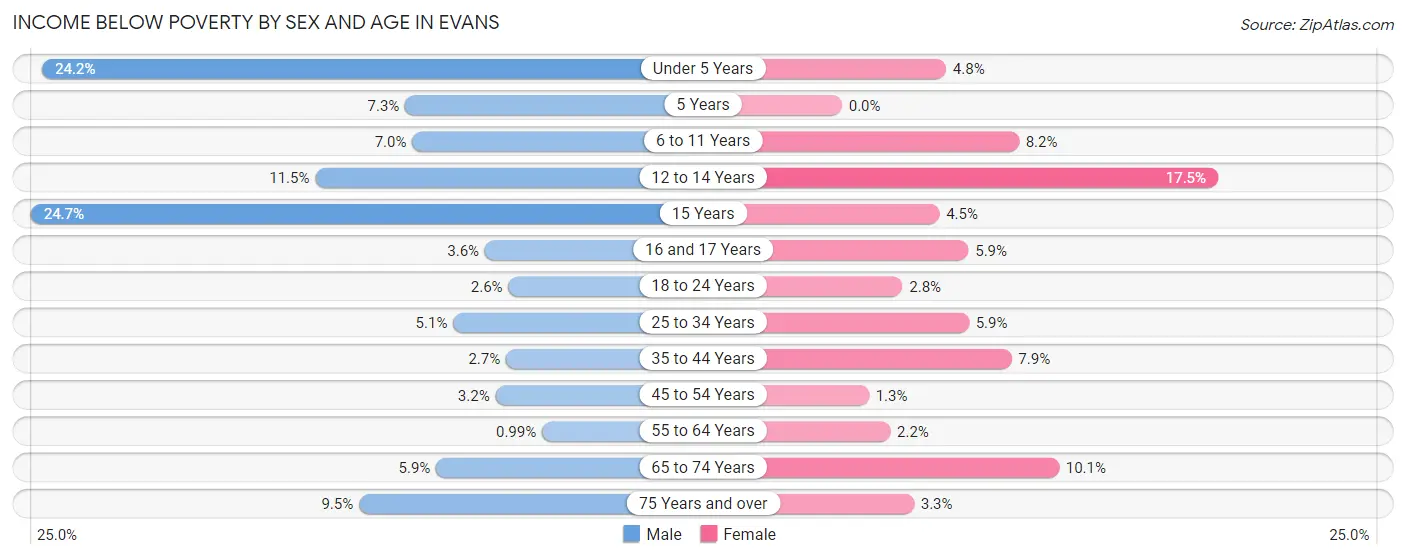
| Age Bracket | Male | Female |
| Under 5 Years | 262 (24.2%) | 41 (4.8%) |
| 5 Years | 16 (7.3%) | 0 (0.0%) |
| 6 to 11 Years | 112 (7.0%) | 133 (8.2%) |
| 12 to 14 Years | 105 (11.5%) | 97 (17.4%) |
| 15 Years | 86 (24.7%) | 20 (4.5%) |
| 16 and 17 Years | 24 (3.6%) | 44 (5.9%) |
| 18 to 24 Years | 48 (2.5%) | 31 (2.8%) |
| 25 to 34 Years | 86 (5.1%) | 106 (5.9%) |
| 35 to 44 Years | 57 (2.7%) | 181 (7.9%) |
| 45 to 54 Years | 88 (3.2%) | 40 (1.3%) |
| 55 to 64 Years | 21 (1.0%) | 47 (2.2%) |
| 65 to 74 Years | 135 (5.9%) | 241 (10.1%) |
| 75 Years and over | 107 (9.5%) | 33 (3.3%) |
| Total | 1,147 (6.1%) | 1,014 (5.6%) |
Income Above Poverty by Sex and Age in Evans
According to the poverty statistics in Evans, males aged 55 to 64 years and females aged 5 years are the age groups that are most secure financially, with 99.0% of males and 100.0% of females in these age groups living above the poverty line.
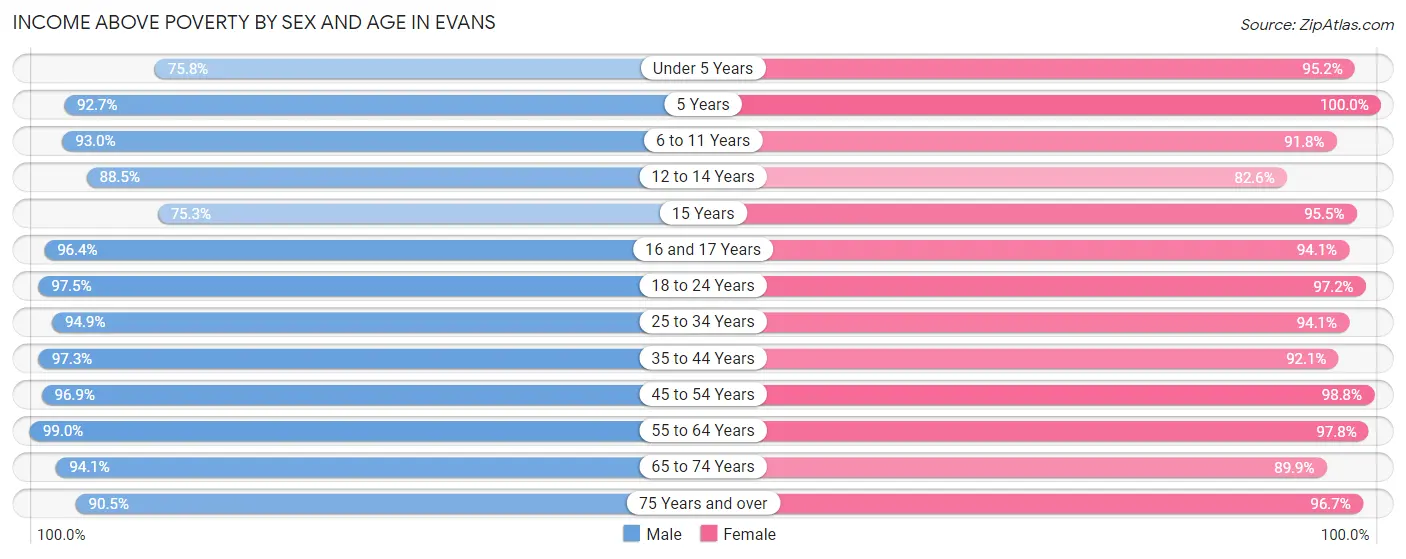
| Age Bracket | Male | Female |
| Under 5 Years | 821 (75.8%) | 808 (95.2%) |
| 5 Years | 202 (92.7%) | 132 (100.0%) |
| 6 to 11 Years | 1,485 (93.0%) | 1,486 (91.8%) |
| 12 to 14 Years | 807 (88.5%) | 459 (82.6%) |
| 15 Years | 262 (75.3%) | 422 (95.5%) |
| 16 and 17 Years | 636 (96.4%) | 705 (94.1%) |
| 18 to 24 Years | 1,836 (97.5%) | 1,073 (97.2%) |
| 25 to 34 Years | 1,597 (94.9%) | 1,693 (94.1%) |
| 35 to 44 Years | 2,089 (97.3%) | 2,120 (92.1%) |
| 45 to 54 Years | 2,707 (96.9%) | 3,164 (98.8%) |
| 55 to 64 Years | 2,097 (99.0%) | 2,055 (97.8%) |
| 65 to 74 Years | 2,155 (94.1%) | 2,152 (89.9%) |
| 75 Years and over | 1,022 (90.5%) | 955 (96.7%) |
| Total | 17,716 (93.9%) | 17,224 (94.4%) |
Income Below Poverty Among Married-Couple Families in Evans
The poverty statistics for married-couple families in Evans show that 2.5% or 193 of the total 7,872 families live below the poverty line. Families with 5 or more children have the highest poverty rate of 28.6%, comprising of 20 families. On the other hand, families with 3 or 4 children have the lowest poverty rate of 0.0%, which includes 0 families.
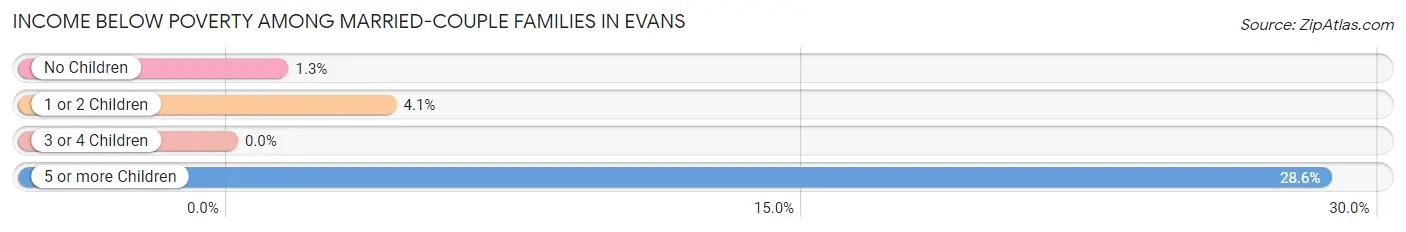
| Children | Above Poverty | Below Poverty |
| No Children | 4,328 (98.7%) | 58 (1.3%) |
| 1 or 2 Children | 2,660 (95.9%) | 115 (4.1%) |
| 3 or 4 Children | 641 (100.0%) | 0 (0.0%) |
| 5 or more Children | 50 (71.4%) | 20 (28.6%) |
| Total | 7,679 (97.6%) | 193 (2.5%) |
Income Below Poverty Among Single-Parent Households in Evans
According to the poverty data in Evans, 3.7% or 15 single-father households and 17.3% or 169 single-mother households are living below the poverty line. Among single-father households, those with 1 or 2 children have the highest poverty rate, with 15 households (9.1%) experiencing poverty. Likewise, among single-mother households, those with 3 or 4 children have the highest poverty rate, with 80 households (65.6%) falling below the poverty line.
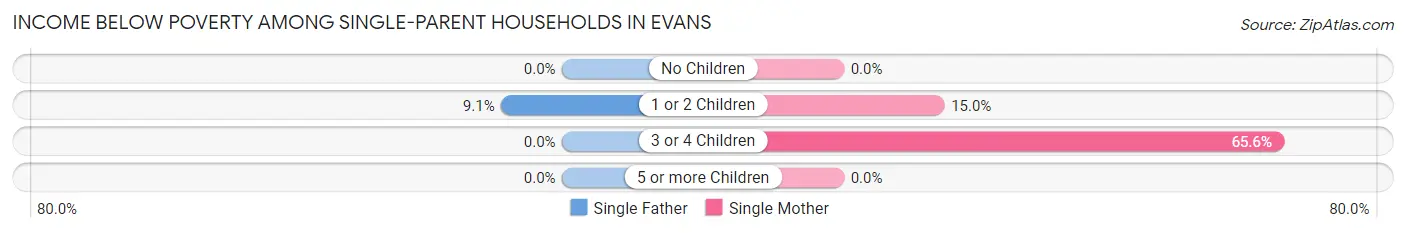
| Children | Single Father | Single Mother |
| No Children | 0 (0.0%) | 0 (0.0%) |
| 1 or 2 Children | 15 (9.1%) | 89 (15.0%) |
| 3 or 4 Children | 0 (0.0%) | 80 (65.6%) |
| 5 or more Children | 0 (0.0%) | 0 (0.0%) |
| Total | 15 (3.7%) | 169 (17.3%) |
Income Below Poverty Among Married-Couple vs Single-Parent Households in Evans
The poverty data for Evans shows that 193 of the married-couple family households (2.5%) and 184 of the single-parent households (13.3%) are living below the poverty level. Within the married-couple family households, those with 5 or more children have the highest poverty rate, with 20 households (28.6%) falling below the poverty line. Among the single-parent households, those with 3 or 4 children have the highest poverty rate, with 80 household (53.0%) living below poverty.
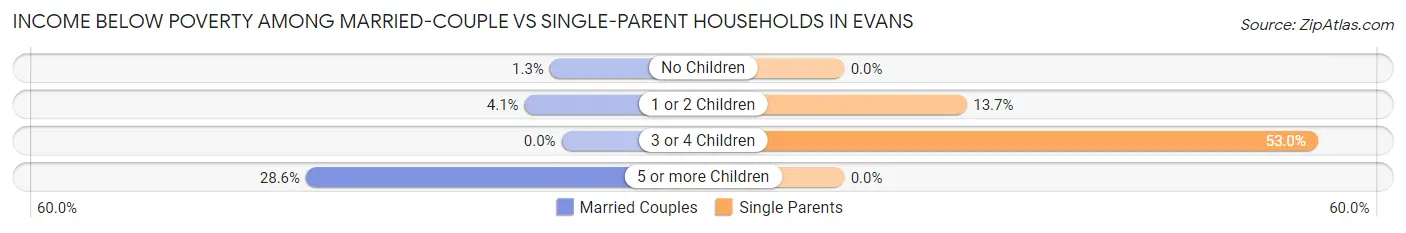
| Children | Married-Couple Families | Single-Parent Households |
| No Children | 58 (1.3%) | 0 (0.0%) |
| 1 or 2 Children | 115 (4.1%) | 104 (13.7%) |
| 3 or 4 Children | 0 (0.0%) | 80 (53.0%) |
| 5 or more Children | 20 (28.6%) | 0 (0.0%) |
| Total | 193 (2.5%) | 184 (13.3%) |
Race in Evans
The most populous races in Evans are White / Caucasian (28,454 | 76.0%), Black / African American (3,930 | 10.5%), and Hispanic or Latino (2,904 | 7.7%).
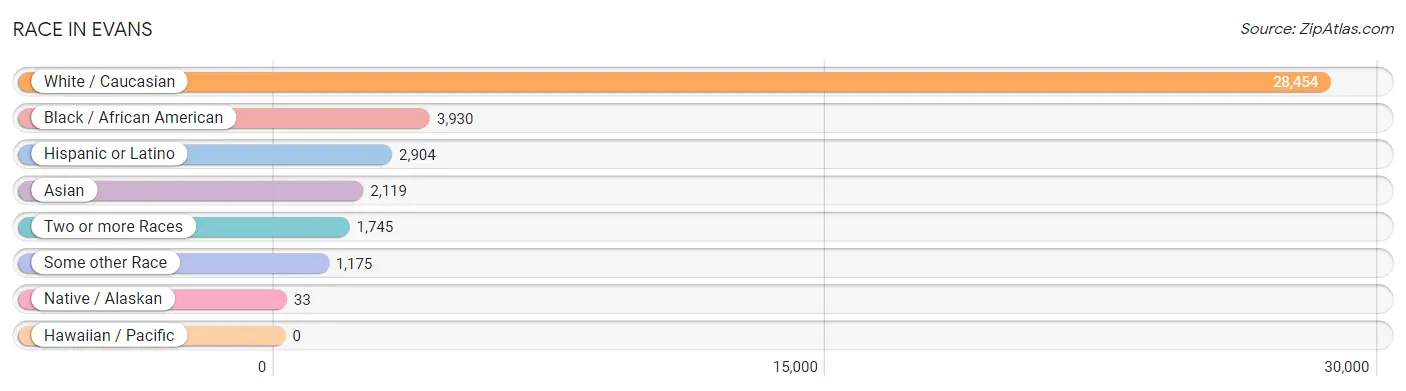
| Race | # Population | % Population |
| Asian | 2,119 | 5.7% |
| Black / African American | 3,930 | 10.5% |
| Hawaiian / Pacific | 0 | 0.0% |
| Hispanic or Latino | 2,904 | 7.7% |
| Native / Alaskan | 33 | 0.1% |
| White / Caucasian | 28,454 | 76.0% |
| Two or more Races | 1,745 | 4.7% |
| Some other Race | 1,175 | 3.1% |
| Total | 37,456 | 100.0% |
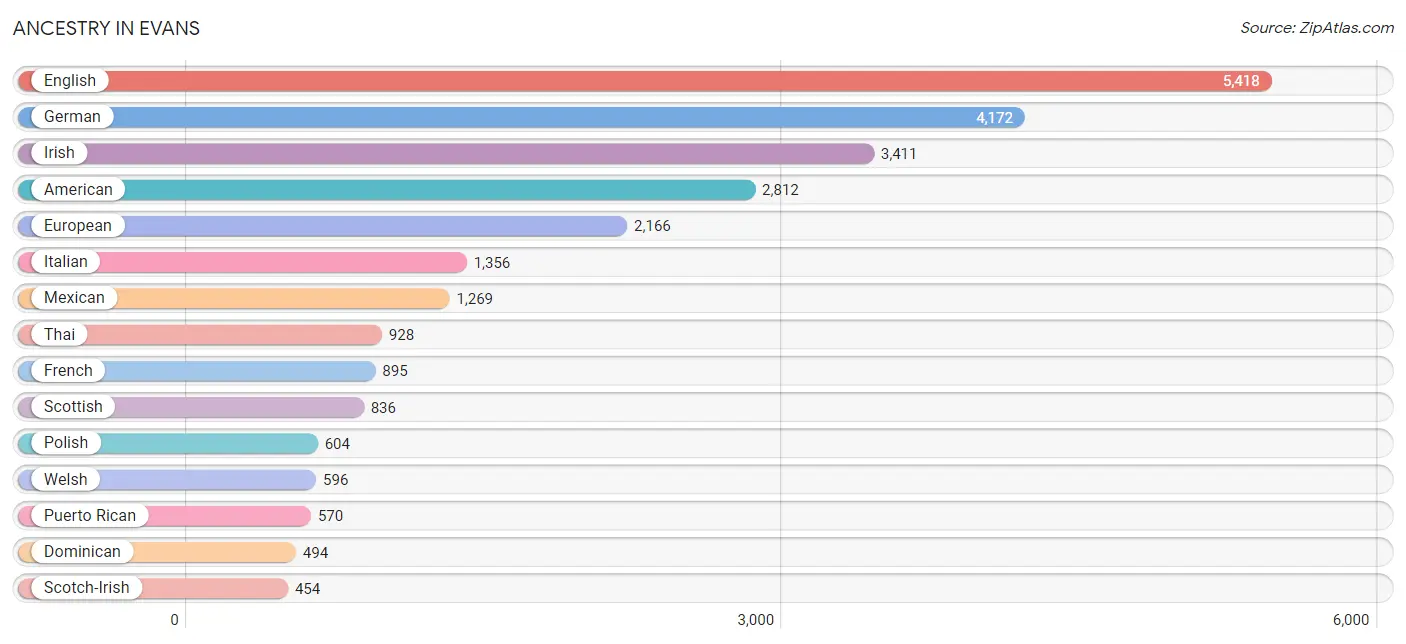
Ancestry in Evans
The most populous ancestries reported in Evans are English (5,418 | 14.5%), German (4,172 | 11.1%), Irish (3,411 | 9.1%), American (2,812 | 7.5%), and European (2,166 | 5.8%), together accounting for 48.0% of all Evans residents.
| Ancestry | # Population | % Population |
| African | 101 | 0.3% |
| Alaska Native | 12 | 0.0% |
| American | 2,812 | 7.5% |
| Arab | 270 | 0.7% |
| Armenian | 29 | 0.1% |
| Austrian | 123 | 0.3% |
| Bahamian | 22 | 0.1% |
| Bhutanese | 82 | 0.2% |
| British | 361 | 1.0% |
| Burmese | 433 | 1.2% |
| Canadian | 43 | 0.1% |
| Celtic | 13 | 0.0% |
| Central American | 167 | 0.4% |
| Cherokee | 179 | 0.5% |
| Colombian | 70 | 0.2% |
| Costa Rican | 63 | 0.2% |
| Creek | 65 | 0.2% |
| Croatian | 37 | 0.1% |
| Cuban | 61 | 0.2% |
| Czech | 154 | 0.4% |
| Czechoslovakian | 26 | 0.1% |
| Danish | 183 | 0.5% |
| Dominican | 494 | 1.3% |
| Dutch | 225 | 0.6% |
| Eastern European | 16 | 0.0% |
| Egyptian | 143 | 0.4% |
| English | 5,418 | 14.5% |
| European | 2,166 | 5.8% |
| Filipino | 32 | 0.1% |
| Finnish | 29 | 0.1% |
| French | 895 | 2.4% |
| French Canadian | 12 | 0.0% |
| German | 4,172 | 11.1% |
| Ghanaian | 49 | 0.1% |
| Greek | 94 | 0.3% |
| Guamanian / Chamorro | 41 | 0.1% |
| Haitian | 22 | 0.1% |
| Honduran | 32 | 0.1% |
| Hungarian | 24 | 0.1% |
| Indian (Asian) | 188 | 0.5% |
| Iranian | 16 | 0.0% |
| Irish | 3,411 | 9.1% |
| Israeli | 38 | 0.1% |
| Italian | 1,356 | 3.6% |
| Jamaican | 20 | 0.1% |
| Korean | 304 | 0.8% |
| Lebanese | 93 | 0.3% |
| Lithuanian | 15 | 0.0% |
| Macedonian | 7 | 0.0% |
| Mexican | 1,269 | 3.4% |
| Native Hawaiian | 95 | 0.3% |
| Navajo | 20 | 0.1% |
| Northern European | 25 | 0.1% |
| Norwegian | 233 | 0.6% |
| Palestinian | 34 | 0.1% |
| Panamanian | 72 | 0.2% |
| Peruvian | 29 | 0.1% |
| Polish | 604 | 1.6% |
| Portuguese | 86 | 0.2% |
| Puerto Rican | 570 | 1.5% |
| Romanian | 55 | 0.2% |
| Russian | 214 | 0.6% |
| Scandinavian | 104 | 0.3% |
| Scotch-Irish | 454 | 1.2% |
| Scottish | 836 | 2.2% |
| Slavic | 41 | 0.1% |
| Slovak | 48 | 0.1% |
| Slovene | 9 | 0.0% |
| South African | 23 | 0.1% |
| South American | 177 | 0.5% |
| Spaniard | 110 | 0.3% |
| Spanish | 50 | 0.1% |
| Sri Lankan | 418 | 1.1% |
| Subsaharan African | 214 | 0.6% |
| Swedish | 102 | 0.3% |
| Swiss | 290 | 0.8% |
| Syrian | 9 | 0.0% |
| Thai | 928 | 2.5% |
| Trinidadian and Tobagonian | 27 | 0.1% |
| Ukrainian | 50 | 0.1% |
| Venezuelan | 57 | 0.2% |
| Welsh | 596 | 1.6% |
| West Indian | 6 | 0.0% | View All 83 Rows |
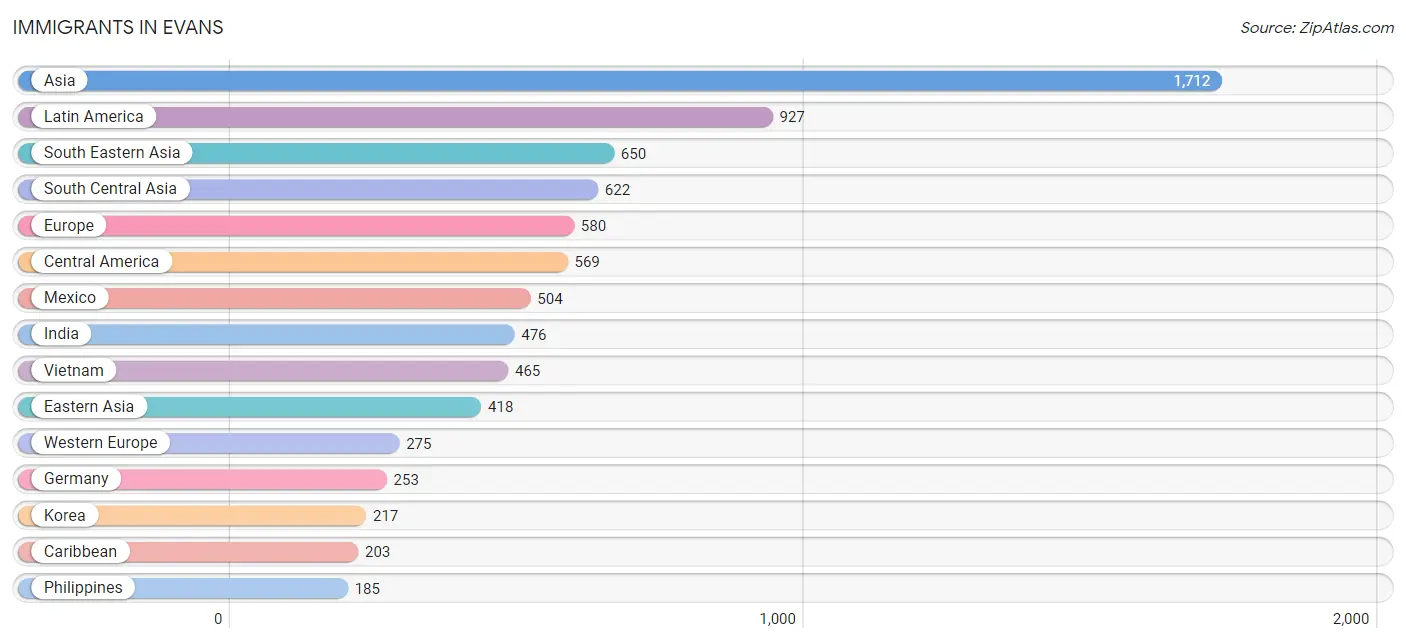
Immigrants in Evans
The most numerous immigrant groups reported in Evans came from Asia (1,712 | 4.6%), Latin America (927 | 2.5%), South Eastern Asia (650 | 1.7%), South Central Asia (622 | 1.7%), and Europe (580 | 1.5%), together accounting for 12.0% of all Evans residents.
| Immigration Origin | # Population | % Population |
| Africa | 148 | 0.4% |
| Asia | 1,712 | 4.6% |
| Bangladesh | 56 | 0.2% |
| Brazil | 9 | 0.0% |
| Cameroon | 41 | 0.1% |
| Canada | 24 | 0.1% |
| Caribbean | 203 | 0.5% |
| Central America | 569 | 1.5% |
| China | 155 | 0.4% |
| Colombia | 70 | 0.2% |
| Costa Rica | 33 | 0.1% |
| Cuba | 126 | 0.3% |
| Eastern Asia | 418 | 1.1% |
| Eastern Europe | 153 | 0.4% |
| Egypt | 42 | 0.1% |
| England | 137 | 0.4% |
| Europe | 580 | 1.5% |
| France | 11 | 0.0% |
| Germany | 253 | 0.7% |
| Ghana | 30 | 0.1% |
| Guyana | 30 | 0.1% |
| Haiti | 38 | 0.1% |
| Honduras | 32 | 0.1% |
| India | 476 | 1.3% |
| Iran | 46 | 0.1% |
| Jamaica | 5 | 0.0% |
| Japan | 46 | 0.1% |
| Jordan | 13 | 0.0% |
| Korea | 217 | 0.6% |
| Latin America | 927 | 2.5% |
| Mexico | 504 | 1.3% |
| Middle Africa | 41 | 0.1% |
| Northern Africa | 42 | 0.1% |
| Northern Europe | 152 | 0.4% |
| Pakistan | 10 | 0.0% |
| Peru | 25 | 0.1% |
| Philippines | 185 | 0.5% |
| Romania | 71 | 0.2% |
| Russia | 63 | 0.2% |
| Saudi Arabia | 9 | 0.0% |
| Scotland | 15 | 0.0% |
| South Africa | 35 | 0.1% |
| South America | 155 | 0.4% |
| South Central Asia | 622 | 1.7% |
| South Eastern Asia | 650 | 1.7% |
| Sri Lanka | 34 | 0.1% |
| Switzerland | 11 | 0.0% |
| Ukraine | 19 | 0.1% |
| Vietnam | 465 | 1.2% |
| Western Africa | 30 | 0.1% |
| Western Asia | 22 | 0.1% |
| Western Europe | 275 | 0.7% | View All 52 Rows |
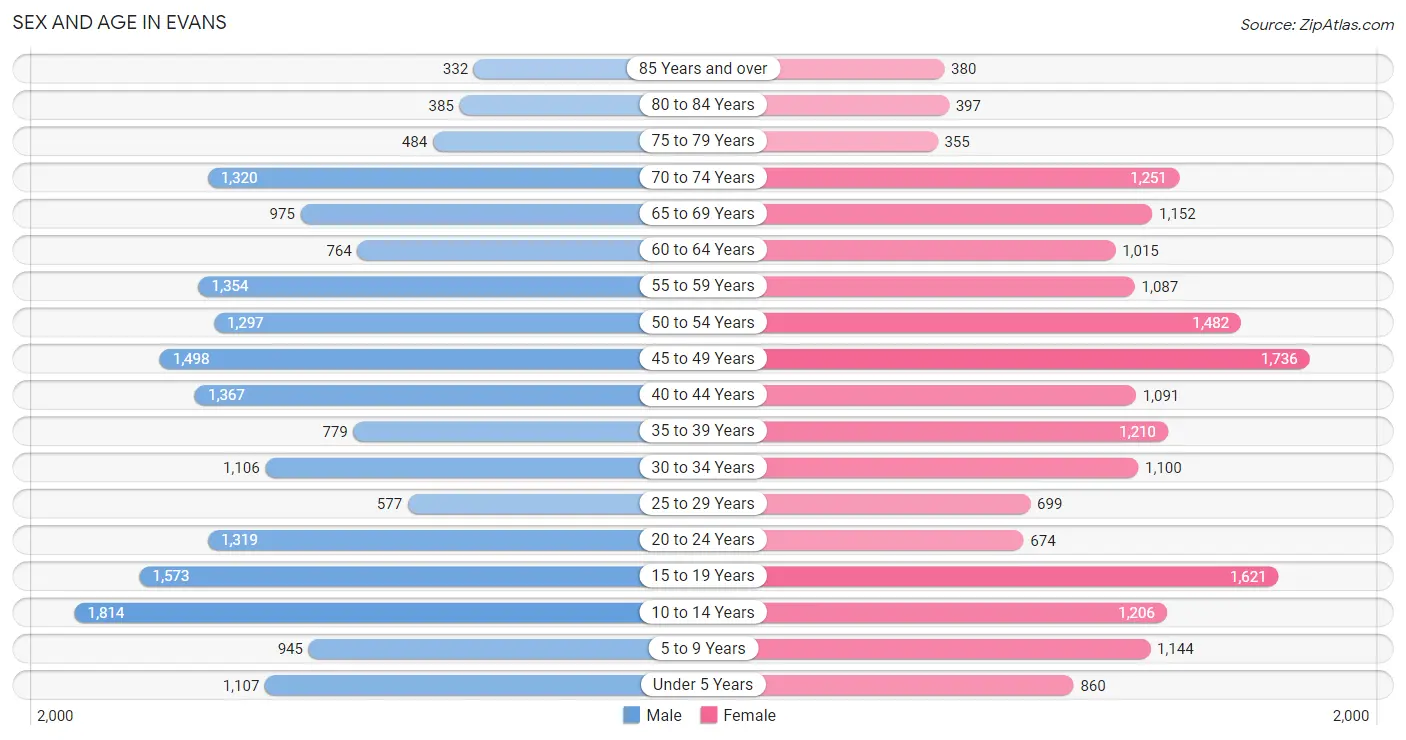
Sex and Age in Evans
Sex and Age in Evans
The most populous age groups in Evans are 10 to 14 Years (1,814 | 9.6%) for men and 45 to 49 Years (1,736 | 9.4%) for women.
| Age Bracket | Male | Female |
| Under 5 Years | 1,107 (5.8%) | 860 (4.7%) |
| 5 to 9 Years | 945 (5.0%) | 1,144 (6.2%) |
| 10 to 14 Years | 1,814 (9.6%) | 1,206 (6.5%) |
| 15 to 19 Years | 1,573 (8.3%) | 1,621 (8.8%) |
| 20 to 24 Years | 1,319 (6.9%) | 674 (3.6%) |
| 25 to 29 Years | 577 (3.0%) | 699 (3.8%) |
| 30 to 34 Years | 1,106 (5.8%) | 1,100 (6.0%) |
| 35 to 39 Years | 779 (4.1%) | 1,210 (6.6%) |
| 40 to 44 Years | 1,367 (7.2%) | 1,091 (5.9%) |
| 45 to 49 Years | 1,498 (7.9%) | 1,736 (9.4%) |
| 50 to 54 Years | 1,297 (6.8%) | 1,482 (8.0%) |
| 55 to 59 Years | 1,354 (7.1%) | 1,087 (5.9%) |
| 60 to 64 Years | 764 (4.0%) | 1,015 (5.5%) |
| 65 to 69 Years | 975 (5.1%) | 1,152 (6.2%) |
| 70 to 74 Years | 1,320 (7.0%) | 1,251 (6.8%) |
| 75 to 79 Years | 484 (2.5%) | 355 (1.9%) |
| 80 to 84 Years | 385 (2.0%) | 397 (2.1%) |
| 85 Years and over | 332 (1.8%) | 380 (2.1%) |
| Total | 18,996 (100.0%) | 18,460 (100.0%) |
Families and Households in Evans
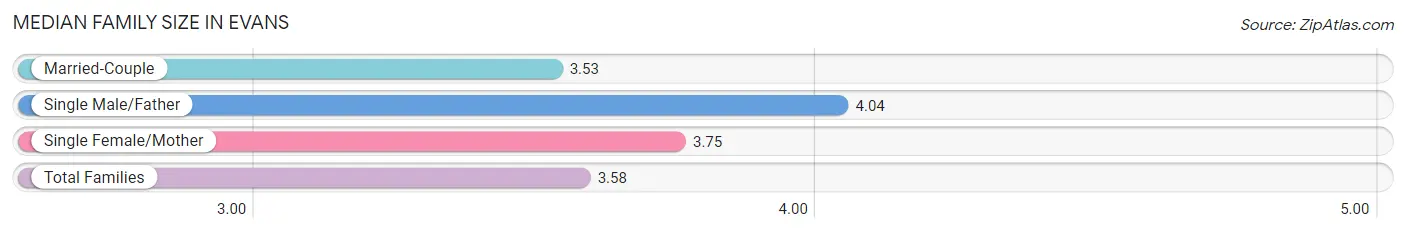
Median Family Size in Evans
The median family size in Evans is 3.58 persons per family, with single male/father families (404 | 4.4%) accounting for the largest median family size of 4.04 persons per family. On the other hand, married-couple families (7,872 | 85.1%) represent the smallest median family size with 3.53 persons per family.
| Family Type | # Families | Family Size |
| Married-Couple | 7,872 (85.1%) | 3.53 |
| Single Male/Father | 404 (4.4%) | 4.04 |
| Single Female/Mother | 979 (10.6%) | 3.75 |
| Total Families | 9,255 (100.0%) | 3.58 |
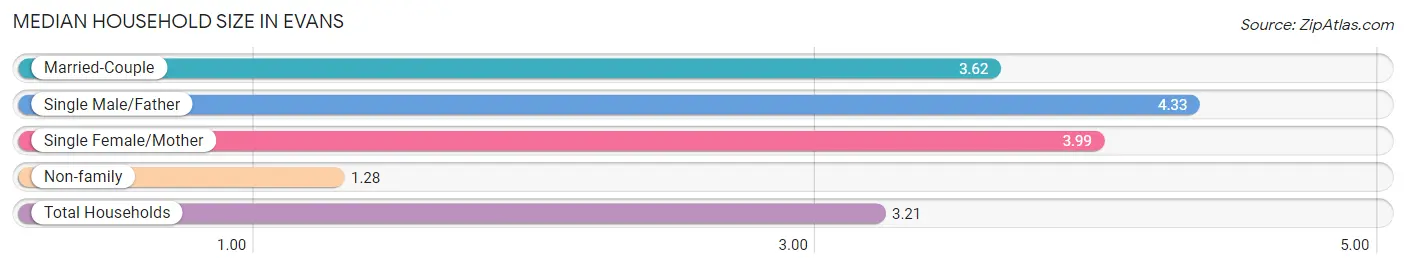
Median Household Size in Evans
The median household size in Evans is 3.21 persons per household, with single male/father households (404 | 3.5%) accounting for the largest median household size of 4.33 persons per household. non-family households (2,327 | 20.1%) represent the smallest median household size with 1.28 persons per household.
| Household Type | # Households | Household Size |
| Married-Couple | 7,872 (68.0%) | 3.62 |
| Single Male/Father | 404 (3.5%) | 4.33 |
| Single Female/Mother | 979 (8.5%) | 3.99 |
| Non-family | 2,327 (20.1%) | 1.28 |
| Total Households | 11,582 (100.0%) | 3.21 |
Household Size by Marriage Status in Evans
Out of a total of 11,582 households in Evans, 9,255 (79.9%) are family households, while 2,327 (20.1%) are nonfamily households. The most numerous type of family households are 2-person households, comprising 3,802, and the most common type of nonfamily households are 1-person households, comprising 2,150.
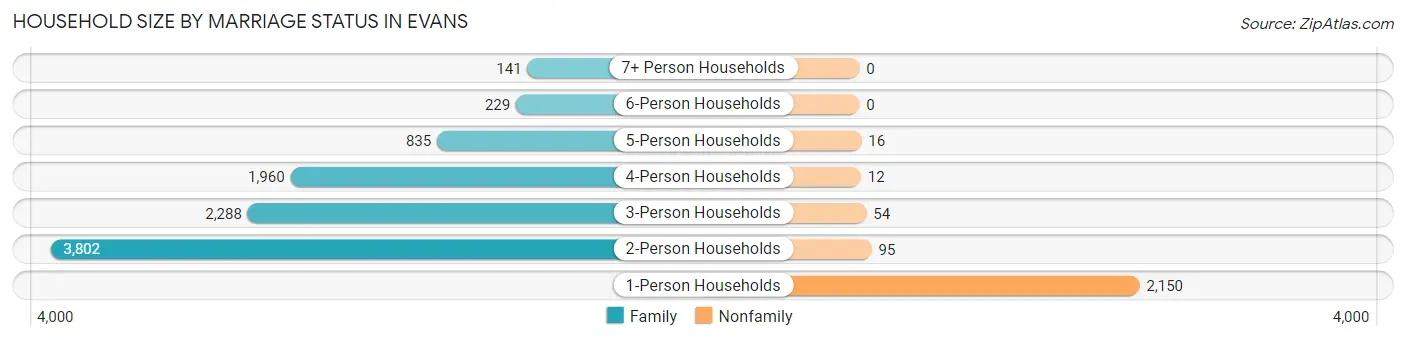
| Household Size | Family Households | Nonfamily Households |
| 1-Person Households | - | 2,150 (18.6%) |
| 2-Person Households | 3,802 (32.8%) | 95 (0.8%) |
| 3-Person Households | 2,288 (19.8%) | 54 (0.5%) |
| 4-Person Households | 1,960 (16.9%) | 12 (0.1%) |
| 5-Person Households | 835 (7.2%) | 16 (0.1%) |
| 6-Person Households | 229 (2.0%) | 0 (0.0%) |
| 7+ Person Households | 141 (1.2%) | 0 (0.0%) |
| Total | 9,255 (79.9%) | 2,327 (20.1%) |
Female Fertility in Evans
Fertility by Age in Evans
Average fertility rate in Evans is 26.0 births per 1,000 women. Women in the age bracket of 20 to 34 years have the highest fertility rate with 52.0 births per 1,000 women. Women in the age bracket of 20 to 34 years acount for 57.1% of all women with births.
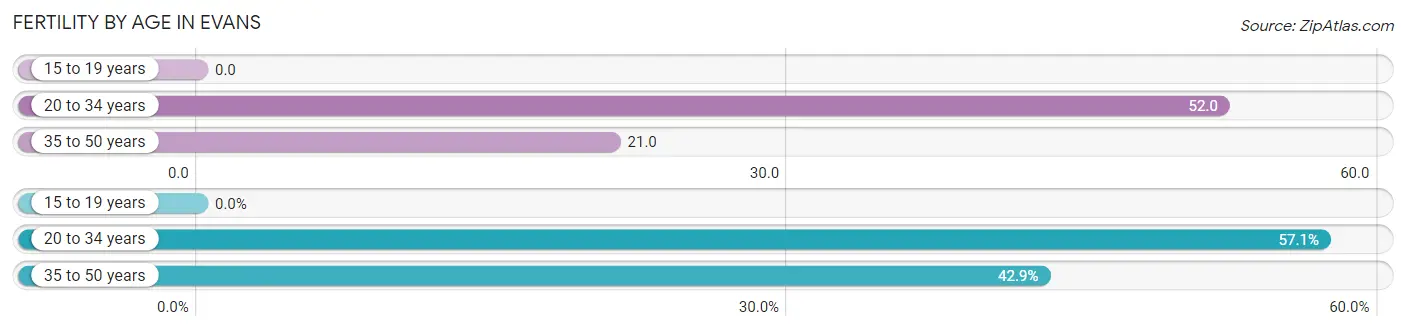
| Age Bracket | Women with Births | Births / 1,000 Women |
| 15 to 19 years | 0 (0.0%) | 0.0 |
| 20 to 34 years | 128 (57.1%) | 52.0 |
| 35 to 50 years | 96 (42.9%) | 21.0 |
| Total | 224 (100.0%) | 26.0 |
Fertility by Age by Marriage Status in Evans
83.0% of women with births (224) in Evans are married. The highest percentage of unmarried women with births falls into 20 to 34 years age bracket with 29.7% of them unmarried at the time of birth, while the lowest percentage of unmarried women with births belong to 35 to 50 years age bracket with 0.0% of them unmarried.
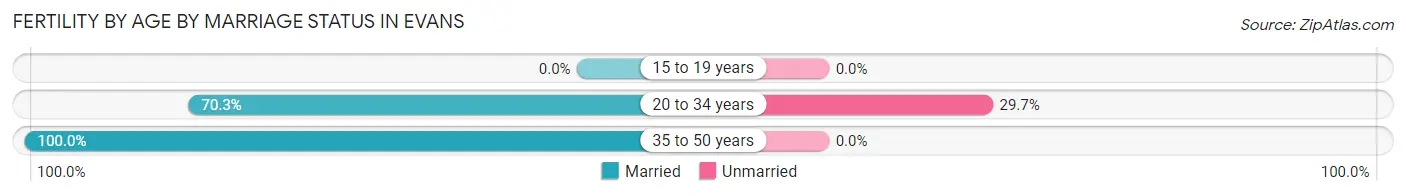
| Age Bracket | Married | Unmarried |
| 15 to 19 years | 0 (0.0%) | 0 (0.0%) |
| 20 to 34 years | 90 (70.3%) | 38 (29.7%) |
| 35 to 50 years | 96 (100.0%) | 0 (0.0%) |
| Total | 186 (83.0%) | 38 (17.0%) |
Fertility by Education in Evans
Average fertility rate in Evans is 26.0 births per 1,000 women. Women with the education attainment of graduate degree have the highest fertility rate of 61.0 births per 1,000 women, while women with the education attainment of college or associate's degree have the lowest fertility at 11.0 births per 1,000 women. Women with the education attainment of graduate degree represent 39.7% of all women with births.
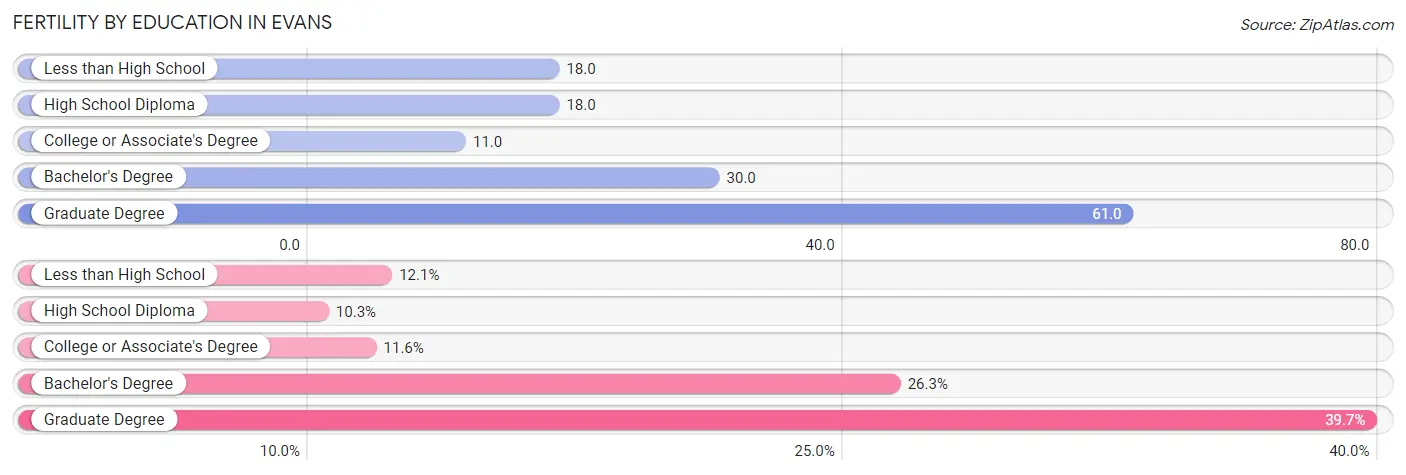
| Educational Attainment | Women with Births | Births / 1,000 Women |
| Less than High School | 27 (12.0%) | 18.0 |
| High School Diploma | 23 (10.3%) | 18.0 |
| College or Associate's Degree | 26 (11.6%) | 11.0 |
| Bachelor's Degree | 59 (26.3%) | 30.0 |
| Graduate Degree | 89 (39.7%) | 61.0 |
| Total | 224 (100.0%) | 26.0 |
Fertility by Education by Marriage Status in Evans
17.0% of women with births in Evans are unmarried. Women with the educational attainment of less than high school are most likely to be married with 100.0% of them married at childbirth, while women with the educational attainment of high school diploma are least likely to be married with 100.0% of them unmarried at childbirth.
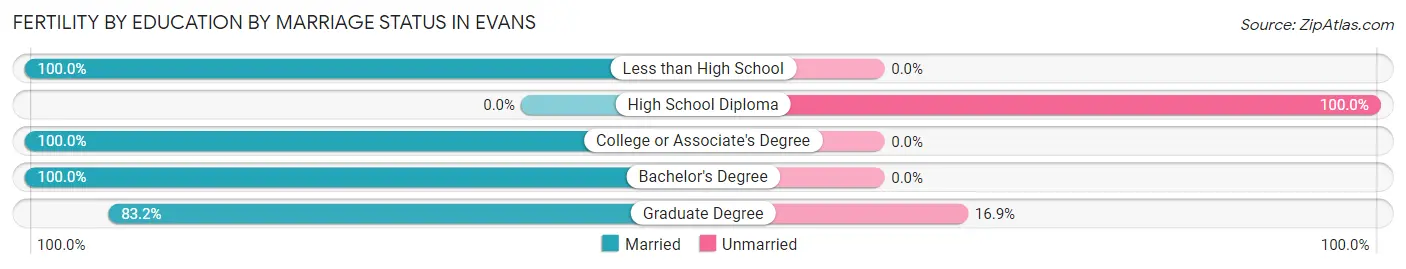
| Educational Attainment | Married | Unmarried |
| Less than High School | 27 (100.0%) | 0 (0.0%) |
| High School Diploma | 0 (0.0%) | 23 (100.0%) |
| College or Associate's Degree | 26 (100.0%) | 0 (0.0%) |
| Bachelor's Degree | 59 (100.0%) | 0 (0.0%) |
| Graduate Degree | 74 (83.2%) | 15 (16.9%) |
| Total | 186 (83.0%) | 38 (17.0%) |
Employment Characteristics in Evans
Employment by Class of Employer in Evans
Among the 17,213 employed individuals in Evans, private company employees (9,706 | 56.4%), federal government employees (2,263 | 13.2%), and state government employees (1,419 | 8.2%) make up the most common classes of employment.
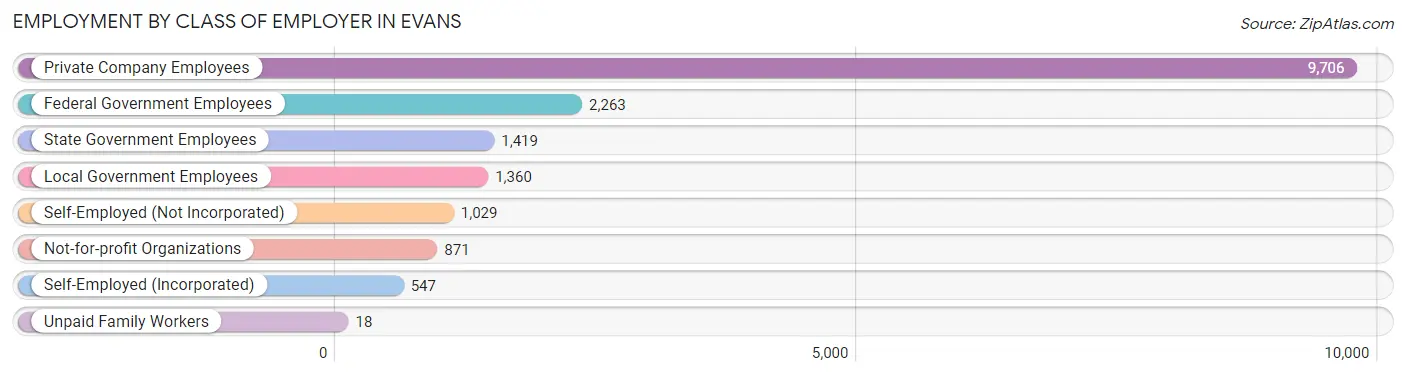
| Employer Class | # Employees | % Employees |
| Private Company Employees | 9,706 | 56.4% |
| Self-Employed (Incorporated) | 547 | 3.2% |
| Self-Employed (Not Incorporated) | 1,029 | 6.0% |
| Not-for-profit Organizations | 871 | 5.1% |
| Local Government Employees | 1,360 | 7.9% |
| State Government Employees | 1,419 | 8.2% |
| Federal Government Employees | 2,263 | 13.2% |
| Unpaid Family Workers | 18 | 0.1% |
| Total | 17,213 | 100.0% |
Employment Status by Age in Evans
According to the labor force statistics for Evans, out of the total population over 16 years of age (29,590), 62.4% or 18,464 individuals are in the labor force, with 5.5% or 1,016 of them unemployed. The age group with the highest labor force participation rate is 55 to 59 years, with 88.6% or 2,163 individuals in the labor force. Within the labor force, the 25 to 29 years age range has the highest percentage of unemployed individuals, with 11.3% or 120 of them being unemployed.
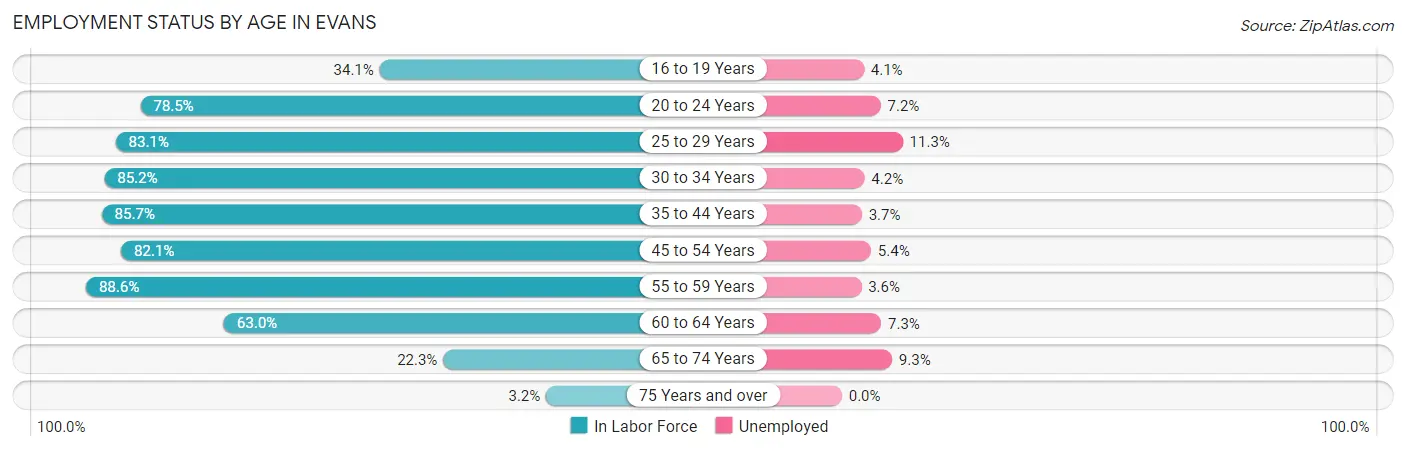
| Age Bracket | In Labor Force | Unemployed |
| 16 to 19 Years | 820 (34.1%) | 34 (4.1%) |
| 20 to 24 Years | 1,565 (78.5%) | 113 (7.2%) |
| 25 to 29 Years | 1,060 (83.1%) | 120 (11.3%) |
| 30 to 34 Years | 1,880 (85.2%) | 79 (4.2%) |
| 35 to 44 Years | 3,811 (85.7%) | 141 (3.7%) |
| 45 to 54 Years | 4,937 (82.1%) | 267 (5.4%) |
| 55 to 59 Years | 2,163 (88.6%) | 78 (3.6%) |
| 60 to 64 Years | 1,121 (63.0%) | 82 (7.3%) |
| 65 to 74 Years | 1,048 (22.3%) | 97 (9.3%) |
| 75 Years and over | 75 (3.2%) | 0 (0.0%) |
| Total | 18,464 (62.4%) | 1,016 (5.5%) |
Employment Status by Educational Attainment in Evans
According to labor force statistics for Evans, 82.4% of individuals (14,965) out of the total population between 25 and 64 years of age (18,162) are in the labor force, with 5.1% or 763 of them being unemployed. The group with the highest labor force participation rate are those with the educational attainment of bachelor's degree or higher, with 88.2% or 8,412 individuals in the labor force. Within the labor force, individuals with less than high school education have the highest percentage of unemployment, with 25.7% or 153 of them being unemployed.
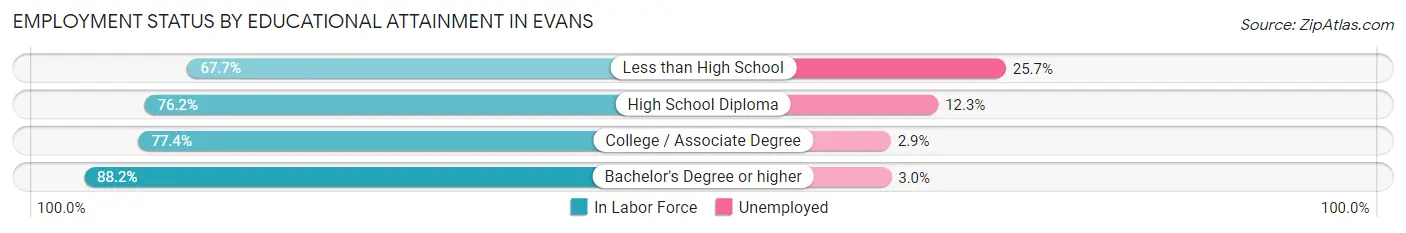
| Educational Attainment | In Labor Force | Unemployed |
| Less than High School | 596 (67.7%) | 226 (25.7%) |
| High School Diploma | 1,971 (76.2%) | 318 (12.3%) |
| College / Associate Degree | 3,992 (77.4%) | 150 (2.9%) |
| Bachelor's Degree or higher | 8,412 (88.2%) | 286 (3.0%) |
| Total | 14,965 (82.4%) | 926 (5.1%) |
Employment Occupations by Sex in Evans
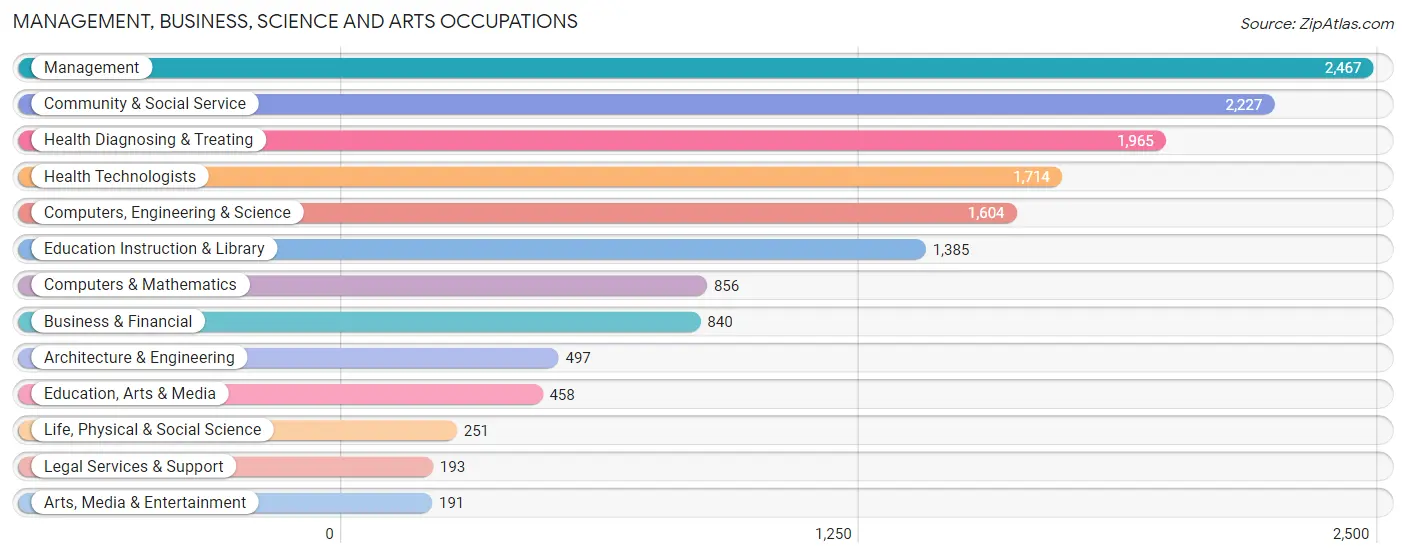
Management, Business, Science and Arts Occupations
The most common Management, Business, Science and Arts occupations in Evans are Management (2,467 | 14.4%), Community & Social Service (2,227 | 13.1%), Health Diagnosing & Treating (1,965 | 11.5%), Health Technologists (1,714 | 10.0%), and Computers, Engineering & Science (1,604 | 9.4%).
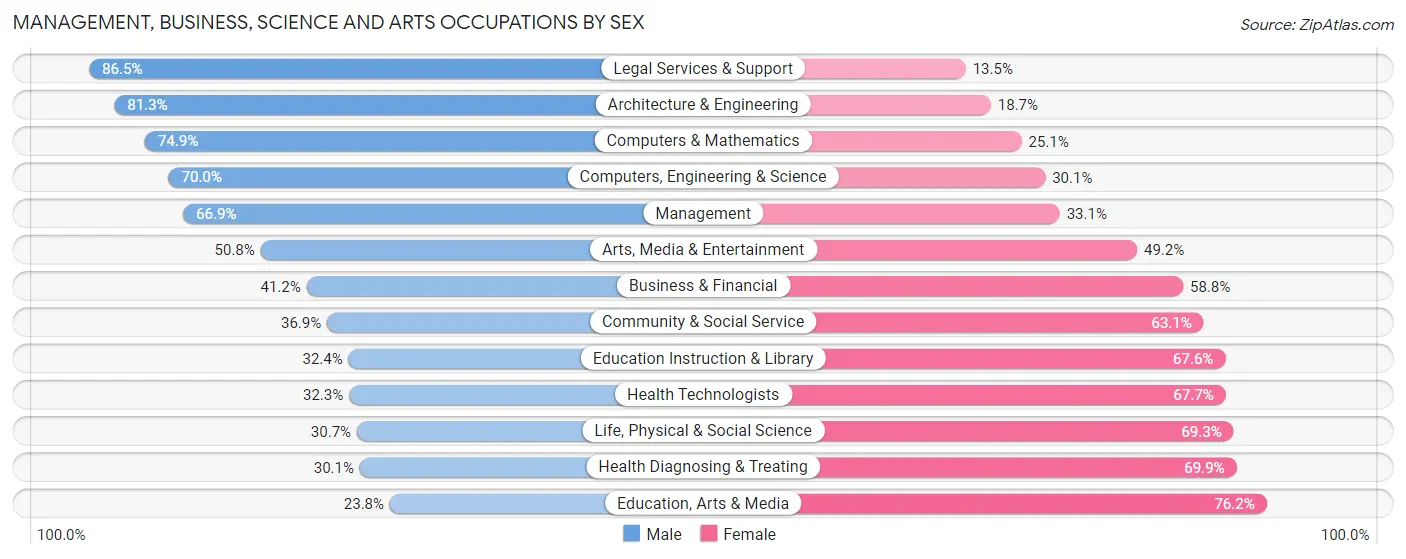
Management, Business, Science and Arts Occupations by Sex
Within the Management, Business, Science and Arts occupations in Evans, the most male-oriented occupations are Legal Services & Support (86.5%), Architecture & Engineering (81.3%), and Computers & Mathematics (74.9%), while the most female-oriented occupations are Education, Arts & Media (76.2%), Health Diagnosing & Treating (69.9%), and Life, Physical & Social Science (69.3%).
| Occupation | Male | Female |
| Management | 1,651 (66.9%) | 816 (33.1%) |
| Business & Financial | 346 (41.2%) | 494 (58.8%) |
| Computers, Engineering & Science | 1,122 (70.0%) | 482 (30.0%) |
| Computers & Mathematics | 641 (74.9%) | 215 (25.1%) |
| Architecture & Engineering | 404 (81.3%) | 93 (18.7%) |
| Life, Physical & Social Science | 77 (30.7%) | 174 (69.3%) |
| Community & Social Service | 822 (36.9%) | 1,405 (63.1%) |
| Education, Arts & Media | 109 (23.8%) | 349 (76.2%) |
| Legal Services & Support | 167 (86.5%) | 26 (13.5%) |
| Education Instruction & Library | 449 (32.4%) | 936 (67.6%) |
| Arts, Media & Entertainment | 97 (50.8%) | 94 (49.2%) |
| Health Diagnosing & Treating | 591 (30.1%) | 1,374 (69.9%) |
| Health Technologists | 554 (32.3%) | 1,160 (67.7%) |
| Total (Category) | 4,532 (49.8%) | 4,571 (50.2%) |
| Total (Overall) | 9,243 (54.1%) | 7,825 (45.9%) |
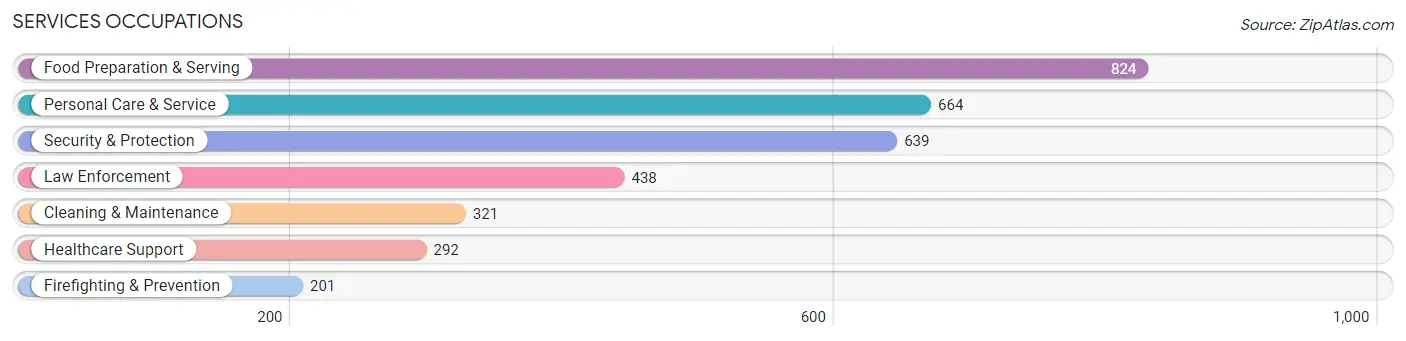
Services Occupations
The most common Services occupations in Evans are Food Preparation & Serving (824 | 4.8%), Personal Care & Service (664 | 3.9%), Security & Protection (639 | 3.7%), Law Enforcement (438 | 2.6%), and Cleaning & Maintenance (321 | 1.9%).
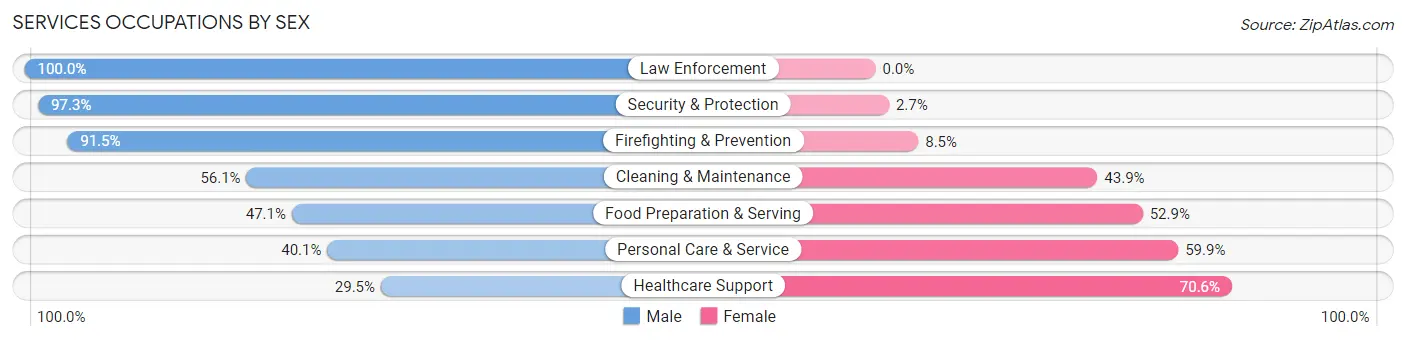
Services Occupations by Sex
Within the Services occupations in Evans, the most male-oriented occupations are Law Enforcement (100.0%), Security & Protection (97.3%), and Firefighting & Prevention (91.5%), while the most female-oriented occupations are Healthcare Support (70.6%), Personal Care & Service (59.9%), and Food Preparation & Serving (52.9%).
| Occupation | Male | Female |
| Healthcare Support | 86 (29.4%) | 206 (70.6%) |
| Security & Protection | 622 (97.3%) | 17 (2.7%) |
| Firefighting & Prevention | 184 (91.5%) | 17 (8.5%) |
| Law Enforcement | 438 (100.0%) | 0 (0.0%) |
| Food Preparation & Serving | 388 (47.1%) | 436 (52.9%) |
| Cleaning & Maintenance | 180 (56.1%) | 141 (43.9%) |
| Personal Care & Service | 266 (40.1%) | 398 (59.9%) |
| Total (Category) | 1,542 (56.3%) | 1,198 (43.7%) |
| Total (Overall) | 9,243 (54.1%) | 7,825 (45.9%) |
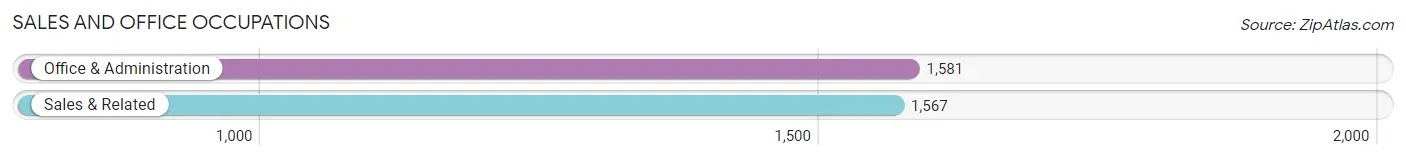
Sales and Office Occupations
The most common Sales and Office occupations in Evans are Office & Administration (1,581 | 9.3%), and Sales & Related (1,567 | 9.2%).
Sales and Office Occupations by Sex
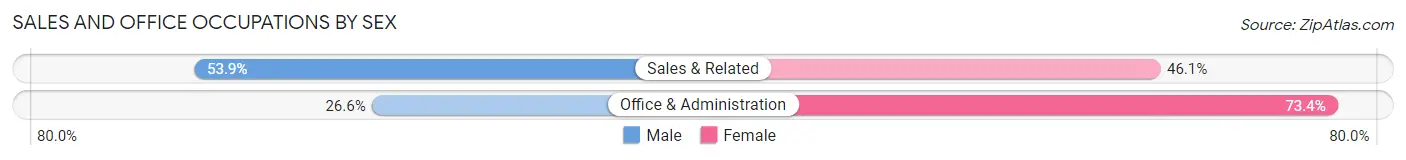
| Occupation | Male | Female |
| Sales & Related | 845 (53.9%) | 722 (46.1%) |
| Office & Administration | 421 (26.6%) | 1,160 (73.4%) |
| Total (Category) | 1,266 (40.2%) | 1,882 (59.8%) |
| Total (Overall) | 9,243 (54.1%) | 7,825 (45.9%) |
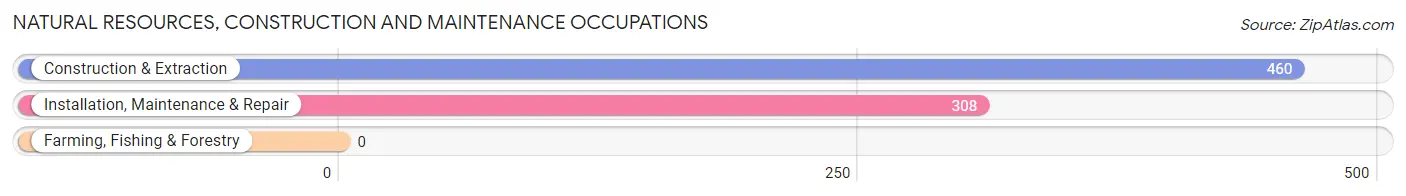
Natural Resources, Construction and Maintenance Occupations
The most common Natural Resources, Construction and Maintenance occupations in Evans are Construction & Extraction (460 | 2.7%), and Installation, Maintenance & Repair (308 | 1.8%).
Natural Resources, Construction and Maintenance Occupations by Sex
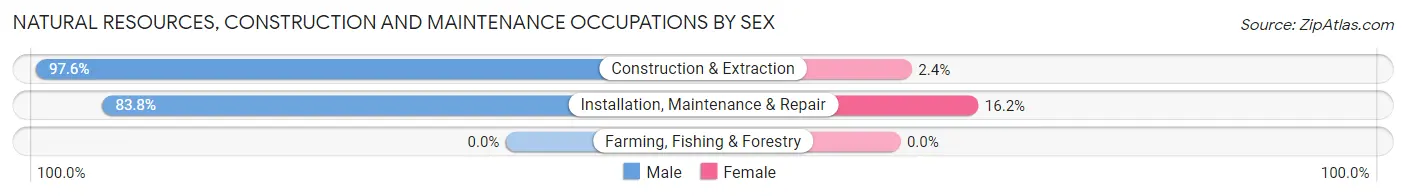
| Occupation | Male | Female |
| Farming, Fishing & Forestry | 0 (0.0%) | 0 (0.0%) |
| Construction & Extraction | 449 (97.6%) | 11 (2.4%) |
| Installation, Maintenance & Repair | 258 (83.8%) | 50 (16.2%) |
| Total (Category) | 707 (92.1%) | 61 (7.9%) |
| Total (Overall) | 9,243 (54.1%) | 7,825 (45.9%) |
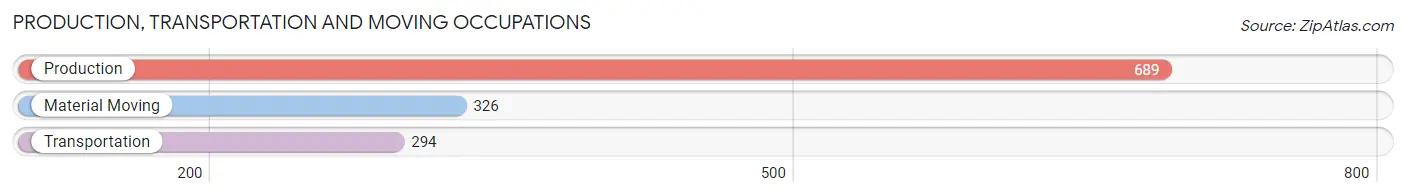
Production, Transportation and Moving Occupations
The most common Production, Transportation and Moving occupations in Evans are Production (689 | 4.0%), Material Moving (326 | 1.9%), and Transportation (294 | 1.7%).
Production, Transportation and Moving Occupations by Sex
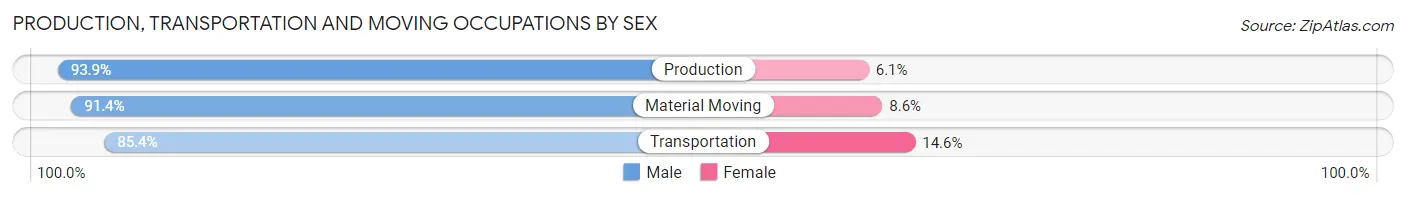
| Occupation | Male | Female |
| Production | 647 (93.9%) | 42 (6.1%) |
| Transportation | 251 (85.4%) | 43 (14.6%) |
| Material Moving | 298 (91.4%) | 28 (8.6%) |
| Total (Category) | 1,196 (91.4%) | 113 (8.6%) |
| Total (Overall) | 9,243 (54.1%) | 7,825 (45.9%) |
Employment Industries by Sex in Evans
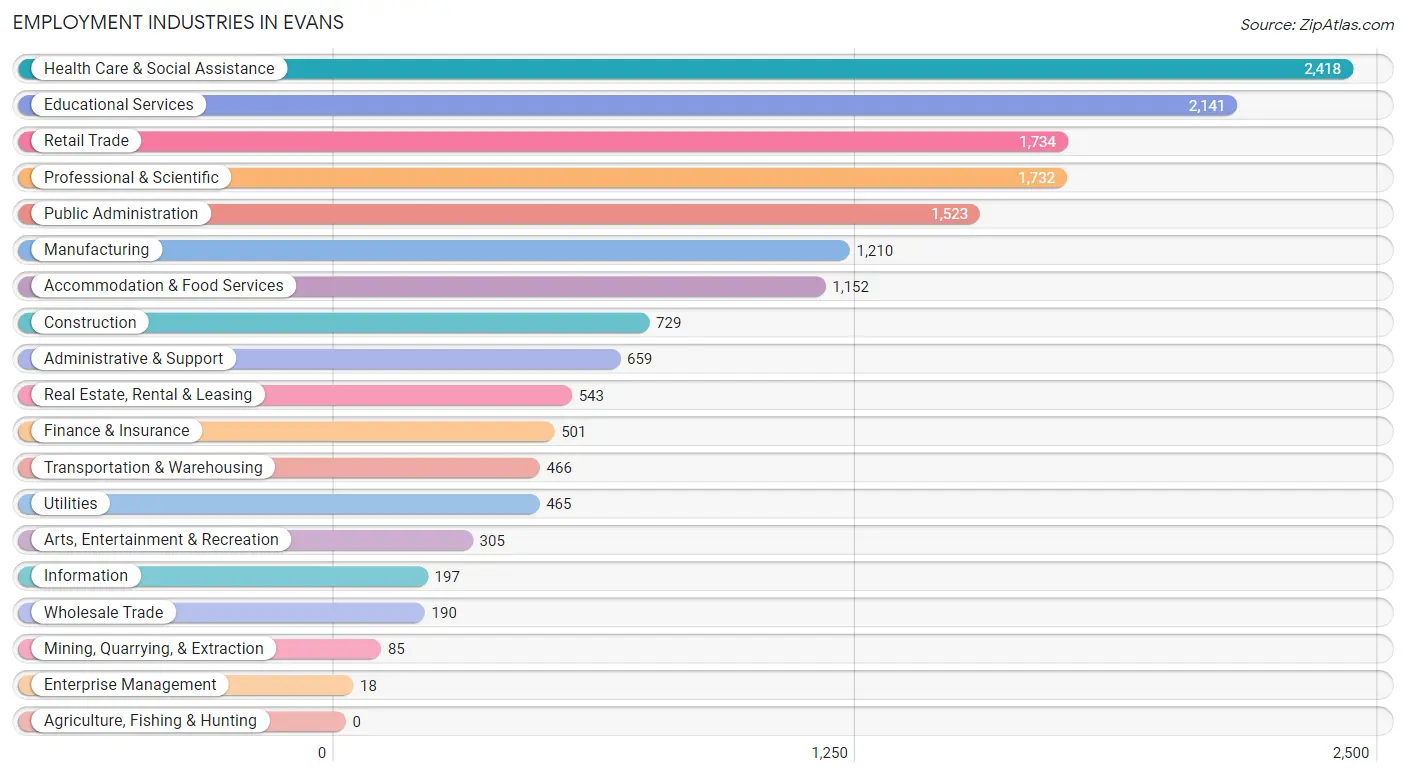
Employment Industries in Evans
The major employment industries in Evans include Health Care & Social Assistance (2,418 | 14.2%), Educational Services (2,141 | 12.5%), Retail Trade (1,734 | 10.2%), Professional & Scientific (1,732 | 10.2%), and Public Administration (1,523 | 8.9%).
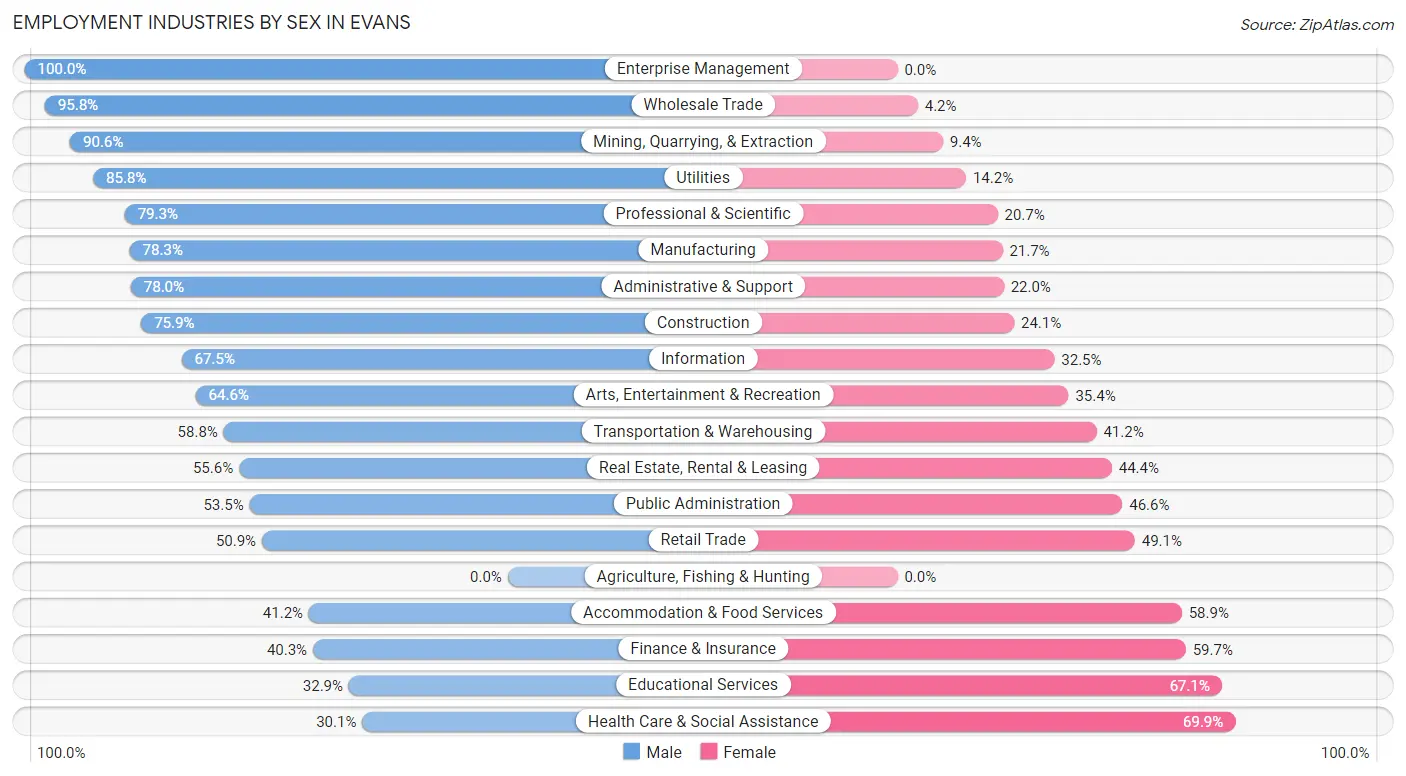
Employment Industries by Sex in Evans
The Evans industries that see more men than women are Enterprise Management (100.0%), Wholesale Trade (95.8%), and Mining, Quarrying, & Extraction (90.6%), whereas the industries that tend to have a higher number of women are Health Care & Social Assistance (69.9%), Educational Services (67.1%), and Finance & Insurance (59.7%).
| Industry | Male | Female |
| Agriculture, Fishing & Hunting | 0 (0.0%) | 0 (0.0%) |
| Mining, Quarrying, & Extraction | 77 (90.6%) | 8 (9.4%) |
| Construction | 553 (75.9%) | 176 (24.1%) |
| Manufacturing | 947 (78.3%) | 263 (21.7%) |
| Wholesale Trade | 182 (95.8%) | 8 (4.2%) |
| Retail Trade | 882 (50.9%) | 852 (49.1%) |
| Transportation & Warehousing | 274 (58.8%) | 192 (41.2%) |
| Utilities | 399 (85.8%) | 66 (14.2%) |
| Information | 133 (67.5%) | 64 (32.5%) |
| Finance & Insurance | 202 (40.3%) | 299 (59.7%) |
| Real Estate, Rental & Leasing | 302 (55.6%) | 241 (44.4%) |
| Professional & Scientific | 1,373 (79.3%) | 359 (20.7%) |
| Enterprise Management | 18 (100.0%) | 0 (0.0%) |
| Administrative & Support | 514 (78.0%) | 145 (22.0%) |
| Educational Services | 704 (32.9%) | 1,437 (67.1%) |
| Health Care & Social Assistance | 728 (30.1%) | 1,690 (69.9%) |
| Arts, Entertainment & Recreation | 197 (64.6%) | 108 (35.4%) |
| Accommodation & Food Services | 474 (41.1%) | 678 (58.9%) |
| Public Administration | 814 (53.4%) | 709 (46.6%) |
| Total | 9,243 (54.1%) | 7,825 (45.9%) |
Education in Evans
School Enrollment in Evans
The most common levels of schooling among the 10,234 students in Evans are middle school (2,469 | 24.1%), high school (2,449 | 23.9%), and college / undergraduate (2,112 | 20.6%).
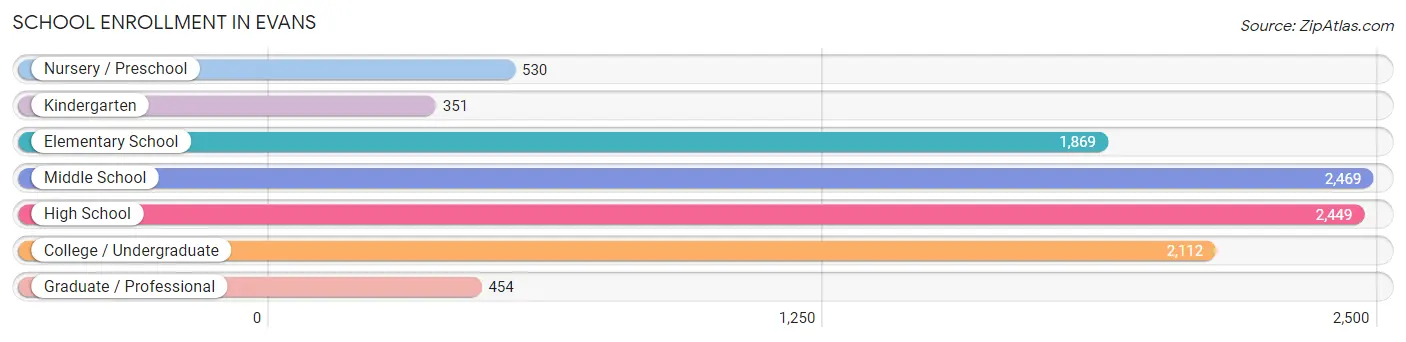
| School Level | # Students | % Students |
| Nursery / Preschool | 530 | 5.2% |
| Kindergarten | 351 | 3.4% |
| Elementary School | 1,869 | 18.3% |
| Middle School | 2,469 | 24.1% |
| High School | 2,449 | 23.9% |
| College / Undergraduate | 2,112 | 20.6% |
| Graduate / Professional | 454 | 4.4% |
| Total | 10,234 | 100.0% |
School Enrollment by Age by Funding Source in Evans
Out of a total of 10,234 students who are enrolled in schools in Evans, 1,740 (17.0%) attend a private institution, while the remaining 8,494 (83.0%) are enrolled in public schools. The age group of 3 to 4 year olds has the highest likelihood of being enrolled in private schools, with 297 (65.1% in the age bracket) enrolled. Conversely, the age group of 35 years and over has the lowest likelihood of being enrolled in a private school, with 607 (94.1% in the age bracket) attending a public institution.
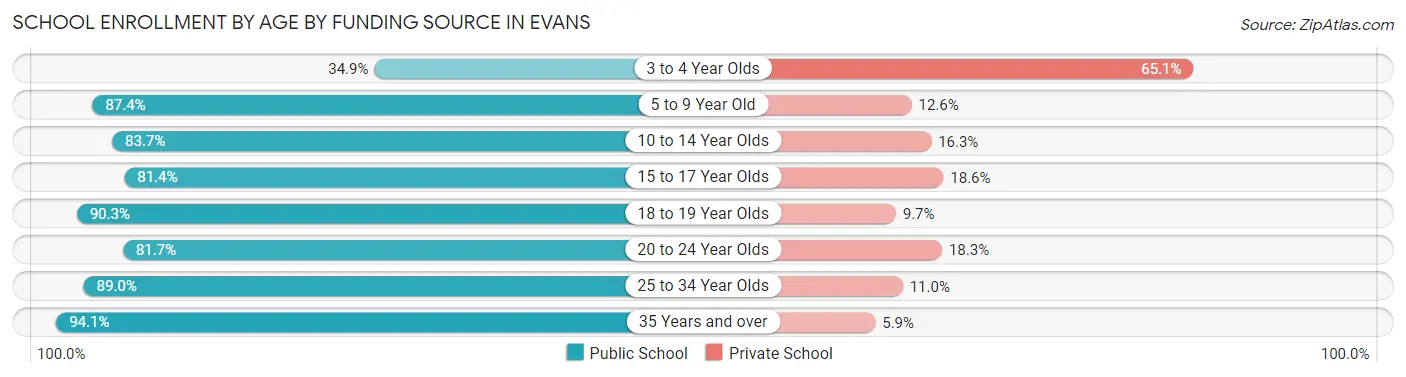
| Age Bracket | Public School | Private School |
| 3 to 4 Year Olds | 159 (34.9%) | 297 (65.1%) |
| 5 to 9 Year Old | 1,770 (87.4%) | 256 (12.6%) |
| 10 to 14 Year Olds | 2,465 (83.7%) | 480 (16.3%) |
| 15 to 17 Year Olds | 1,714 (81.4%) | 391 (18.6%) |
| 18 to 19 Year Olds | 707 (90.3%) | 76 (9.7%) |
| 20 to 24 Year Olds | 647 (81.7%) | 145 (18.3%) |
| 25 to 34 Year Olds | 429 (89.0%) | 53 (11.0%) |
| 35 Years and over | 607 (94.1%) | 38 (5.9%) |
| Total | 8,494 (83.0%) | 1,740 (17.0%) |
Educational Attainment by Field of Study in Evans
Business (2,531 | 18.8%), education (1,914 | 14.2%), science & technology (1,521 | 11.3%), bio, nature & agricultural (1,058 | 7.9%), and engineering (1,045 | 7.8%) are the most common fields of study among 13,458 individuals in Evans who have obtained a bachelor's degree or higher.
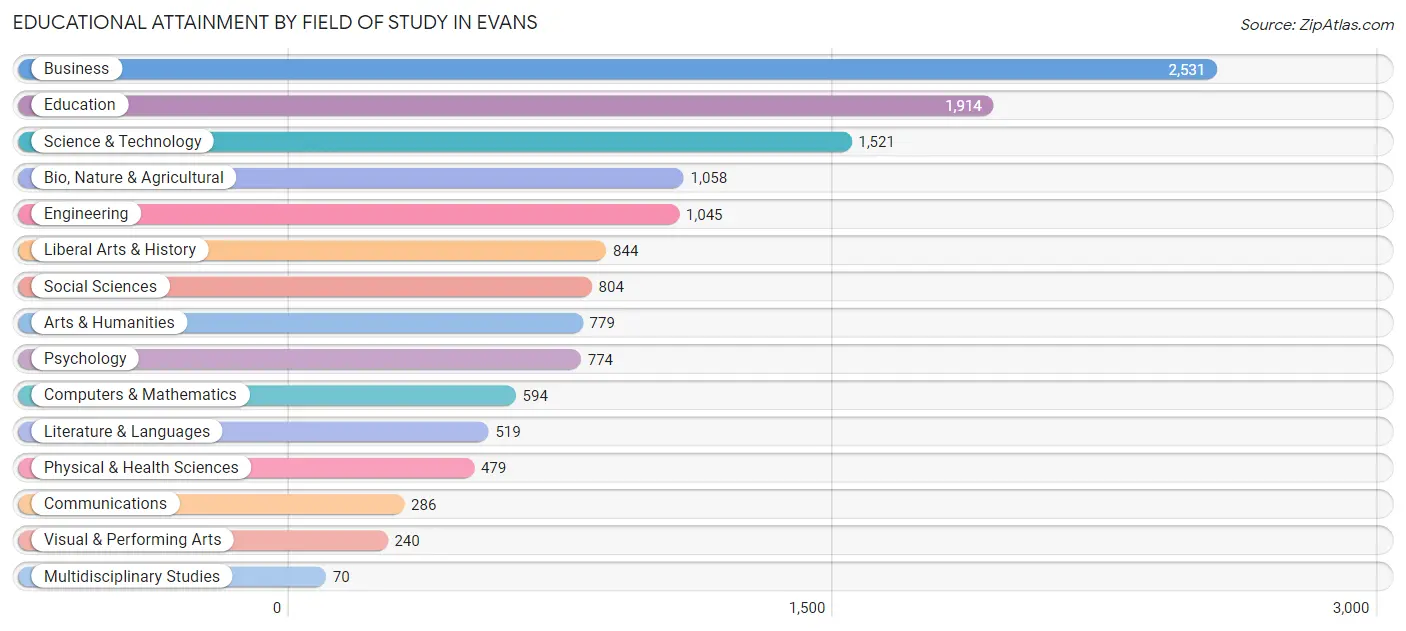
| Field of Study | # Graduates | % Graduates |
| Computers & Mathematics | 594 | 4.4% |
| Bio, Nature & Agricultural | 1,058 | 7.9% |
| Physical & Health Sciences | 479 | 3.6% |
| Psychology | 774 | 5.8% |
| Social Sciences | 804 | 6.0% |
| Engineering | 1,045 | 7.8% |
| Multidisciplinary Studies | 70 | 0.5% |
| Science & Technology | 1,521 | 11.3% |
| Business | 2,531 | 18.8% |
| Education | 1,914 | 14.2% |
| Literature & Languages | 519 | 3.9% |
| Liberal Arts & History | 844 | 6.3% |
| Visual & Performing Arts | 240 | 1.8% |
| Communications | 286 | 2.1% |
| Arts & Humanities | 779 | 5.8% |
| Total | 13,458 | 100.0% |
Transportation & Commute in Evans
Vehicle Availability by Sex in Evans
The most prevalent vehicle ownership categories in Evans are males with 2 vehicles (4,143, accounting for 43.8%) and females with 2 vehicles (3,239, making up 53.6%).
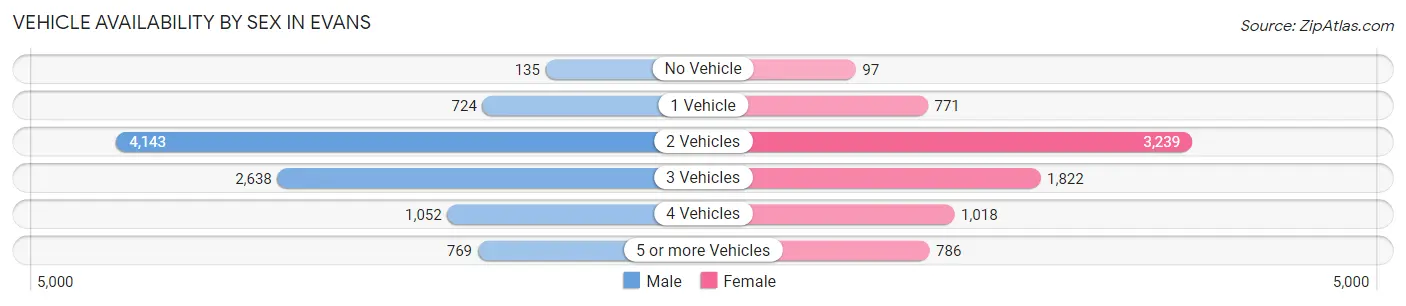
| Vehicles Available | Male | Female |
| No Vehicle | 135 (1.4%) | 97 (1.3%) |
| 1 Vehicle | 724 (7.6%) | 771 (10.0%) |
| 2 Vehicles | 4,143 (43.8%) | 3,239 (41.9%) |
| 3 Vehicles | 2,638 (27.9%) | 1,822 (23.6%) |
| 4 Vehicles | 1,052 (11.1%) | 1,018 (13.2%) |
| 5 or more Vehicles | 769 (8.1%) | 786 (10.2%) |
| Total | 9,461 (100.0%) | 7,733 (100.0%) |
Commute Time in Evans
The most frequently occuring commute durations in Evans are 30 to 34 minutes (3,351 commuters, 20.8%), 20 to 24 minutes (2,287 commuters, 14.2%), and 15 to 19 minutes (2,180 commuters, 13.5%).
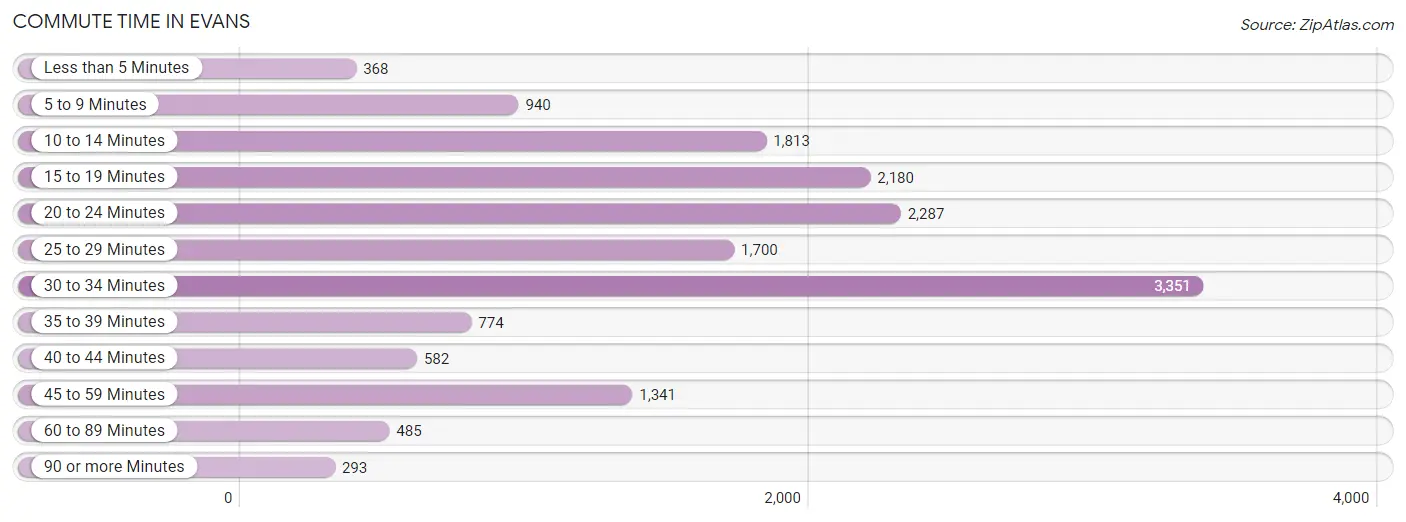
| Commute Time | # Commuters | % Commuters |
| Less than 5 Minutes | 368 | 2.3% |
| 5 to 9 Minutes | 940 | 5.8% |
| 10 to 14 Minutes | 1,813 | 11.3% |
| 15 to 19 Minutes | 2,180 | 13.5% |
| 20 to 24 Minutes | 2,287 | 14.2% |
| 25 to 29 Minutes | 1,700 | 10.5% |
| 30 to 34 Minutes | 3,351 | 20.8% |
| 35 to 39 Minutes | 774 | 4.8% |
| 40 to 44 Minutes | 582 | 3.6% |
| 45 to 59 Minutes | 1,341 | 8.3% |
| 60 to 89 Minutes | 485 | 3.0% |
| 90 or more Minutes | 293 | 1.8% |
Commute Time by Sex in Evans
The most common commute times in Evans are 30 to 34 minutes (1,708 commuters, 19.1%) for males and 30 to 34 minutes (1,643 commuters, 23.0%) for females.
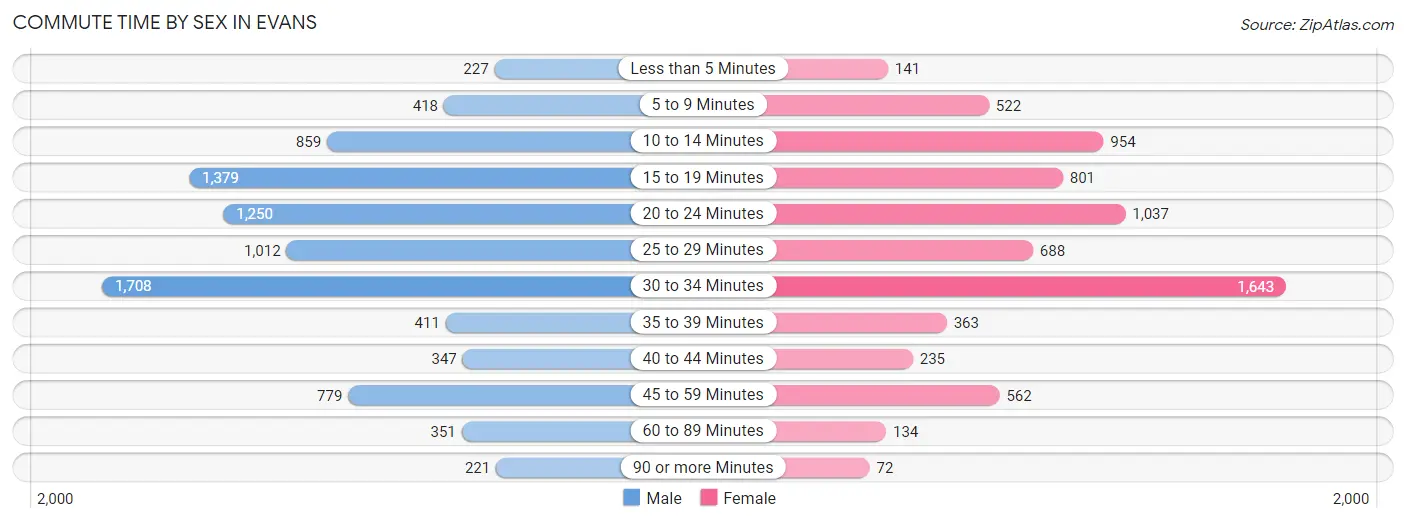
| Commute Time | Male | Female |
| Less than 5 Minutes | 227 (2.5%) | 141 (2.0%) |
| 5 to 9 Minutes | 418 (4.7%) | 522 (7.3%) |
| 10 to 14 Minutes | 859 (9.6%) | 954 (13.3%) |
| 15 to 19 Minutes | 1,379 (15.4%) | 801 (11.2%) |
| 20 to 24 Minutes | 1,250 (14.0%) | 1,037 (14.5%) |
| 25 to 29 Minutes | 1,012 (11.3%) | 688 (9.6%) |
| 30 to 34 Minutes | 1,708 (19.1%) | 1,643 (23.0%) |
| 35 to 39 Minutes | 411 (4.6%) | 363 (5.1%) |
| 40 to 44 Minutes | 347 (3.9%) | 235 (3.3%) |
| 45 to 59 Minutes | 779 (8.7%) | 562 (7.9%) |
| 60 to 89 Minutes | 351 (3.9%) | 134 (1.9%) |
| 90 or more Minutes | 221 (2.5%) | 72 (1.0%) |
Time of Departure to Work by Sex in Evans
The most frequent times of departure to work in Evans are 7:00 AM to 7:29 AM (1,924, 21.5%) for males and 7:30 AM to 7:59 AM (1,146, 16.0%) for females.
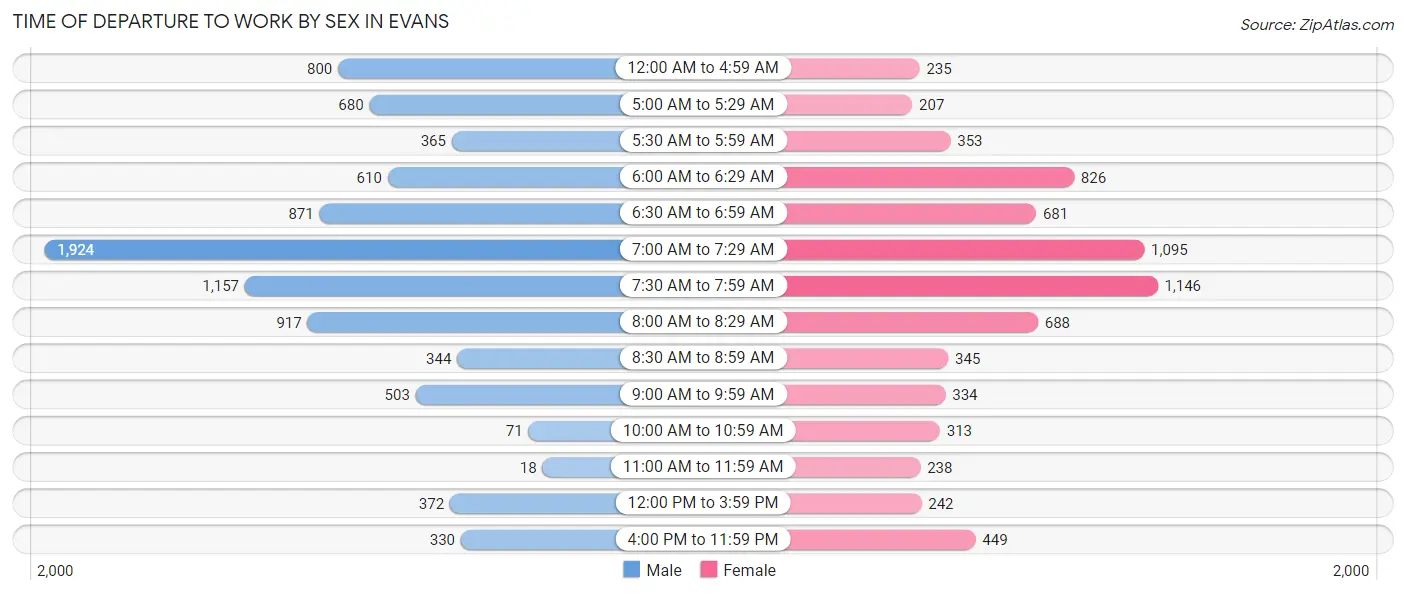
| Time of Departure | Male | Female |
| 12:00 AM to 4:59 AM | 800 (8.9%) | 235 (3.3%) |
| 5:00 AM to 5:29 AM | 680 (7.6%) | 207 (2.9%) |
| 5:30 AM to 5:59 AM | 365 (4.1%) | 353 (4.9%) |
| 6:00 AM to 6:29 AM | 610 (6.8%) | 826 (11.6%) |
| 6:30 AM to 6:59 AM | 871 (9.7%) | 681 (9.5%) |
| 7:00 AM to 7:29 AM | 1,924 (21.5%) | 1,095 (15.3%) |
| 7:30 AM to 7:59 AM | 1,157 (12.9%) | 1,146 (16.0%) |
| 8:00 AM to 8:29 AM | 917 (10.2%) | 688 (9.6%) |
| 8:30 AM to 8:59 AM | 344 (3.8%) | 345 (4.8%) |
| 9:00 AM to 9:59 AM | 503 (5.6%) | 334 (4.7%) |
| 10:00 AM to 10:59 AM | 71 (0.8%) | 313 (4.4%) |
| 11:00 AM to 11:59 AM | 18 (0.2%) | 238 (3.3%) |
| 12:00 PM to 3:59 PM | 372 (4.2%) | 242 (3.4%) |
| 4:00 PM to 11:59 PM | 330 (3.7%) | 449 (6.3%) |
| Total | 8,962 (100.0%) | 7,152 (100.0%) |
Housing Occupancy in Evans
Occupancy by Ownership in Evans
Of the total 11,582 dwellings in Evans, owner-occupied units account for 10,308 (89.0%), while renter-occupied units make up 1,274 (11.0%).
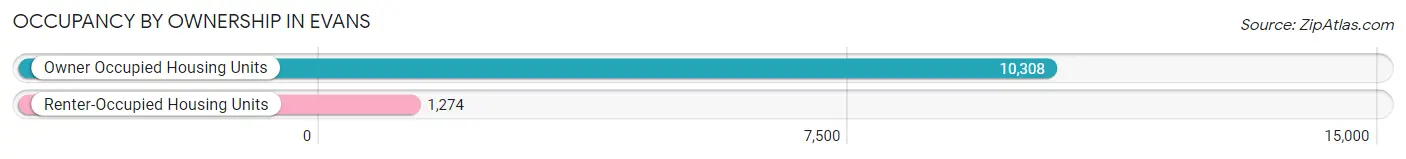
| Occupancy | # Housing Units | % Housing Units |
| Owner Occupied Housing Units | 10,308 | 89.0% |
| Renter-Occupied Housing Units | 1,274 | 11.0% |
| Total Occupied Housing Units | 11,582 | 100.0% |
Occupancy by Household Size in Evans
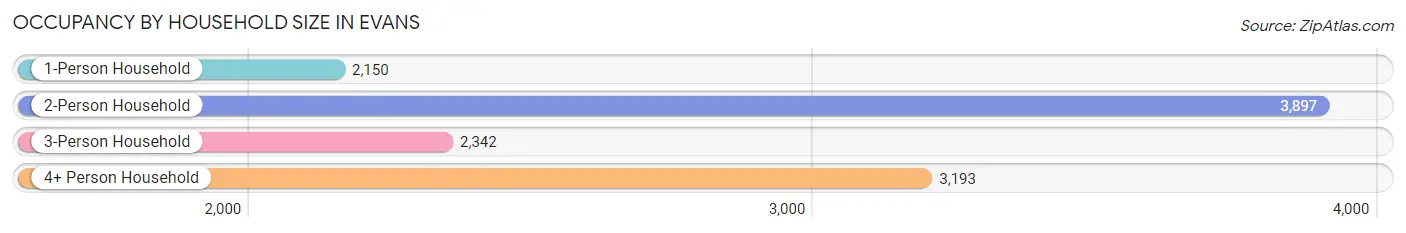
| Household Size | # Housing Units | % Housing Units |
| 1-Person Household | 2,150 | 18.6% |
| 2-Person Household | 3,897 | 33.7% |
| 3-Person Household | 2,342 | 20.2% |
| 4+ Person Household | 3,193 | 27.6% |
| Total Housing Units | 11,582 | 100.0% |
Occupancy by Ownership by Household Size in Evans
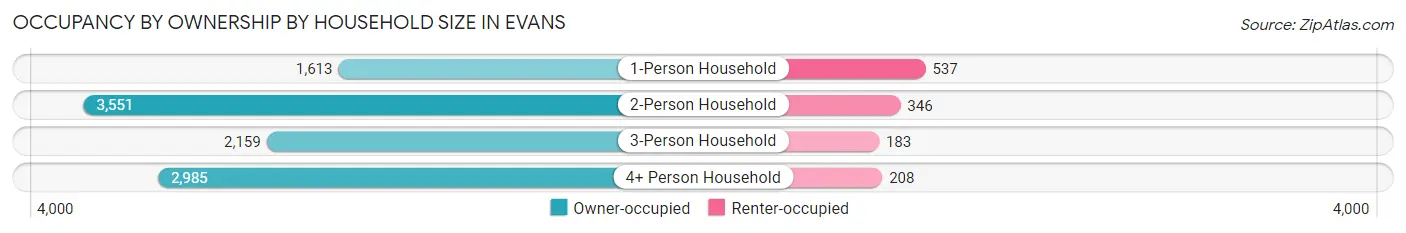
| Household Size | Owner-occupied | Renter-occupied |
| 1-Person Household | 1,613 (75.0%) | 537 (25.0%) |
| 2-Person Household | 3,551 (91.1%) | 346 (8.9%) |
| 3-Person Household | 2,159 (92.2%) | 183 (7.8%) |
| 4+ Person Household | 2,985 (93.5%) | 208 (6.5%) |
| Total Housing Units | 10,308 (89.0%) | 1,274 (11.0%) |
Occupancy by Educational Attainment in Evans
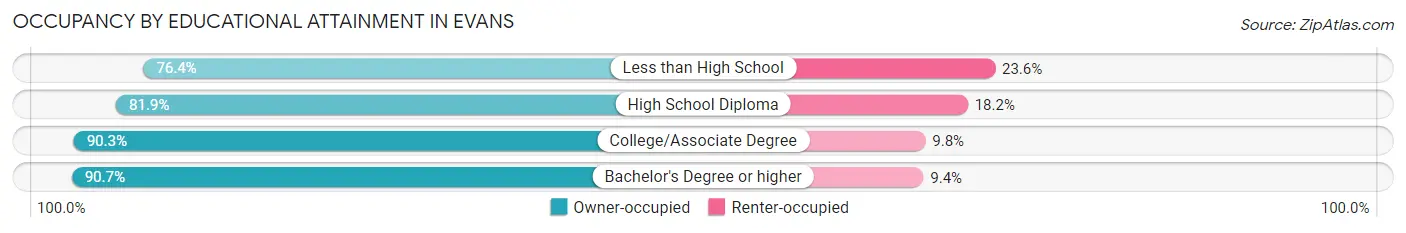
| Household Size | Owner-occupied | Renter-occupied |
| Less than High School | 227 (76.4%) | 70 (23.6%) |
| High School Diploma | 1,263 (81.9%) | 280 (18.1%) |
| College/Associate Degree | 2,982 (90.2%) | 322 (9.8%) |
| Bachelor's Degree or higher | 5,836 (90.6%) | 602 (9.3%) |
Occupancy by Age of Householder in Evans
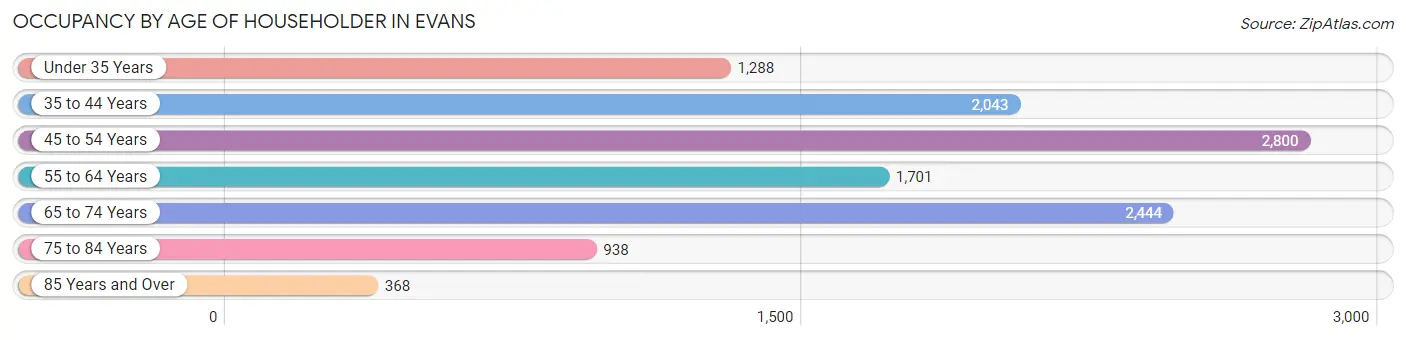
| Age Bracket | # Households | % Households |
| Under 35 Years | 1,288 | 11.1% |
| 35 to 44 Years | 2,043 | 17.6% |
| 45 to 54 Years | 2,800 | 24.2% |
| 55 to 64 Years | 1,701 | 14.7% |
| 65 to 74 Years | 2,444 | 21.1% |
| 75 to 84 Years | 938 | 8.1% |
| 85 Years and Over | 368 | 3.2% |
| Total | 11,582 | 100.0% |
Housing Finances in Evans
Median Income by Occupancy in Evans
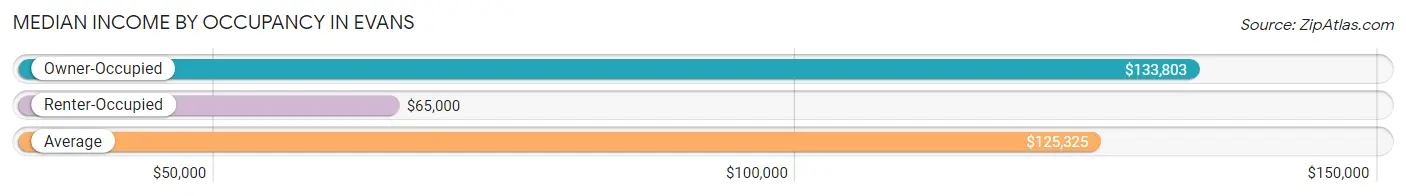
| Occupancy Type | # Households | Median Income |
| Owner-Occupied | 10,308 (89.0%) | $133,803 |
| Renter-Occupied | 1,274 (11.0%) | $65,000 |
| Average | 11,582 (100.0%) | $125,325 |
Occupancy by Householder Income Bracket in Evans
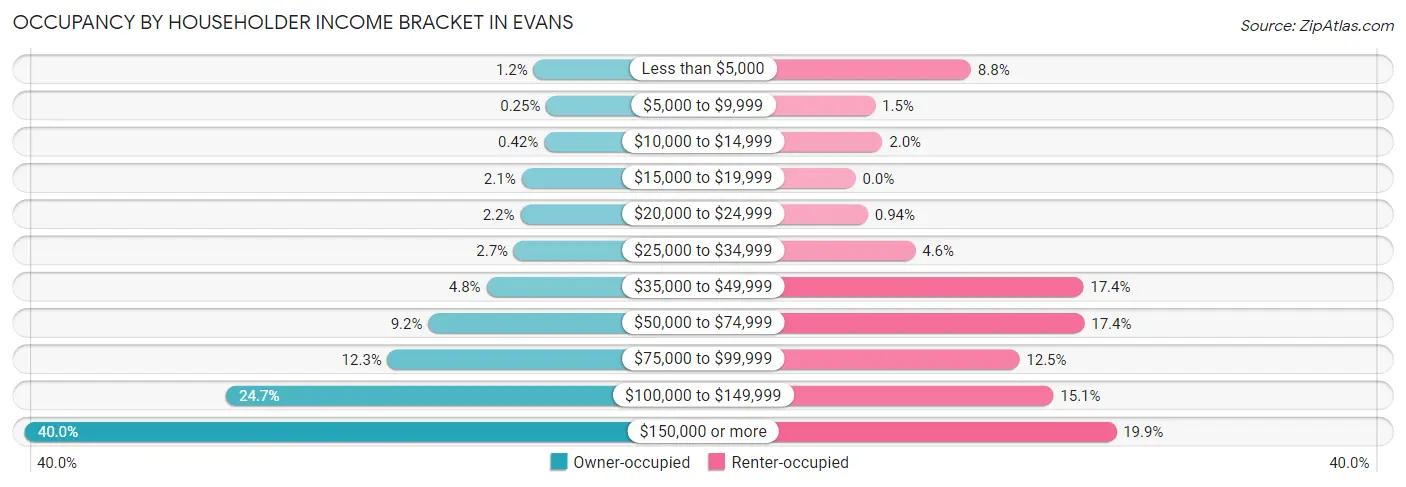
| Income Bracket | Owner-occupied | Renter-occupied |
| Less than $5,000 | 126 (1.2%) | 112 (8.8%) |
| $5,000 to $9,999 | 26 (0.3%) | 19 (1.5%) |
| $10,000 to $14,999 | 43 (0.4%) | 26 (2.0%) |
| $15,000 to $19,999 | 221 (2.1%) | 0 (0.0%) |
| $20,000 to $24,999 | 230 (2.2%) | 12 (0.9%) |
| $25,000 to $34,999 | 280 (2.7%) | 58 (4.5%) |
| $35,000 to $49,999 | 496 (4.8%) | 221 (17.3%) |
| $50,000 to $74,999 | 952 (9.2%) | 222 (17.4%) |
| $75,000 to $99,999 | 1,272 (12.3%) | 159 (12.5%) |
| $100,000 to $149,999 | 2,541 (24.6%) | 192 (15.1%) |
| $150,000 or more | 4,121 (40.0%) | 253 (19.9%) |
| Total | 10,308 (100.0%) | 1,274 (100.0%) |
Monthly Housing Cost Tiers in Evans
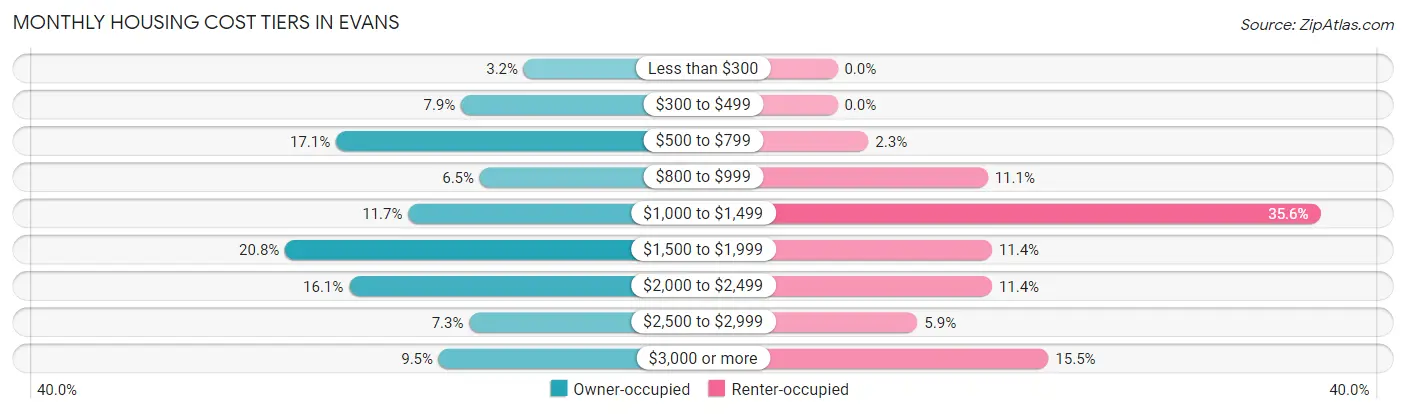
| Monthly Cost | Owner-occupied | Renter-occupied |
| Less than $300 | 333 (3.2%) | 0 (0.0%) |
| $300 to $499 | 809 (7.9%) | 0 (0.0%) |
| $500 to $799 | 1,759 (17.1%) | 29 (2.3%) |
| $800 to $999 | 667 (6.5%) | 141 (11.1%) |
| $1,000 to $1,499 | 1,210 (11.7%) | 453 (35.6%) |
| $1,500 to $1,999 | 2,145 (20.8%) | 145 (11.4%) |
| $2,000 to $2,499 | 1,660 (16.1%) | 145 (11.4%) |
| $2,500 to $2,999 | 747 (7.2%) | 75 (5.9%) |
| $3,000 or more | 978 (9.5%) | 198 (15.5%) |
| Total | 10,308 (100.0%) | 1,274 (100.0%) |
Physical Housing Characteristics in Evans
Housing Structures in Evans
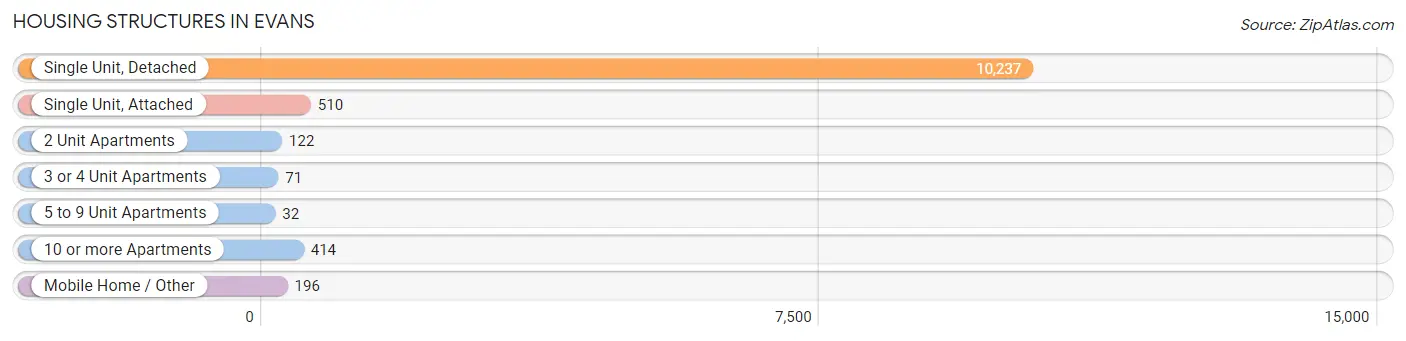
| Structure Type | # Housing Units | % Housing Units |
| Single Unit, Detached | 10,237 | 88.4% |
| Single Unit, Attached | 510 | 4.4% |
| 2 Unit Apartments | 122 | 1.1% |
| 3 or 4 Unit Apartments | 71 | 0.6% |
| 5 to 9 Unit Apartments | 32 | 0.3% |
| 10 or more Apartments | 414 | 3.6% |
| Mobile Home / Other | 196 | 1.7% |
| Total | 11,582 | 100.0% |
Housing Structures by Occupancy in Evans
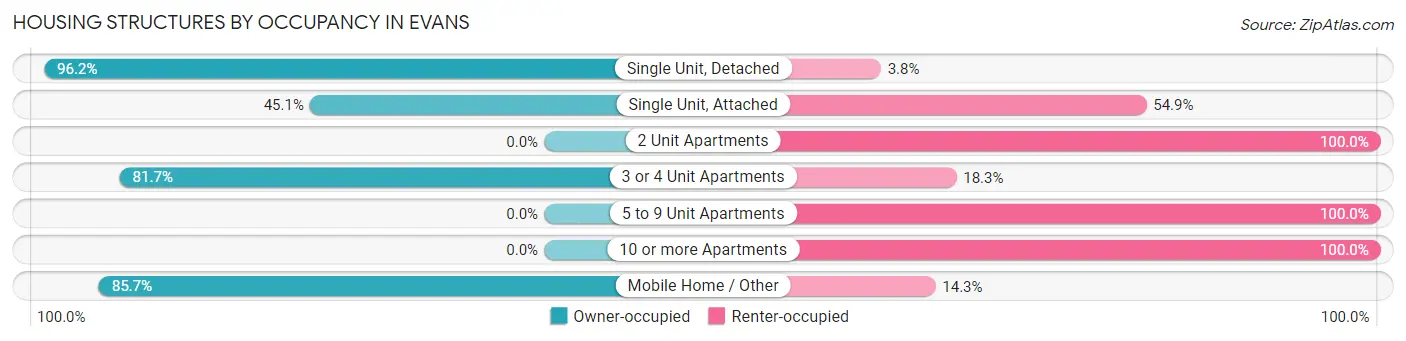
| Structure Type | Owner-occupied | Renter-occupied |
| Single Unit, Detached | 9,852 (96.2%) | 385 (3.8%) |
| Single Unit, Attached | 230 (45.1%) | 280 (54.9%) |
| 2 Unit Apartments | 0 (0.0%) | 122 (100.0%) |
| 3 or 4 Unit Apartments | 58 (81.7%) | 13 (18.3%) |
| 5 to 9 Unit Apartments | 0 (0.0%) | 32 (100.0%) |
| 10 or more Apartments | 0 (0.0%) | 414 (100.0%) |
| Mobile Home / Other | 168 (85.7%) | 28 (14.3%) |
| Total | 10,308 (89.0%) | 1,274 (11.0%) |
Housing Structures by Number of Rooms in Evans
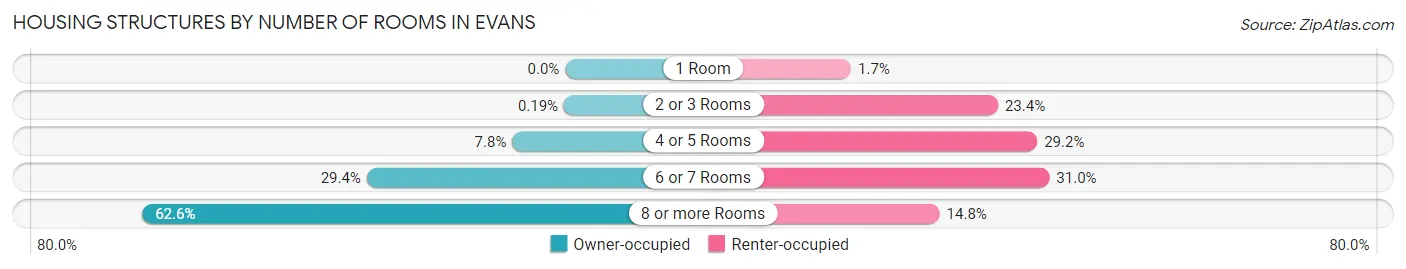
| Number of Rooms | Owner-occupied | Renter-occupied |
| 1 Room | 0 (0.0%) | 21 (1.7%) |
| 2 or 3 Rooms | 20 (0.2%) | 298 (23.4%) |
| 4 or 5 Rooms | 808 (7.8%) | 372 (29.2%) |
| 6 or 7 Rooms | 3,028 (29.4%) | 395 (31.0%) |
| 8 or more Rooms | 6,452 (62.6%) | 188 (14.8%) |
| Total | 10,308 (100.0%) | 1,274 (100.0%) |
Housing Structure by Heating Type in Evans
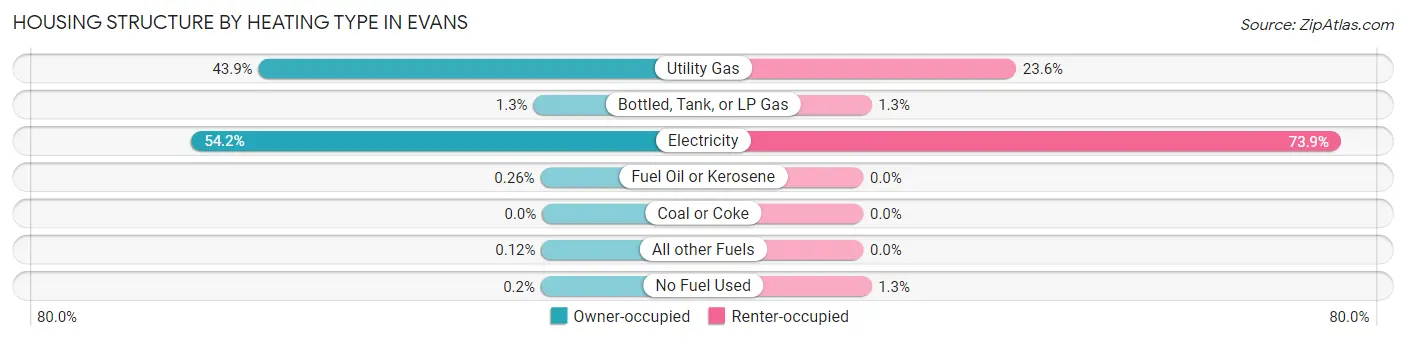
| Heating Type | Owner-occupied | Renter-occupied |
| Utility Gas | 4,520 (43.9%) | 301 (23.6%) |
| Bottled, Tank, or LP Gas | 138 (1.3%) | 16 (1.3%) |
| Electricity | 5,590 (54.2%) | 941 (73.9%) |
| Fuel Oil or Kerosene | 27 (0.3%) | 0 (0.0%) |
| Coal or Coke | 0 (0.0%) | 0 (0.0%) |
| All other Fuels | 12 (0.1%) | 0 (0.0%) |
| No Fuel Used | 21 (0.2%) | 16 (1.3%) |
| Total | 10,308 (100.0%) | 1,274 (100.0%) |
Household Vehicle Usage in Evans
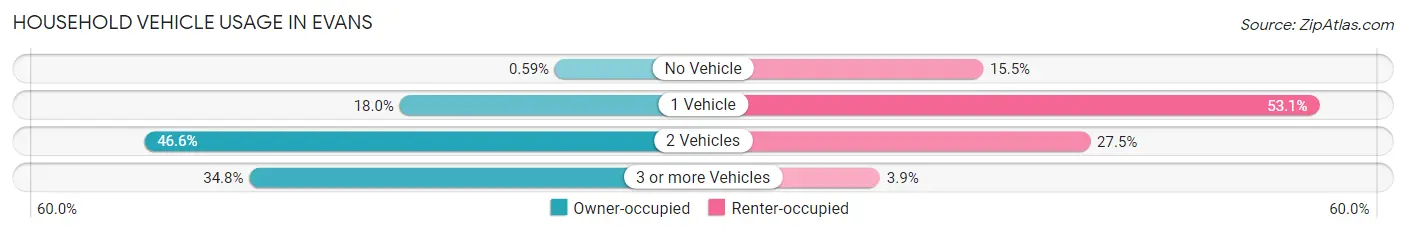
| Vehicles per Household | Owner-occupied | Renter-occupied |
| No Vehicle | 61 (0.6%) | 197 (15.5%) |
| 1 Vehicle | 1,853 (18.0%) | 677 (53.1%) |
| 2 Vehicles | 4,804 (46.6%) | 350 (27.5%) |
| 3 or more Vehicles | 3,590 (34.8%) | 50 (3.9%) |
| Total | 10,308 (100.0%) | 1,274 (100.0%) |
Real Estate & Mortgages in Evans
Real Estate and Mortgage Overview in Evans
| Characteristic | Without Mortgage | With Mortgage |
| Housing Units | 3,582 | 6,726 |
| Median Property Value | $296,600 | $323,700 |
| Median Household Income | $105,789 | $3,046 |
| Monthly Housing Costs | $595 | $978 |
| Real Estate Taxes | $2,301 | $12 |
Property Value by Mortgage Status in Evans
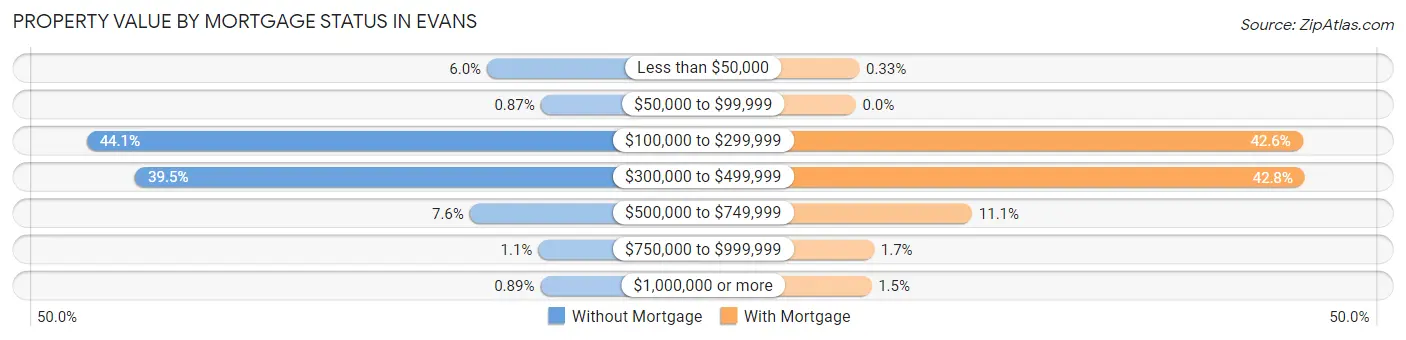
| Property Value | Without Mortgage | With Mortgage |
| Less than $50,000 | 214 (6.0%) | 22 (0.3%) |
| $50,000 to $99,999 | 31 (0.9%) | 0 (0.0%) |
| $100,000 to $299,999 | 1,579 (44.1%) | 2,864 (42.6%) |
| $300,000 to $499,999 | 1,414 (39.5%) | 2,878 (42.8%) |
| $500,000 to $749,999 | 273 (7.6%) | 745 (11.1%) |
| $750,000 to $999,999 | 39 (1.1%) | 117 (1.7%) |
| $1,000,000 or more | 32 (0.9%) | 100 (1.5%) |
| Total | 3,582 (100.0%) | 6,726 (100.0%) |
Household Income by Mortgage Status in Evans
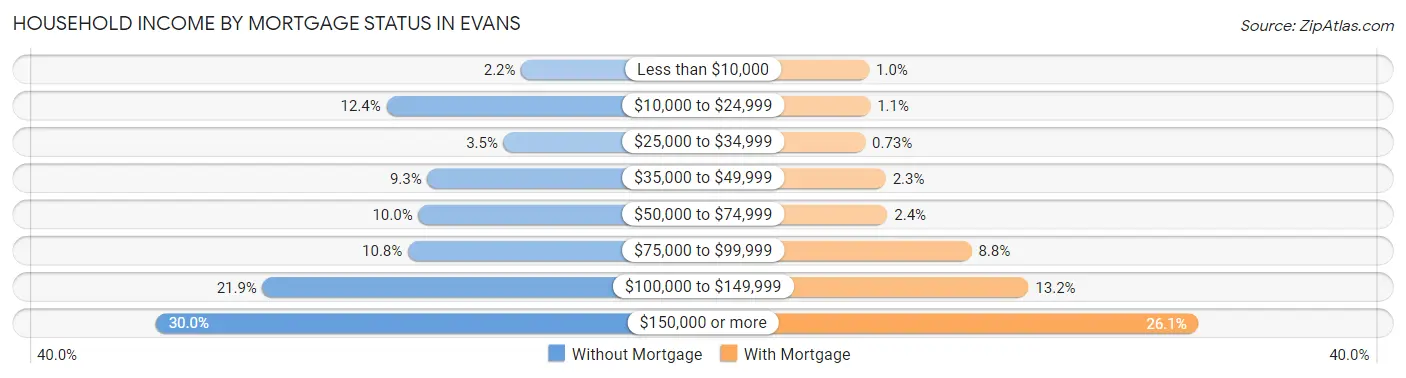
| Household Income | Without Mortgage | With Mortgage |
| Less than $10,000 | 77 (2.1%) | 69 (1.0%) |
| $10,000 to $24,999 | 445 (12.4%) | 75 (1.1%) |
| $25,000 to $34,999 | 125 (3.5%) | 49 (0.7%) |
| $35,000 to $49,999 | 333 (9.3%) | 155 (2.3%) |
| $50,000 to $74,999 | 358 (10.0%) | 163 (2.4%) |
| $75,000 to $99,999 | 386 (10.8%) | 594 (8.8%) |
| $100,000 to $149,999 | 783 (21.9%) | 886 (13.2%) |
| $150,000 or more | 1,075 (30.0%) | 1,758 (26.1%) |
| Total | 3,582 (100.0%) | 6,726 (100.0%) |
Property Value to Household Income Ratio in Evans
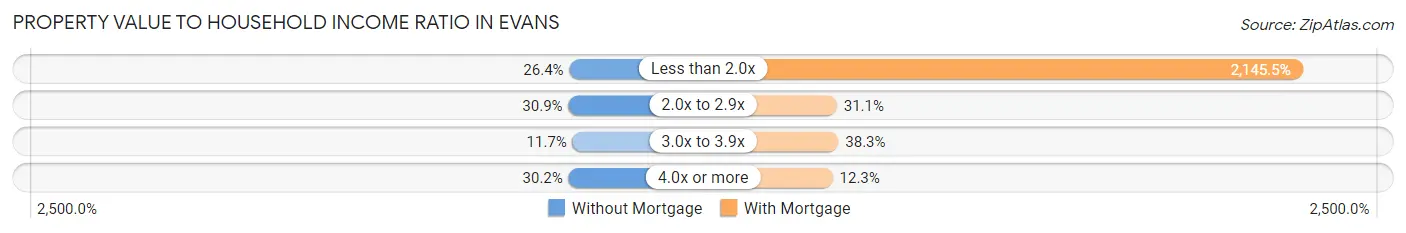
| Value-to-Income Ratio | Without Mortgage | With Mortgage |
| Less than 2.0x | 945 (26.4%) | 144,309 (2,145.5%) |
| 2.0x to 2.9x | 1,107 (30.9%) | 2,093 (31.1%) |
| 3.0x to 3.9x | 420 (11.7%) | 2,574 (38.3%) |
| 4.0x or more | 1,080 (30.1%) | 826 (12.3%) |
| Total | 3,582 (100.0%) | 6,726 (100.0%) |
Real Estate Taxes by Mortgage Status in Evans
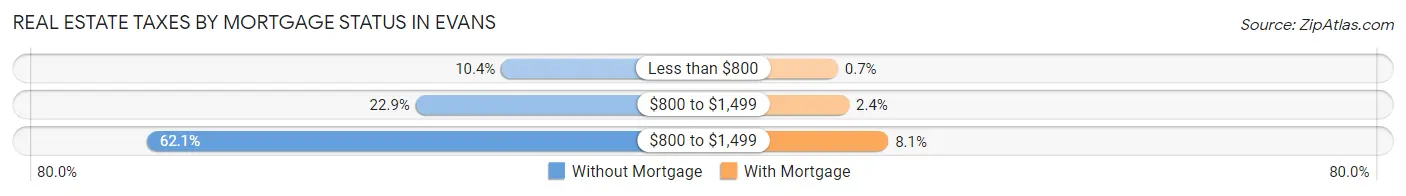
| Property Taxes | Without Mortgage | With Mortgage |
| Less than $800 | 371 (10.4%) | 47 (0.7%) |
| $800 to $1,499 | 819 (22.9%) | 158 (2.4%) |
| $800 to $1,499 | 2,226 (62.1%) | 542 (8.1%) |
| Total | 3,582 (100.0%) | 6,726 (100.0%) |
Health & Disability in Evans
Health Insurance Coverage by Age in Evans
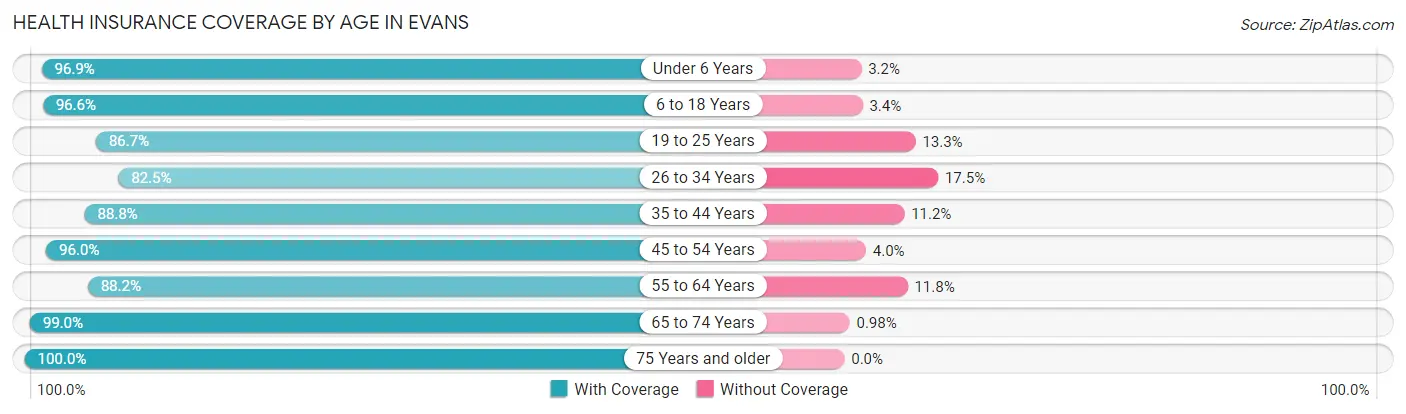
| Age Bracket | With Coverage | Without Coverage |
| Under 6 Years | 2,244 (96.9%) | 73 (3.2%) |
| 6 to 18 Years | 7,237 (96.6%) | 253 (3.4%) |
| 19 to 25 Years | 2,437 (86.7%) | 373 (13.3%) |
| 26 to 34 Years | 2,442 (82.5%) | 517 (17.5%) |
| 35 to 44 Years | 3,841 (88.8%) | 483 (11.2%) |
| 45 to 54 Years | 5,638 (96.0%) | 236 (4.0%) |
| 55 to 64 Years | 3,723 (88.2%) | 497 (11.8%) |
| 65 to 74 Years | 4,637 (99.0%) | 46 (1.0%) |
| 75 Years and older | 2,117 (100.0%) | 0 (0.0%) |
| Total | 34,316 (93.3%) | 2,478 (6.7%) |
Health Insurance Coverage by Citizenship Status in Evans
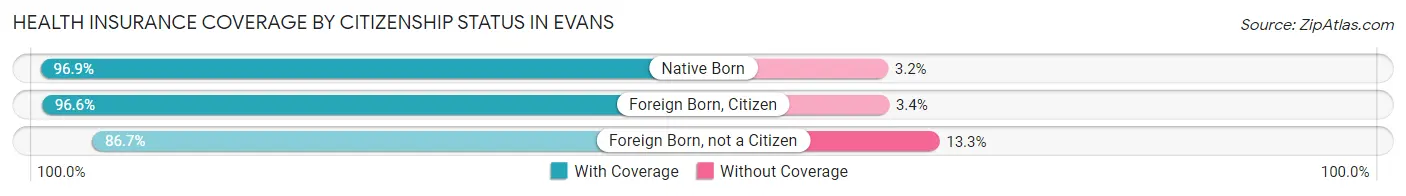
| Citizenship Status | With Coverage | Without Coverage |
| Native Born | 2,244 (96.9%) | 73 (3.2%) |
| Foreign Born, Citizen | 7,237 (96.6%) | 253 (3.4%) |
| Foreign Born, not a Citizen | 2,437 (86.7%) | 373 (13.3%) |
Health Insurance Coverage by Household Income in Evans
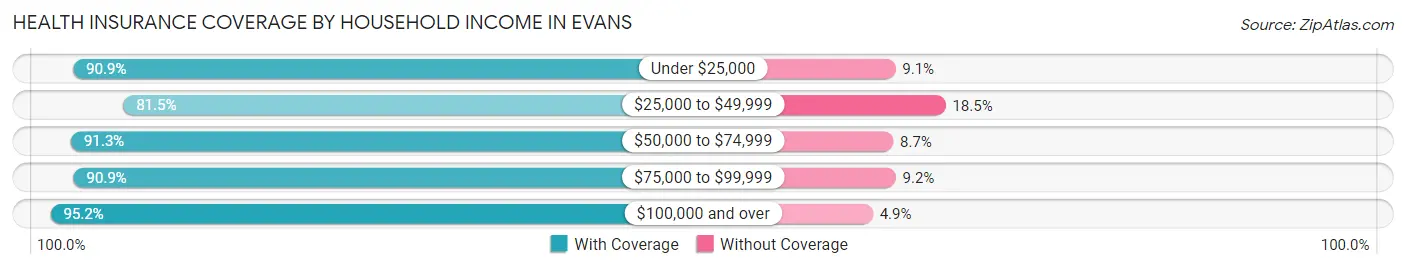
| Household Income | With Coverage | Without Coverage |
| Under $25,000 | 1,659 (90.9%) | 166 (9.1%) |
| $25,000 to $49,999 | 1,922 (81.5%) | 436 (18.5%) |
| $50,000 to $74,999 | 2,219 (91.3%) | 211 (8.7%) |
| $75,000 to $99,999 | 4,109 (90.8%) | 414 (9.1%) |
| $100,000 and over | 24,360 (95.2%) | 1,242 (4.9%) |
Public vs Private Health Insurance Coverage by Age in Evans
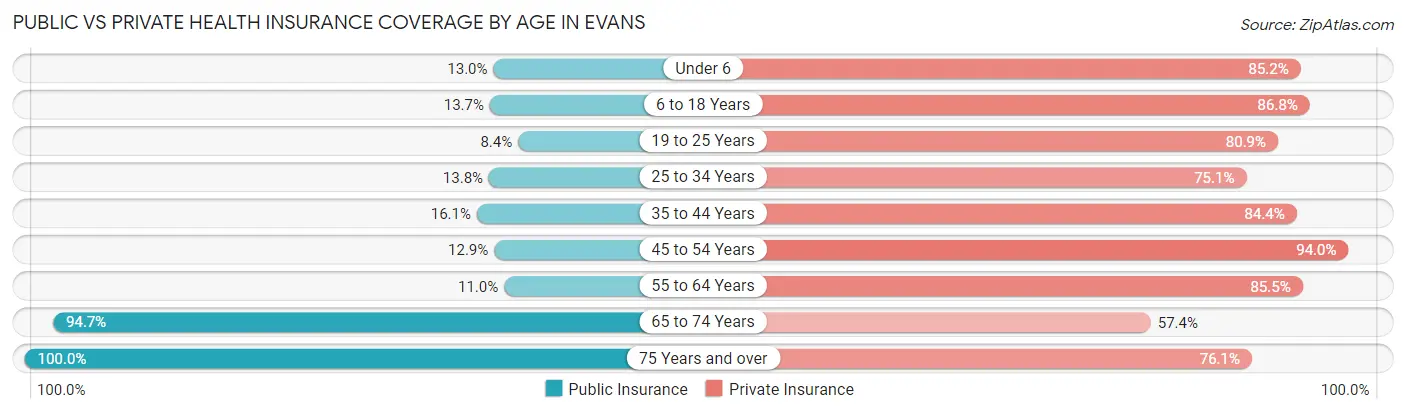
| Age Bracket | Public Insurance | Private Insurance |
| Under 6 | 301 (13.0%) | 1,973 (85.2%) |
| 6 to 18 Years | 1,023 (13.7%) | 6,504 (86.8%) |
| 19 to 25 Years | 236 (8.4%) | 2,274 (80.9%) |
| 25 to 34 Years | 409 (13.8%) | 2,221 (75.1%) |
| 35 to 44 Years | 695 (16.1%) | 3,650 (84.4%) |
| 45 to 54 Years | 755 (12.9%) | 5,522 (94.0%) |
| 55 to 64 Years | 464 (11.0%) | 3,608 (85.5%) |
| 65 to 74 Years | 4,436 (94.7%) | 2,686 (57.4%) |
| 75 Years and over | 2,117 (100.0%) | 1,611 (76.1%) |
| Total | 10,436 (28.4%) | 30,049 (81.7%) |
Disability Status by Sex by Age in Evans
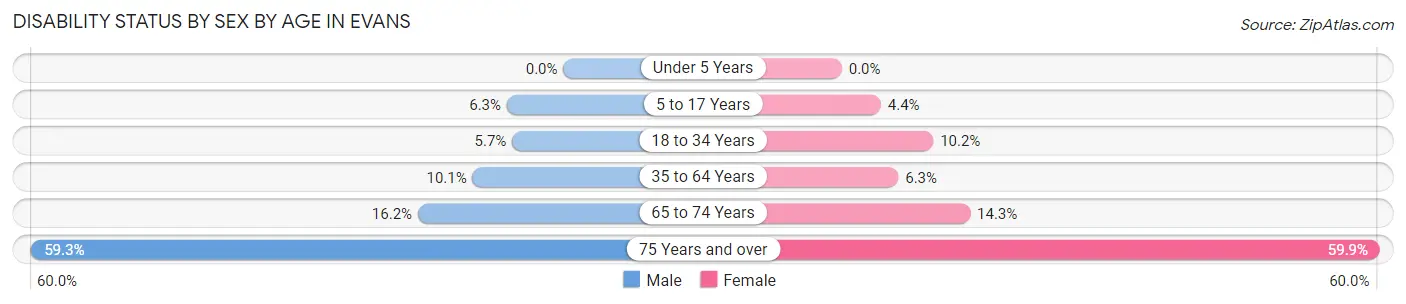
| Age Bracket | Male | Female |
| Under 5 Years | 0 (0.0%) | 0 (0.0%) |
| 5 to 17 Years | 237 (6.3%) | 154 (4.3%) |
| 18 to 34 Years | 195 (5.7%) | 293 (10.2%) |
| 35 to 64 Years | 694 (10.1%) | 475 (6.3%) |
| 65 to 74 Years | 371 (16.2%) | 342 (14.3%) |
| 75 Years and over | 669 (59.3%) | 592 (59.9%) |
Disability Class by Sex by Age in Evans
Disability Class: Hearing Difficulty
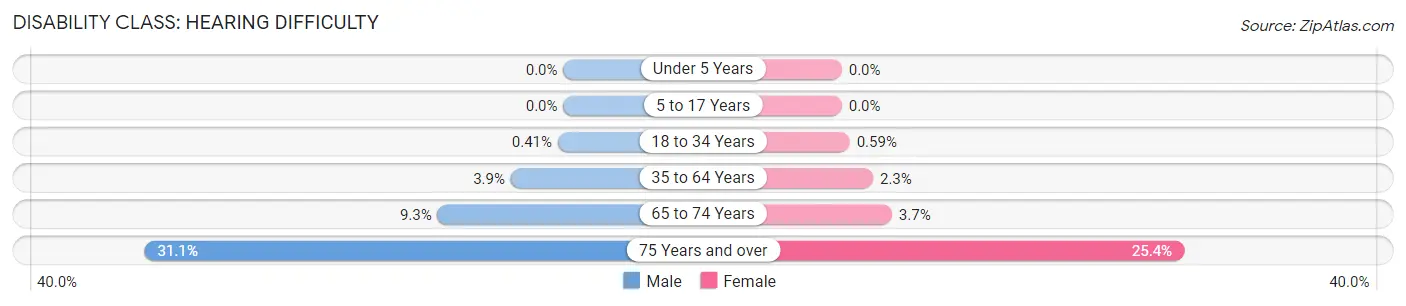
| Age Bracket | Male | Female |
| Under 5 Years | 0 (0.0%) | 0 (0.0%) |
| 5 to 17 Years | 0 (0.0%) | 0 (0.0%) |
| 18 to 34 Years | 14 (0.4%) | 17 (0.6%) |
| 35 to 64 Years | 268 (3.9%) | 175 (2.3%) |
| 65 to 74 Years | 214 (9.3%) | 89 (3.7%) |
| 75 Years and over | 351 (31.1%) | 251 (25.4%) |
Disability Class: Vision Difficulty
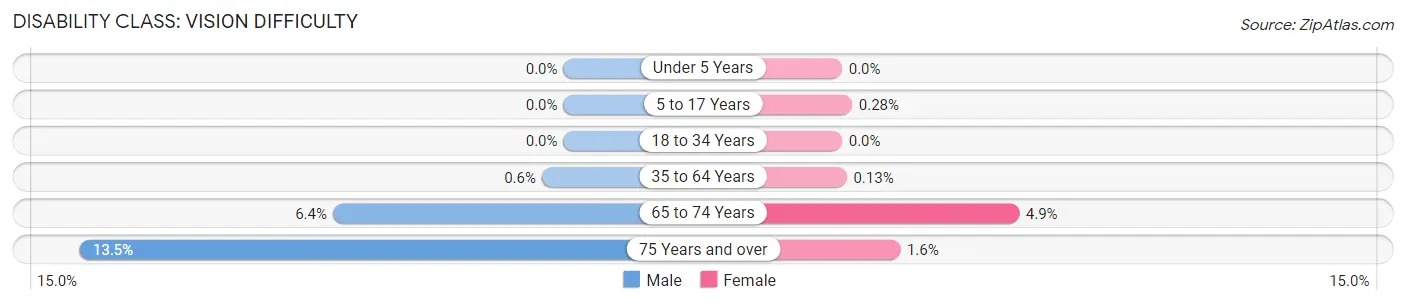
| Age Bracket | Male | Female |
| Under 5 Years | 0 (0.0%) | 0 (0.0%) |
| 5 to 17 Years | 0 (0.0%) | 10 (0.3%) |
| 18 to 34 Years | 0 (0.0%) | 0 (0.0%) |
| 35 to 64 Years | 41 (0.6%) | 10 (0.1%) |
| 65 to 74 Years | 147 (6.4%) | 118 (4.9%) |
| 75 Years and over | 152 (13.5%) | 16 (1.6%) |
Disability Class: Cognitive Difficulty
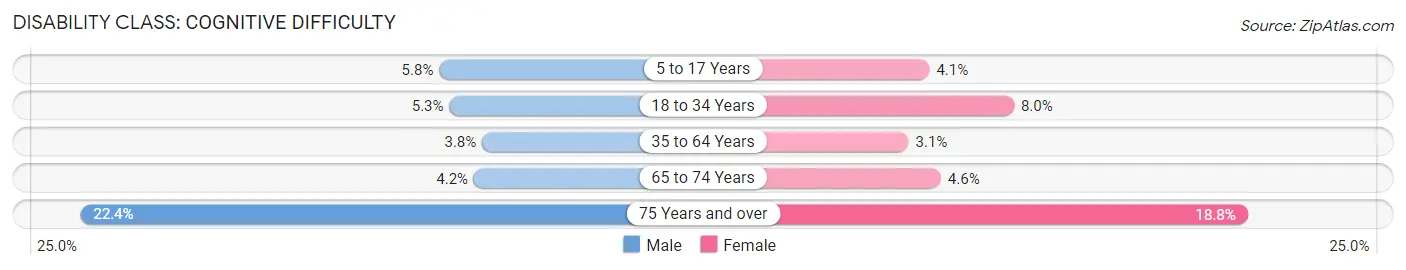
| Age Bracket | Male | Female |
| 5 to 17 Years | 217 (5.8%) | 144 (4.1%) |
| 18 to 34 Years | 181 (5.3%) | 230 (8.0%) |
| 35 to 64 Years | 259 (3.8%) | 234 (3.1%) |
| 65 to 74 Years | 95 (4.2%) | 110 (4.6%) |
| 75 Years and over | 253 (22.4%) | 186 (18.8%) |
Disability Class: Ambulatory Difficulty
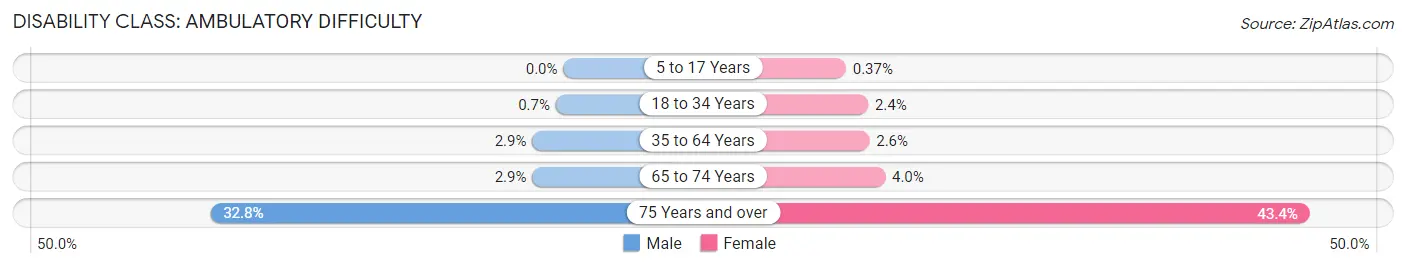
| Age Bracket | Male | Female |
| 5 to 17 Years | 0 (0.0%) | 13 (0.4%) |
| 18 to 34 Years | 24 (0.7%) | 70 (2.4%) |
| 35 to 64 Years | 198 (2.9%) | 193 (2.5%) |
| 65 to 74 Years | 66 (2.9%) | 96 (4.0%) |
| 75 Years and over | 370 (32.8%) | 429 (43.4%) |
Disability Class: Self-Care Difficulty
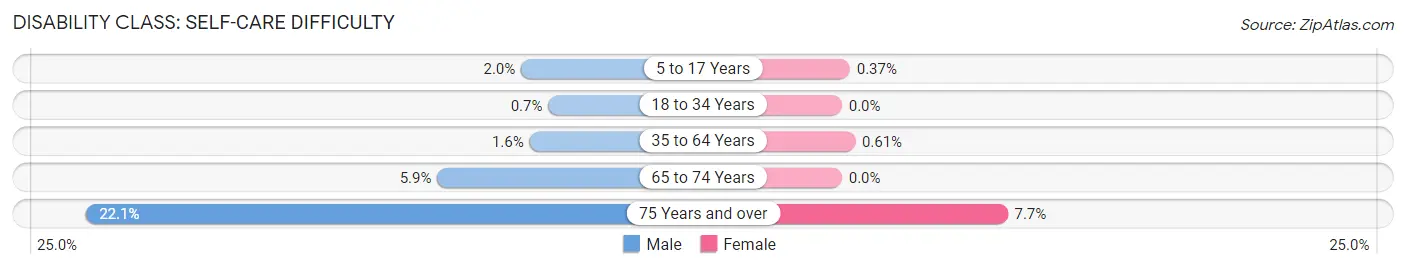
| Age Bracket | Male | Female |
| 5 to 17 Years | 74 (2.0%) | 13 (0.4%) |
| 18 to 34 Years | 24 (0.7%) | 0 (0.0%) |
| 35 to 64 Years | 108 (1.6%) | 46 (0.6%) |
| 65 to 74 Years | 134 (5.9%) | 0 (0.0%) |
| 75 Years and over | 250 (22.1%) | 76 (7.7%) |
Technology Access in Evans
Computing Device Access in Evans
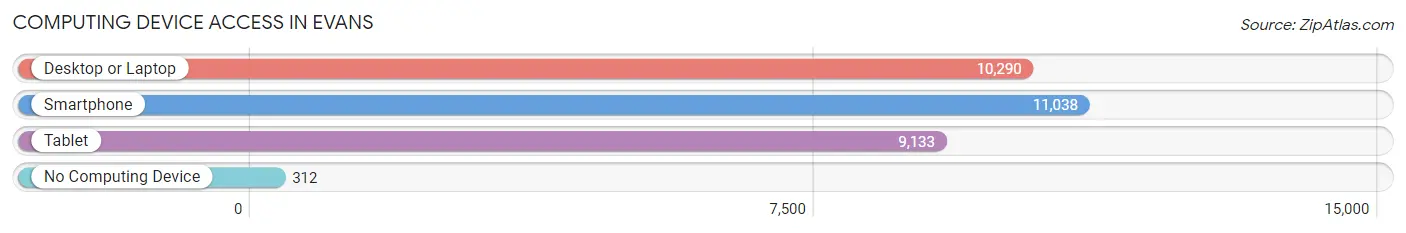
| Device Type | # Households | % Households |
| Desktop or Laptop | 10,290 | 88.8% |
| Smartphone | 11,038 | 95.3% |
| Tablet | 9,133 | 78.9% |
| No Computing Device | 312 | 2.7% |
| Total | 11,582 | 100.0% |
Internet Access in Evans
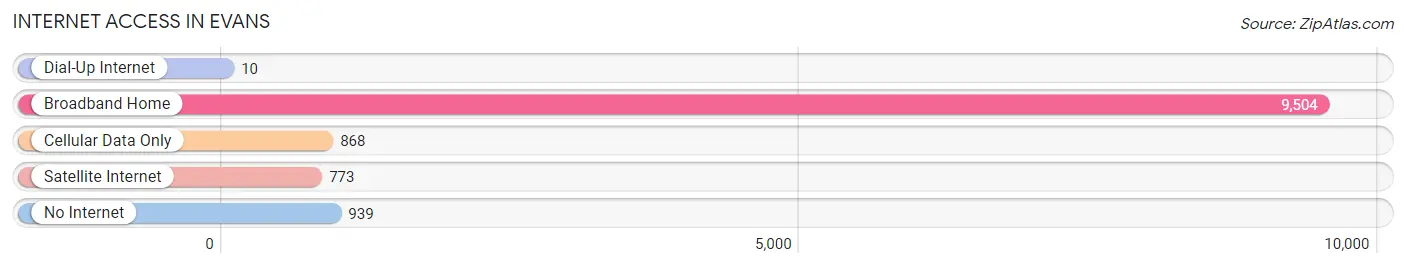
| Internet Type | # Households | % Households |
| Dial-Up Internet | 10 | 0.1% |
| Broadband Home | 9,504 | 82.1% |
| Cellular Data Only | 868 | 7.5% |
| Satellite Internet | 773 | 6.7% |
| No Internet | 939 | 8.1% |
| Total | 11,582 | 100.0% |
Evans Summary
Evans, Georgia is a city located in Columbia County, Georgia, United States. It is part of the Augusta-Richmond County Metropolitan Statistical Area. The population was estimated to be 30,858 in 2019.
History
The area that is now Evans was first settled in the early 1800s by the Creek Indians. The Creek Indians were forced to leave the area in 1825 when the Treaty of Indian Springs was signed. The area was then settled by European-American settlers in the 1830s. The town was named after Confederate General Clement A. Evans. The town was incorporated in 1871.
Geography
Evans is located in Columbia County, Georgia, United States. It is part of the Augusta-Richmond County Metropolitan Statistical Area. The city is situated on the Savannah River, which forms the border between Georgia and South Carolina. The city has a total area of 16.3 square miles, of which 16.2 square miles is land and 0.1 square miles is water.
Economy
Evans is home to a variety of businesses and industries. The city is home to several large employers, including Club Car, a golf cart manufacturer, and John Deere, a tractor and agricultural equipment manufacturer. Other major employers include the University Hospital, the Medical College of Georgia, and the Augusta National Golf Club.
The city is also home to a variety of retail stores, restaurants, and other businesses. The city is home to several shopping centers, including the Evans Towne Center, which is home to a variety of stores and restaurants.
Demographics
As of the 2019 census, the population of Evans was estimated to be 30,858. The racial makeup of the city was 79.2% White, 14.3% African American, 0.3% Native American, 2.2% Asian, 0.1% Pacific Islander, 1.7% from other races, and 2.4% from two or more races. Hispanic or Latino of any race were 4.7% of the population.
The median household income in Evans was $63,945 in 2019. The per capita income for the city was $30,945. About 8.3% of the population was below the poverty line.
Evans is served by the Columbia County School System. The city is home to several public schools, including Evans High School, Greenbrier High School, and Lakeside High School. The city is also home to several private schools, including Augusta Preparatory Day School and Westminster Schools of Augusta.
Common Questions
What is Per Capita Income in Evans?
Per Capita income in Evans is $47,760.
What is the Median Family Income in Evans?
Median Family Income in Evans is $140,329.
What is the Median Household income in Evans?
Median Household Income in Evans is $125,325.
What is Income or Wage Gap in Evans?
Income or Wage Gap in Evans is 39.6%.
Women in Evans earn 60.4 cents for every dollar earned by a man.
What is Inequality or Gini Index in Evans?
Inequality or Gini Index in Evans is 0.37.
What is the Total Population of Evans?
Total Population of Evans is 37,456.
What is the Total Male Population of Evans?
Total Male Population of Evans is 18,996.
What is the Total Female Population of Evans?
Total Female Population of Evans is 18,460.
What is the Ratio of Males per 100 Females in Evans?
There are 102.90 Males per 100 Females in Evans.
What is the Ratio of Females per 100 Males in Evans?
There are 97.18 Females per 100 Males in Evans.
What is the Median Population Age in Evans?
Median Population Age in Evans is 41.9 Years.
What is the Average Family Size in Evans
Average Family Size in Evans is 3.6 People.
What is the Average Household Size in Evans
Average Household Size in Evans is 3.2 People.
How Large is the Labor Force in Evans?
There are 18,464 People in the Labor Forcein in Evans.
What is the Percentage of People in the Labor Force in Evans?
62.4% of People are in the Labor Force in Evans.
What is the Unemployment Rate in Evans?
Unemployment Rate in Evans is 5.5%.