Zimbabwean vs Apache In Labor Force | Age 30-34
COMPARE
Zimbabwean
Apache
In Labor Force | Age 30-34
In Labor Force | Age 30-34 Comparison
Zimbabweans
Apache
85.6%
IN LABOR FORCE | AGE 30-34
99.8/ 100
METRIC RATING
42nd/ 347
METRIC RANK
79.0%
IN LABOR FORCE | AGE 30-34
0.0/ 100
METRIC RATING
339th/ 347
METRIC RANK
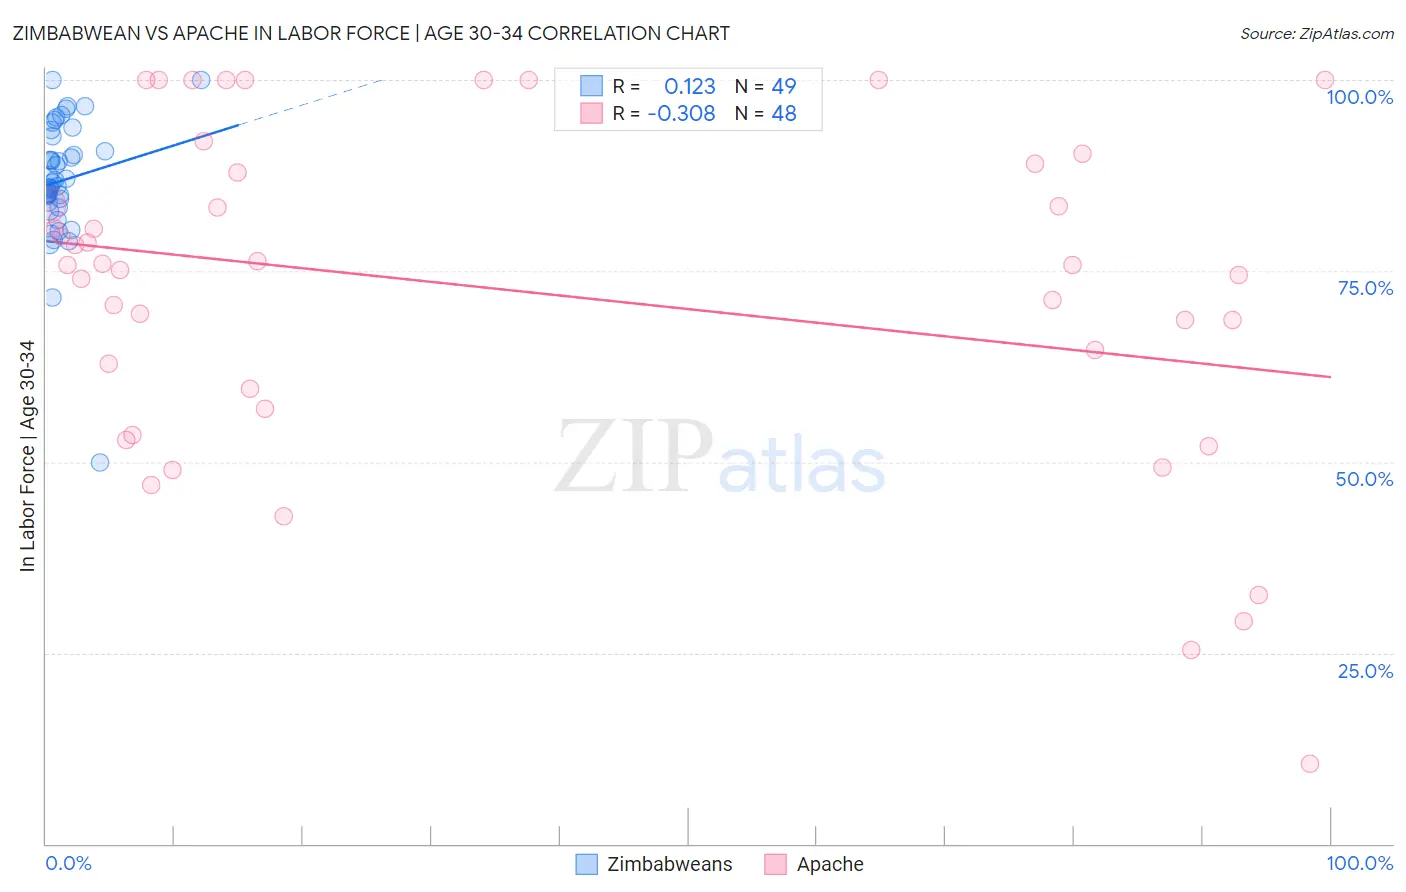
Zimbabwean vs Apache In Labor Force | Age 30-34 Correlation Chart
The statistical analysis conducted on geographies consisting of 69,193,973 people shows a poor positive correlation between the proportion of Zimbabweans and labor force participation rate among population between the ages 30 and 34 in the United States with a correlation coefficient (R) of 0.123 and weighted average of 85.6%. Similarly, the statistical analysis conducted on geographies consisting of 231,033,691 people shows a mild negative correlation between the proportion of Apache and labor force participation rate among population between the ages 30 and 34 in the United States with a correlation coefficient (R) of -0.308 and weighted average of 79.0%, a difference of 8.4%.
In Labor Force | Age 30-34 Correlation Summary
| Measurement | Zimbabwean | Apache |
| Minimum | 50.0% | 10.5% |
| Maximum | 100.0% | 100.0% |
| Range | 50.0% | 89.5% |
| Mean | 86.8% | 72.3% |
| Median | 86.1% | 75.7% |
| Interquartile 25% (IQ1) | 84.2% | 58.3% |
| Interquartile 75% (IQ3) | 91.6% | 88.5% |
| Interquartile Range (IQR) | 7.5% | 30.2% |
| Standard Deviation (Sample) | 8.0% | 21.9% |
| Standard Deviation (Population) | 8.0% | 21.7% |
Similar Demographics by In Labor Force | Age 30-34
Demographics Similar to Zimbabweans by In Labor Force | Age 30-34
In terms of in labor force | age 30-34, the demographic groups most similar to Zimbabweans are Immigrants from Lithuania (85.6%, a difference of 0.0%), Immigrants from Italy (85.7%, a difference of 0.010%), Turkish (85.7%, a difference of 0.030%), Immigrants from Sri Lanka (85.6%, a difference of 0.030%), and Immigrants from Nepal (85.6%, a difference of 0.040%).
| Demographics | Rating | Rank | In Labor Force | Age 30-34 |
| Serbians | 99.9 /100 | #35 | Exceptional 85.8% |
| Albanians | 99.9 /100 | #36 | Exceptional 85.7% |
| Norwegians | 99.9 /100 | #37 | Exceptional 85.7% |
| Immigrants | Greece | 99.9 /100 | #38 | Exceptional 85.7% |
| Eastern Europeans | 99.9 /100 | #39 | Exceptional 85.7% |
| Turks | 99.9 /100 | #40 | Exceptional 85.7% |
| Immigrants | Italy | 99.9 /100 | #41 | Exceptional 85.7% |
| Zimbabweans | 99.8 /100 | #42 | Exceptional 85.6% |
| Immigrants | Lithuania | 99.8 /100 | #43 | Exceptional 85.6% |
| Immigrants | Sri Lanka | 99.8 /100 | #44 | Exceptional 85.6% |
| Immigrants | Nepal | 99.8 /100 | #45 | Exceptional 85.6% |
| Immigrants | Morocco | 99.8 /100 | #46 | Exceptional 85.6% |
| Croatians | 99.8 /100 | #47 | Exceptional 85.6% |
| Immigrants | Sweden | 99.8 /100 | #48 | Exceptional 85.6% |
| Lithuanians | 99.8 /100 | #49 | Exceptional 85.6% |
Demographics Similar to Apache by In Labor Force | Age 30-34
In terms of in labor force | age 30-34, the demographic groups most similar to Apache are Pima (79.0%, a difference of 0.030%), Ute (78.9%, a difference of 0.10%), Yakama (79.1%, a difference of 0.15%), Native/Alaskan (79.2%, a difference of 0.19%), and Marshallese (79.2%, a difference of 0.27%).
| Demographics | Rating | Rank | In Labor Force | Age 30-34 |
| Kiowa | 0.0 /100 | #332 | Tragic 79.8% |
| Inupiat | 0.0 /100 | #333 | Tragic 79.7% |
| Hopi | 0.0 /100 | #334 | Tragic 79.3% |
| Marshallese | 0.0 /100 | #335 | Tragic 79.2% |
| Natives/Alaskans | 0.0 /100 | #336 | Tragic 79.2% |
| Yakama | 0.0 /100 | #337 | Tragic 79.1% |
| Pima | 0.0 /100 | #338 | Tragic 79.0% |
| Apache | 0.0 /100 | #339 | Tragic 79.0% |
| Ute | 0.0 /100 | #340 | Tragic 78.9% |
| Immigrants | Yemen | 0.0 /100 | #341 | Tragic 78.2% |
| Tohono O'odham | 0.0 /100 | #342 | Tragic 77.7% |
| Lumbee | 0.0 /100 | #343 | Tragic 77.3% |
| Yuman | 0.0 /100 | #344 | Tragic 77.1% |
| Yup'ik | 0.0 /100 | #345 | Tragic 76.4% |
| Crow | 0.0 /100 | #346 | Tragic 75.9% |