Immigrants from Eastern Europe vs Yaqui 1 or more Vehicles in Household
COMPARE
Immigrants from Eastern Europe
Yaqui
1 or more Vehicles in Household
1 or more Vehicles in Household Comparison
Immigrants from Eastern Europe
Yaqui
86.7%
1 OR MORE VEHICLES IN HOUSEHOLD
0.0/ 100
METRIC RATING
283rd/ 347
METRIC RANK
92.6%
1 OR MORE VEHICLES IN HOUSEHOLD
100.0/ 100
METRIC RATING
24th/ 347
METRIC RANK
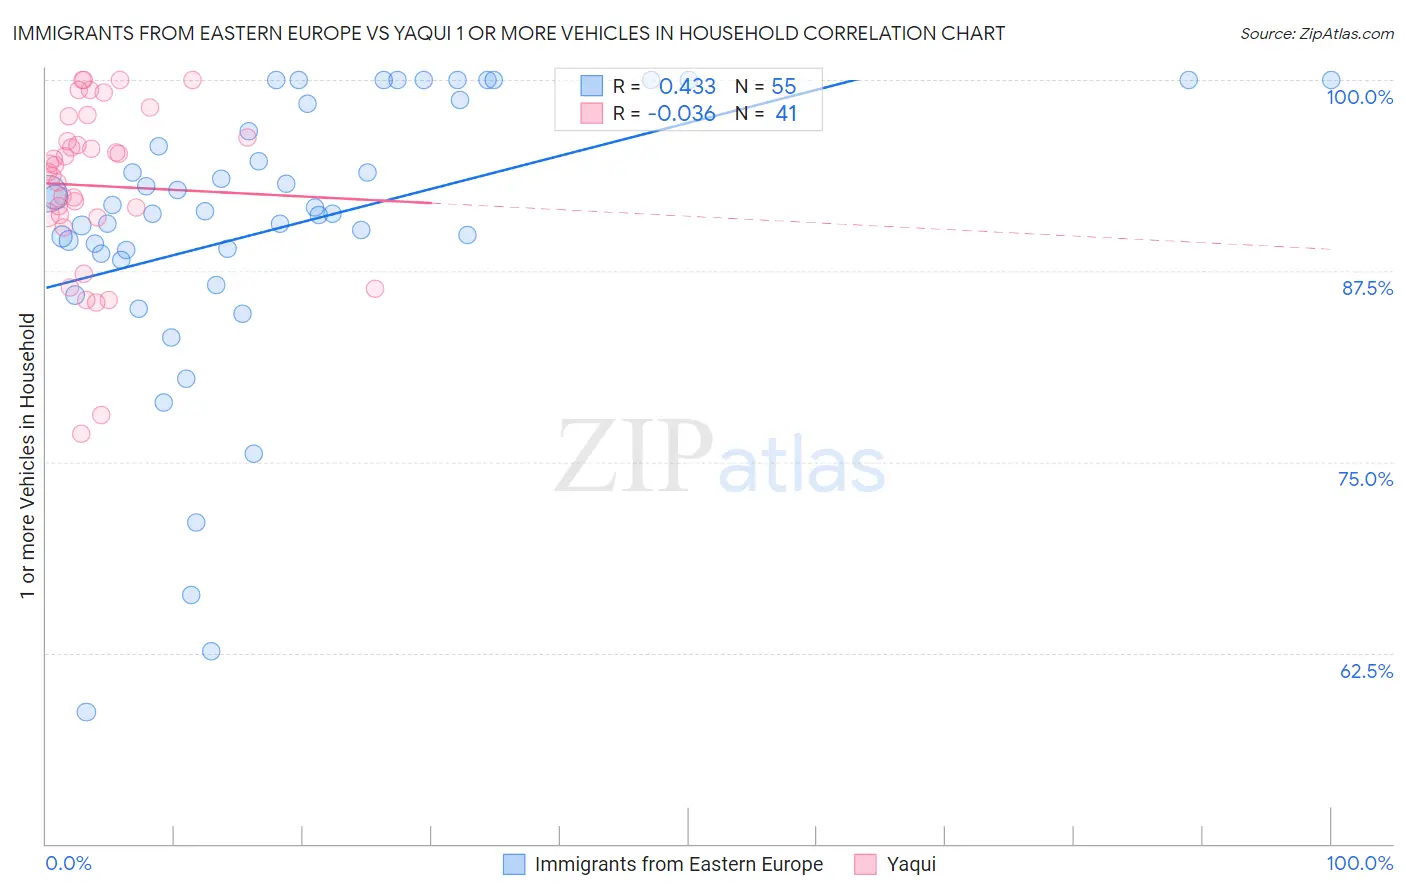
Immigrants from Eastern Europe vs Yaqui 1 or more Vehicles in Household Correlation Chart
The statistical analysis conducted on geographies consisting of 475,429,921 people shows a moderate positive correlation between the proportion of Immigrants from Eastern Europe and percentage of households with 1 or more vehicles available in the United States with a correlation coefficient (R) of 0.433 and weighted average of 86.7%. Similarly, the statistical analysis conducted on geographies consisting of 107,720,236 people shows no correlation between the proportion of Yaqui and percentage of households with 1 or more vehicles available in the United States with a correlation coefficient (R) of -0.036 and weighted average of 92.6%, a difference of 6.7%.
1 or more Vehicles in Household Correlation Summary
| Measurement | Immigrants from Eastern Europe | Yaqui |
| Minimum | 58.6% | 76.8% |
| Maximum | 100.0% | 100.0% |
| Range | 41.4% | 23.2% |
| Mean | 90.4% | 93.1% |
| Median | 91.4% | 94.4% |
| Interquartile 25% (IQ1) | 88.6% | 91.1% |
| Interquartile 75% (IQ3) | 98.5% | 96.9% |
| Interquartile Range (IQR) | 9.8% | 5.8% |
| Standard Deviation (Sample) | 9.4% | 5.6% |
| Standard Deviation (Population) | 9.3% | 5.5% |
Similar Demographics by 1 or more Vehicles in Household
Demographics Similar to Immigrants from Eastern Europe by 1 or more Vehicles in Household
In terms of 1 or more vehicles in household, the demographic groups most similar to Immigrants from Eastern Europe are Central American Indian (86.7%, a difference of 0.0%), Colville (86.8%, a difference of 0.040%), Immigrants from Kazakhstan (86.6%, a difference of 0.21%), Immigrants from Eastern Asia (86.5%, a difference of 0.24%), and Mongolian (87.0%, a difference of 0.27%).
| Demographics | Rating | Rank | 1 or more Vehicles in Household |
| Immigrants | France | 0.1 /100 | #276 | Tragic 87.1% |
| Alsatians | 0.1 /100 | #277 | Tragic 87.1% |
| Immigrants | Southern Europe | 0.1 /100 | #278 | Tragic 87.1% |
| Immigrants | Albania | 0.1 /100 | #279 | Tragic 87.1% |
| Immigrants | Croatia | 0.0 /100 | #280 | Tragic 87.0% |
| Mongolians | 0.0 /100 | #281 | Tragic 87.0% |
| Colville | 0.0 /100 | #282 | Tragic 86.8% |
| Immigrants | Eastern Europe | 0.0 /100 | #283 | Tragic 86.7% |
| Central American Indians | 0.0 /100 | #284 | Tragic 86.7% |
| Immigrants | Kazakhstan | 0.0 /100 | #285 | Tragic 86.6% |
| Immigrants | Eastern Asia | 0.0 /100 | #286 | Tragic 86.5% |
| Immigrants | Malaysia | 0.0 /100 | #287 | Tragic 86.5% |
| Hopi | 0.0 /100 | #288 | Tragic 86.4% |
| Immigrants | Ireland | 0.0 /100 | #289 | Tragic 86.4% |
| Immigrants | Australia | 0.0 /100 | #290 | Tragic 86.4% |
Demographics Similar to Yaqui by 1 or more Vehicles in Household
In terms of 1 or more vehicles in household, the demographic groups most similar to Yaqui are Immigrants from Iraq (92.5%, a difference of 0.020%), British (92.5%, a difference of 0.040%), Nepalese (92.6%, a difference of 0.070%), American (92.5%, a difference of 0.090%), and Sri Lankan (92.5%, a difference of 0.12%).
| Demographics | Rating | Rank | 1 or more Vehicles in Household |
| Europeans | 100.0 /100 | #17 | Exceptional 93.0% |
| Welsh | 100.0 /100 | #18 | Exceptional 93.0% |
| Tongans | 100.0 /100 | #19 | Exceptional 92.9% |
| Arapaho | 100.0 /100 | #20 | Exceptional 92.7% |
| Ottawa | 100.0 /100 | #21 | Exceptional 92.7% |
| French | 100.0 /100 | #22 | Exceptional 92.7% |
| Nepalese | 100.0 /100 | #23 | Exceptional 92.6% |
| Yaqui | 100.0 /100 | #24 | Exceptional 92.6% |
| Immigrants | Iraq | 100.0 /100 | #25 | Exceptional 92.5% |
| British | 100.0 /100 | #26 | Exceptional 92.5% |
| Americans | 100.0 /100 | #27 | Exceptional 92.5% |
| Sri Lankans | 100.0 /100 | #28 | Exceptional 92.5% |
| Native Hawaiians | 100.0 /100 | #29 | Exceptional 92.4% |
| Finns | 100.0 /100 | #30 | Exceptional 92.4% |
| Samoans | 100.0 /100 | #31 | Exceptional 92.4% |