Immigrants from Norway vs Yaqui 1 or more Vehicles in Household
COMPARE
Immigrants from Norway
Yaqui
1 or more Vehicles in Household
1 or more Vehicles in Household Comparison
Immigrants from Norway
Yaqui
88.7%
1 OR MORE VEHICLES IN HOUSEHOLD
5.5/ 100
METRIC RATING
228th/ 347
METRIC RANK
92.6%
1 OR MORE VEHICLES IN HOUSEHOLD
100.0/ 100
METRIC RATING
24th/ 347
METRIC RANK
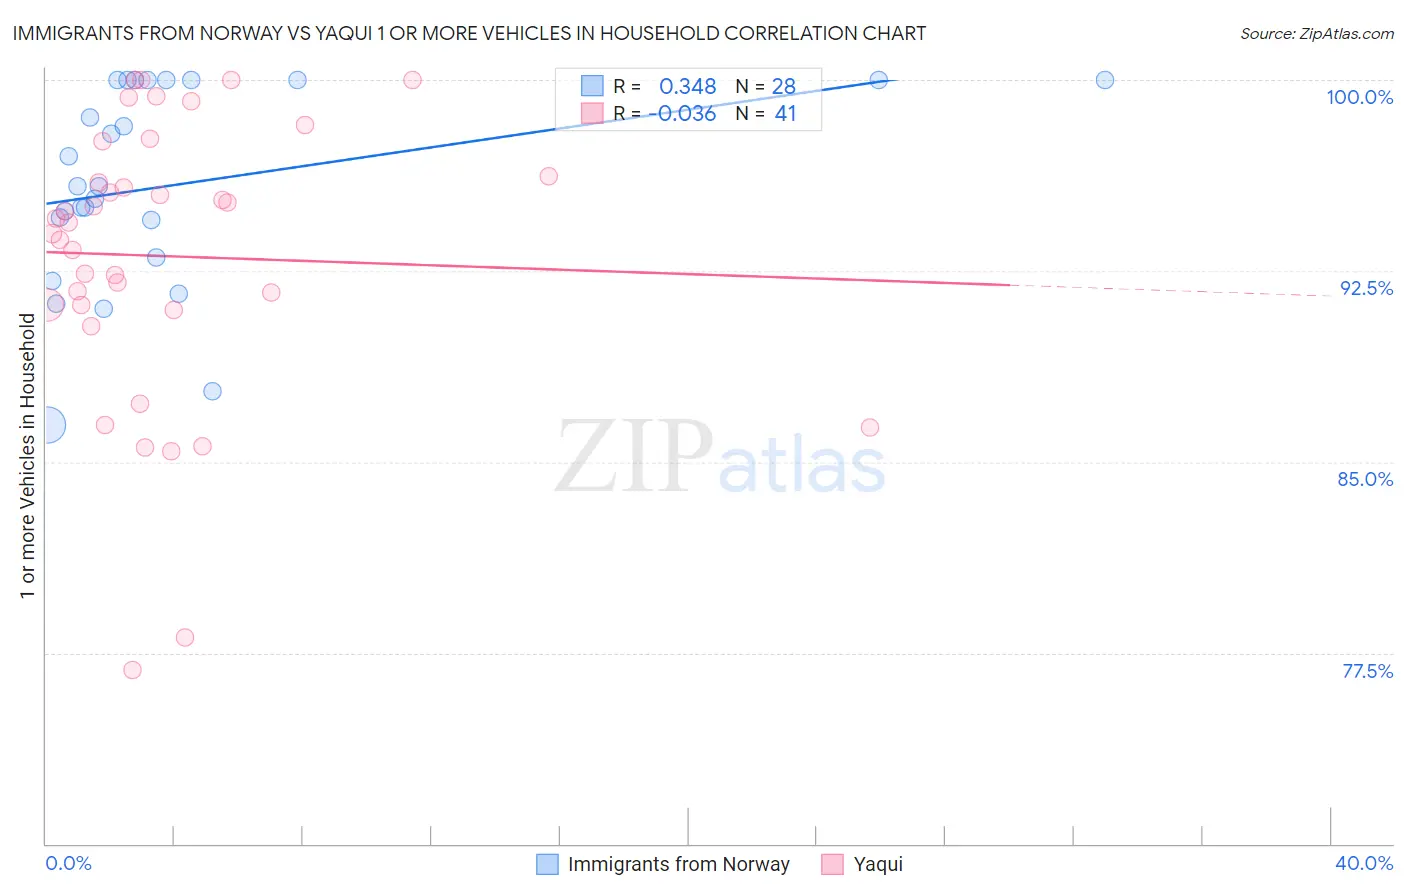
Immigrants from Norway vs Yaqui 1 or more Vehicles in Household Correlation Chart
The statistical analysis conducted on geographies consisting of 116,609,414 people shows a mild positive correlation between the proportion of Immigrants from Norway and percentage of households with 1 or more vehicles available in the United States with a correlation coefficient (R) of 0.348 and weighted average of 88.7%. Similarly, the statistical analysis conducted on geographies consisting of 107,720,236 people shows no correlation between the proportion of Yaqui and percentage of households with 1 or more vehicles available in the United States with a correlation coefficient (R) of -0.036 and weighted average of 92.6%, a difference of 4.3%.
1 or more Vehicles in Household Correlation Summary
| Measurement | Immigrants from Norway | Yaqui |
| Minimum | 86.5% | 76.8% |
| Maximum | 100.0% | 100.0% |
| Range | 13.5% | 23.2% |
| Mean | 95.9% | 93.1% |
| Median | 95.8% | 94.4% |
| Interquartile 25% (IQ1) | 93.7% | 91.1% |
| Interquartile 75% (IQ3) | 100.0% | 96.9% |
| Interquartile Range (IQR) | 6.3% | 5.8% |
| Standard Deviation (Sample) | 3.9% | 5.6% |
| Standard Deviation (Population) | 3.9% | 5.5% |
Similar Demographics by 1 or more Vehicles in Household
Demographics Similar to Immigrants from Norway by 1 or more Vehicles in Household
In terms of 1 or more vehicles in household, the demographic groups most similar to Immigrants from Norway are Cheyenne (88.7%, a difference of 0.010%), Ute (88.7%, a difference of 0.010%), Immigrants from Romania (88.7%, a difference of 0.010%), Immigrants from Sierra Leone (88.7%, a difference of 0.030%), and Cree (88.7%, a difference of 0.040%).
| Demographics | Rating | Rank | 1 or more Vehicles in Household |
| Peruvians | 7.9 /100 | #221 | Tragic 88.8% |
| Uruguayans | 7.0 /100 | #222 | Tragic 88.8% |
| Immigrants | South America | 7.0 /100 | #223 | Tragic 88.8% |
| Immigrants | Hong Kong | 6.2 /100 | #224 | Tragic 88.7% |
| Cree | 6.0 /100 | #225 | Tragic 88.7% |
| Cheyenne | 5.7 /100 | #226 | Tragic 88.7% |
| Ute | 5.6 /100 | #227 | Tragic 88.7% |
| Immigrants | Norway | 5.5 /100 | #228 | Tragic 88.7% |
| Immigrants | Romania | 5.4 /100 | #229 | Tragic 88.7% |
| Immigrants | Sierra Leone | 5.2 /100 | #230 | Tragic 88.7% |
| Russians | 5.0 /100 | #231 | Tragic 88.7% |
| Immigrants | Japan | 4.9 /100 | #232 | Tragic 88.7% |
| Houma | 4.8 /100 | #233 | Tragic 88.6% |
| Immigrants | Peru | 4.7 /100 | #234 | Tragic 88.6% |
| Paiute | 4.6 /100 | #235 | Tragic 88.6% |
Demographics Similar to Yaqui by 1 or more Vehicles in Household
In terms of 1 or more vehicles in household, the demographic groups most similar to Yaqui are Immigrants from Iraq (92.5%, a difference of 0.020%), British (92.5%, a difference of 0.040%), Nepalese (92.6%, a difference of 0.070%), American (92.5%, a difference of 0.090%), and Sri Lankan (92.5%, a difference of 0.12%).
| Demographics | Rating | Rank | 1 or more Vehicles in Household |
| Europeans | 100.0 /100 | #17 | Exceptional 93.0% |
| Welsh | 100.0 /100 | #18 | Exceptional 93.0% |
| Tongans | 100.0 /100 | #19 | Exceptional 92.9% |
| Arapaho | 100.0 /100 | #20 | Exceptional 92.7% |
| Ottawa | 100.0 /100 | #21 | Exceptional 92.7% |
| French | 100.0 /100 | #22 | Exceptional 92.7% |
| Nepalese | 100.0 /100 | #23 | Exceptional 92.6% |
| Yaqui | 100.0 /100 | #24 | Exceptional 92.6% |
| Immigrants | Iraq | 100.0 /100 | #25 | Exceptional 92.5% |
| British | 100.0 /100 | #26 | Exceptional 92.5% |
| Americans | 100.0 /100 | #27 | Exceptional 92.5% |
| Sri Lankans | 100.0 /100 | #28 | Exceptional 92.5% |
| Native Hawaiians | 100.0 /100 | #29 | Exceptional 92.4% |
| Finns | 100.0 /100 | #30 | Exceptional 92.4% |
| Samoans | 100.0 /100 | #31 | Exceptional 92.4% |