Yuman vs Immigrants from Somalia 11th Grade
COMPARE
Yuman
Immigrants from Somalia
11th Grade
11th Grade Comparison
Yuman
Immigrants from Somalia
89.7%
11TH GRADE
0.0/ 100
METRIC RATING
304th/ 347
METRIC RANK
91.9%
11TH GRADE
5.2/ 100
METRIC RATING
226th/ 347
METRIC RANK
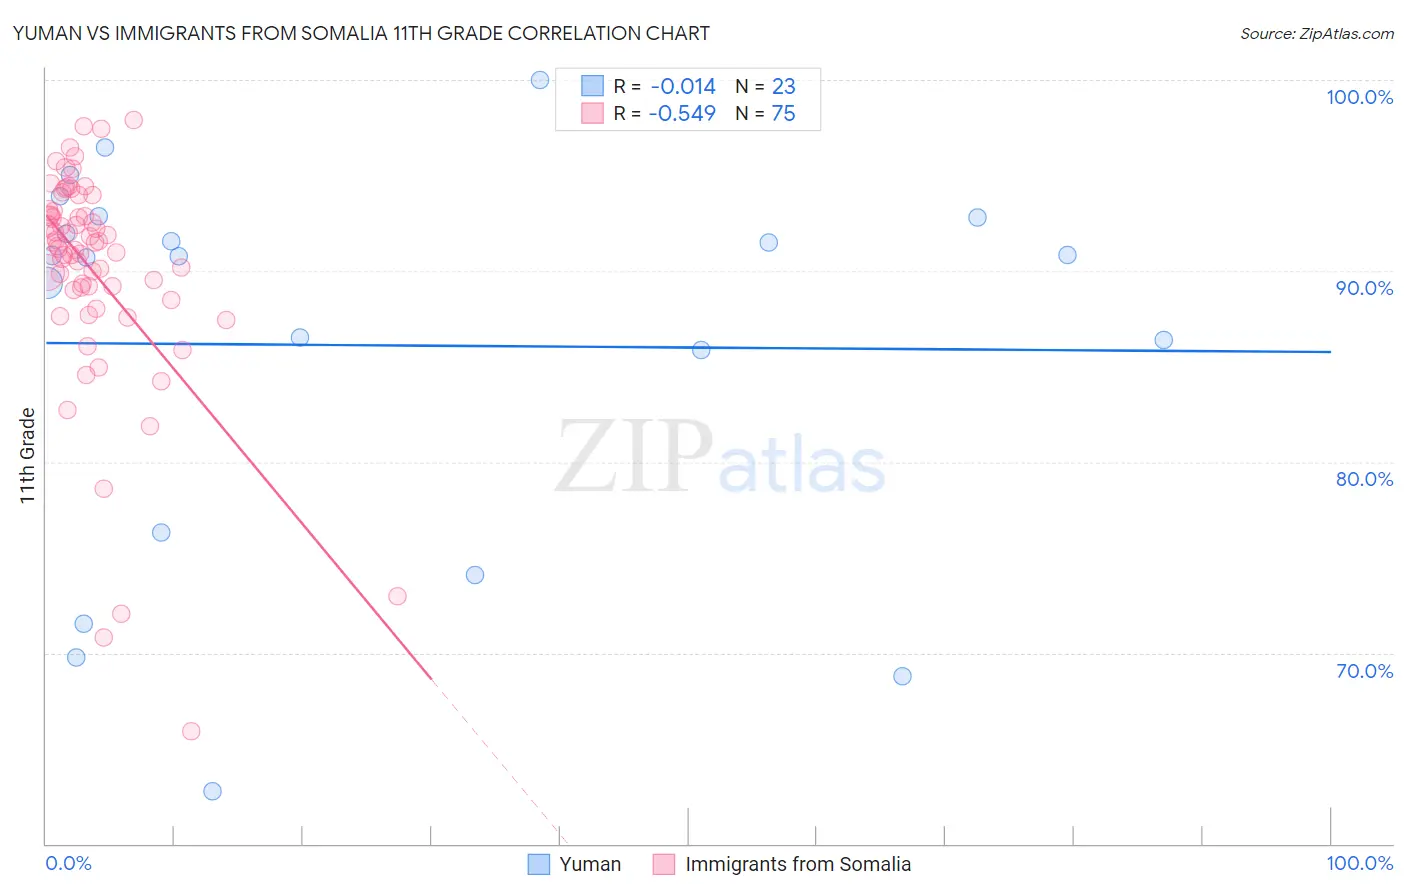
Yuman vs Immigrants from Somalia 11th Grade Correlation Chart
The statistical analysis conducted on geographies consisting of 40,696,349 people shows no correlation between the proportion of Yuman and percentage of population with at least 11th grade education in the United States with a correlation coefficient (R) of -0.014 and weighted average of 89.7%. Similarly, the statistical analysis conducted on geographies consisting of 92,101,093 people shows a substantial negative correlation between the proportion of Immigrants from Somalia and percentage of population with at least 11th grade education in the United States with a correlation coefficient (R) of -0.549 and weighted average of 91.9%, a difference of 2.4%.
11th Grade Correlation Summary
| Measurement | Yuman | Immigrants from Somalia |
| Minimum | 62.7% | 65.9% |
| Maximum | 100.0% | 97.9% |
| Range | 37.3% | 32.0% |
| Mean | 86.1% | 90.0% |
| Median | 90.8% | 91.3% |
| Interquartile 25% (IQ1) | 76.3% | 89.0% |
| Interquartile 75% (IQ3) | 92.8% | 93.1% |
| Interquartile Range (IQR) | 16.5% | 4.1% |
| Standard Deviation (Sample) | 10.2% | 5.9% |
| Standard Deviation (Population) | 10.0% | 5.9% |
Similar Demographics by 11th Grade
Demographics Similar to Yuman by 11th Grade
In terms of 11th grade, the demographic groups most similar to Yuman are Immigrants (89.7%, a difference of 0.0%), Immigrants from Guyana (89.7%, a difference of 0.010%), Immigrants from Cambodia (89.6%, a difference of 0.080%), Ecuadorian (89.6%, a difference of 0.13%), and Immigrants from Dominica (89.5%, a difference of 0.18%).
| Demographics | Rating | Rank | 11th Grade |
| Navajo | 0.0 /100 | #297 | Tragic 90.0% |
| Immigrants | Fiji | 0.0 /100 | #298 | Tragic 89.9% |
| Japanese | 0.0 /100 | #299 | Tragic 89.9% |
| Immigrants | Haiti | 0.0 /100 | #300 | Tragic 89.9% |
| Guyanese | 0.0 /100 | #301 | Tragic 89.9% |
| Immigrants | Guyana | 0.0 /100 | #302 | Tragic 89.7% |
| Immigrants | Immigrants | 0.0 /100 | #303 | Tragic 89.7% |
| Yuman | 0.0 /100 | #304 | Tragic 89.7% |
| Immigrants | Cambodia | 0.0 /100 | #305 | Tragic 89.6% |
| Ecuadorians | 0.0 /100 | #306 | Tragic 89.6% |
| Immigrants | Dominica | 0.0 /100 | #307 | Tragic 89.5% |
| Nepalese | 0.0 /100 | #308 | Tragic 89.5% |
| Immigrants | Bangladesh | 0.0 /100 | #309 | Tragic 89.5% |
| Yaqui | 0.0 /100 | #310 | Tragic 89.5% |
| Vietnamese | 0.0 /100 | #311 | Tragic 89.4% |
Demographics Similar to Immigrants from Somalia by 11th Grade
In terms of 11th grade, the demographic groups most similar to Immigrants from Somalia are Immigrants from Zaire (91.9%, a difference of 0.010%), Costa Rican (91.9%, a difference of 0.050%), Immigrants from Cameroon (91.8%, a difference of 0.050%), Immigrants from Panama (91.8%, a difference of 0.050%), and Nigerian (91.8%, a difference of 0.050%).
| Demographics | Rating | Rank | 11th Grade |
| Portuguese | 10.0 /100 | #219 | Tragic 92.0% |
| South American Indians | 7.6 /100 | #220 | Tragic 92.0% |
| Immigrants | Liberia | 7.0 /100 | #221 | Tragic 91.9% |
| Immigrants | Africa | 6.5 /100 | #222 | Tragic 91.9% |
| Immigrants | Bahamas | 6.5 /100 | #223 | Tragic 91.9% |
| Costa Ricans | 6.3 /100 | #224 | Tragic 91.9% |
| Immigrants | Zaire | 5.4 /100 | #225 | Tragic 91.9% |
| Immigrants | Somalia | 5.2 /100 | #226 | Tragic 91.9% |
| Immigrants | Cameroon | 4.4 /100 | #227 | Tragic 91.8% |
| Immigrants | Panama | 4.3 /100 | #228 | Tragic 91.8% |
| Nigerians | 4.3 /100 | #229 | Tragic 91.8% |
| Immigrants | Afghanistan | 3.9 /100 | #230 | Tragic 91.8% |
| Choctaw | 3.7 /100 | #231 | Tragic 91.8% |
| Uruguayans | 3.5 /100 | #232 | Tragic 91.8% |
| Cheyenne | 3.3 /100 | #233 | Tragic 91.8% |