Yakama vs Immigrants from Sierra Leone Unemployment Among Ages 25 to 29 years
COMPARE
Yakama
Immigrants from Sierra Leone
Unemployment Among Ages 25 to 29 years
Unemployment Among Ages 25 to 29 years Comparison
Yakama
Immigrants from Sierra Leone
8.8%
UNEMPLOYMENT AMONG AGES 25 TO 29 YEARS
0.0/ 100
METRIC RATING
325th/ 347
METRIC RANK
7.1%
UNEMPLOYMENT AMONG AGES 25 TO 29 YEARS
1.3/ 100
METRIC RATING
241st/ 347
METRIC RANK
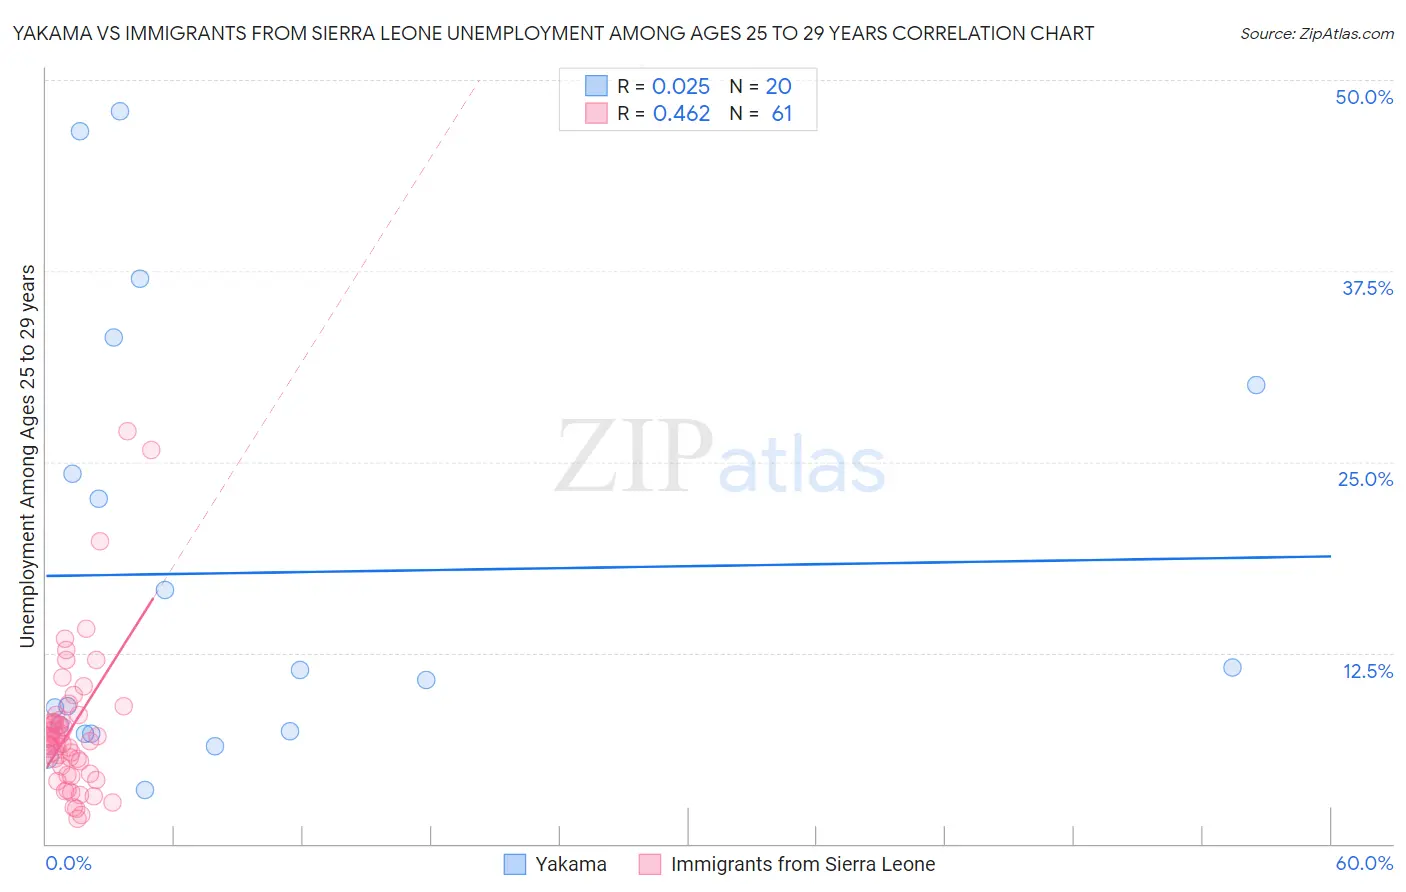
Yakama vs Immigrants from Sierra Leone Unemployment Among Ages 25 to 29 years Correlation Chart
The statistical analysis conducted on geographies consisting of 19,619,825 people shows no correlation between the proportion of Yakama and unemployment rate among population between the ages 25 and 29 in the United States with a correlation coefficient (R) of 0.025 and weighted average of 8.8%. Similarly, the statistical analysis conducted on geographies consisting of 100,822,956 people shows a moderate positive correlation between the proportion of Immigrants from Sierra Leone and unemployment rate among population between the ages 25 and 29 in the United States with a correlation coefficient (R) of 0.462 and weighted average of 7.1%, a difference of 23.5%.
Unemployment Among Ages 25 to 29 years Correlation Summary
| Measurement | Yakama | Immigrants from Sierra Leone |
| Minimum | 3.5% | 1.6% |
| Maximum | 47.9% | 27.0% |
| Range | 44.4% | 25.4% |
| Mean | 17.7% | 7.6% |
| Median | 11.1% | 6.7% |
| Interquartile 25% (IQ1) | 7.3% | 4.8% |
| Interquartile 75% (IQ3) | 27.1% | 8.3% |
| Interquartile Range (IQR) | 19.8% | 3.4% |
| Standard Deviation (Sample) | 14.1% | 4.8% |
| Standard Deviation (Population) | 13.7% | 4.7% |
Similar Demographics by Unemployment Among Ages 25 to 29 years
Demographics Similar to Yakama by Unemployment Among Ages 25 to 29 years
In terms of unemployment among ages 25 to 29 years, the demographic groups most similar to Yakama are Houma (8.7%, a difference of 0.51%), Dominican (8.7%, a difference of 0.87%), Tlingit-Haida (8.7%, a difference of 0.96%), Immigrants from Dominican Republic (8.6%, a difference of 1.8%), and Black/African American (8.6%, a difference of 2.4%).
| Demographics | Rating | Rank | Unemployment Among Ages 25 to 29 years |
| Guyanese | 0.0 /100 | #318 | Tragic 8.5% |
| Immigrants | Armenia | 0.0 /100 | #319 | Tragic 8.5% |
| Blacks/African Americans | 0.0 /100 | #320 | Tragic 8.6% |
| Immigrants | Dominican Republic | 0.0 /100 | #321 | Tragic 8.6% |
| Tlingit-Haida | 0.0 /100 | #322 | Tragic 8.7% |
| Dominicans | 0.0 /100 | #323 | Tragic 8.7% |
| Houma | 0.0 /100 | #324 | Tragic 8.7% |
| Yakama | 0.0 /100 | #325 | Tragic 8.8% |
| Shoshone | 0.0 /100 | #326 | Tragic 9.2% |
| Colville | 0.0 /100 | #327 | Tragic 9.2% |
| Apache | 0.0 /100 | #328 | Tragic 9.5% |
| Aleuts | 0.0 /100 | #329 | Tragic 9.7% |
| Natives/Alaskans | 0.0 /100 | #330 | Tragic 9.8% |
| Alaska Natives | 0.0 /100 | #331 | Tragic 10.2% |
| Pueblo | 0.0 /100 | #332 | Tragic 10.4% |
Demographics Similar to Immigrants from Sierra Leone by Unemployment Among Ages 25 to 29 years
In terms of unemployment among ages 25 to 29 years, the demographic groups most similar to Immigrants from Sierra Leone are Native Hawaiian (7.1%, a difference of 0.040%), Potawatomi (7.1%, a difference of 0.070%), Spanish American Indian (7.1%, a difference of 0.26%), Yaqui (7.1%, a difference of 0.39%), and Nonimmigrants (7.1%, a difference of 0.43%).
| Demographics | Rating | Rank | Unemployment Among Ages 25 to 29 years |
| French Canadians | 2.4 /100 | #234 | Tragic 7.0% |
| Panamanians | 2.1 /100 | #235 | Tragic 7.0% |
| Cape Verdeans | 1.9 /100 | #236 | Tragic 7.0% |
| Puget Sound Salish | 1.8 /100 | #237 | Tragic 7.1% |
| Hondurans | 1.8 /100 | #238 | Tragic 7.1% |
| Potawatomi | 1.3 /100 | #239 | Tragic 7.1% |
| Native Hawaiians | 1.3 /100 | #240 | Tragic 7.1% |
| Immigrants | Sierra Leone | 1.3 /100 | #241 | Tragic 7.1% |
| Spanish American Indians | 1.1 /100 | #242 | Tragic 7.1% |
| Yaqui | 1.0 /100 | #243 | Tragic 7.1% |
| Immigrants | Nonimmigrants | 0.9 /100 | #244 | Tragic 7.1% |
| Guatemalans | 0.9 /100 | #245 | Tragic 7.1% |
| Immigrants | Uzbekistan | 0.7 /100 | #246 | Tragic 7.2% |
| Immigrants | Guatemala | 0.7 /100 | #247 | Tragic 7.2% |
| Sub-Saharan Africans | 0.6 /100 | #248 | Tragic 7.2% |