Immigrants from Norway vs Cherokee 2 or more Vehicles in Household
COMPARE
Immigrants from Norway
Cherokee
2 or more Vehicles in Household
2 or more Vehicles in Household Comparison
Immigrants from Norway
Cherokee
54.4%
2 OR MORE VEHICLES IN HOUSEHOLD
15.9/ 100
METRIC RATING
199th/ 347
METRIC RANK
59.9%
2 OR MORE VEHICLES IN HOUSEHOLD
100.0/ 100
METRIC RATING
40th/ 347
METRIC RANK
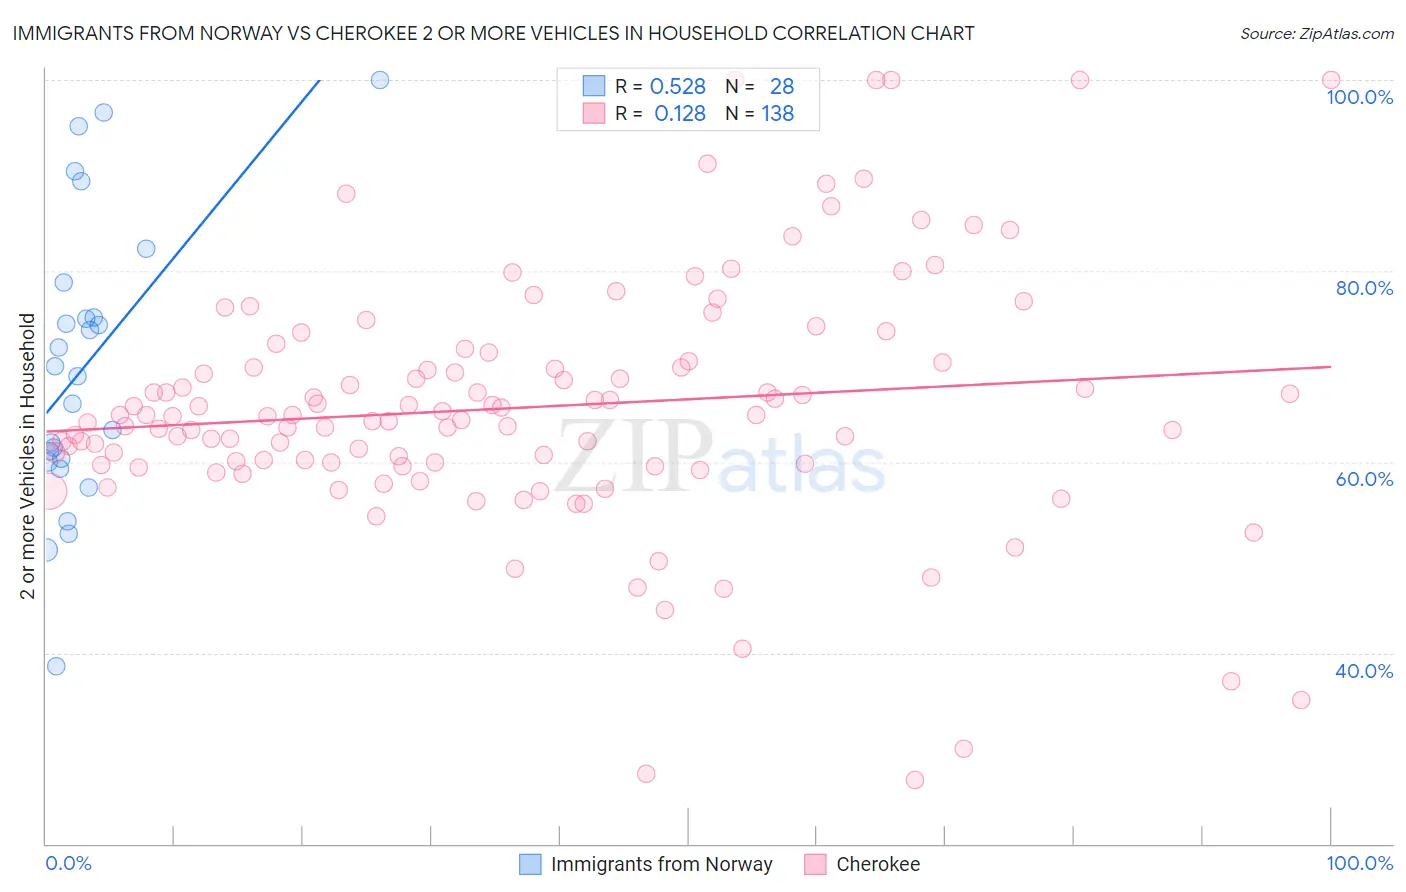
Immigrants from Norway vs Cherokee 2 or more Vehicles in Household Correlation Chart
The statistical analysis conducted on geographies consisting of 116,688,411 people shows a substantial positive correlation between the proportion of Immigrants from Norway and percentage of households with 2 or more vehicles available in the United States with a correlation coefficient (R) of 0.528 and weighted average of 54.4%. Similarly, the statistical analysis conducted on geographies consisting of 493,419,390 people shows a poor positive correlation between the proportion of Cherokee and percentage of households with 2 or more vehicles available in the United States with a correlation coefficient (R) of 0.128 and weighted average of 59.9%, a difference of 10.0%.
2 or more Vehicles in Household Correlation Summary
| Measurement | Immigrants from Norway | Cherokee |
| Minimum | 38.6% | 26.7% |
| Maximum | 100.0% | 100.0% |
| Range | 61.4% | 73.3% |
| Mean | 70.1% | 65.7% |
| Median | 69.5% | 64.8% |
| Interquartile 25% (IQ1) | 60.2% | 59.8% |
| Interquartile 75% (IQ3) | 76.9% | 70.3% |
| Interquartile Range (IQR) | 16.7% | 10.6% |
| Standard Deviation (Sample) | 15.0% | 13.1% |
| Standard Deviation (Population) | 14.7% | 13.0% |
Similar Demographics by 2 or more Vehicles in Household
Demographics Similar to Immigrants from Norway by 2 or more Vehicles in Household
In terms of 2 or more vehicles in household, the demographic groups most similar to Immigrants from Norway are Houma (54.4%, a difference of 0.0%), Carpatho Rusyn (54.4%, a difference of 0.030%), Immigrants from Italy (54.4%, a difference of 0.030%), Immigrants from North Macedonia (54.4%, a difference of 0.080%), and Argentinean (54.5%, a difference of 0.12%).
| Demographics | Rating | Rank | 2 or more Vehicles in Household |
| Immigrants | Romania | 23.8 /100 | #192 | Fair 54.7% |
| Immigrants | Japan | 23.4 /100 | #193 | Fair 54.7% |
| Central Americans | 23.0 /100 | #194 | Fair 54.7% |
| Iroquois | 22.6 /100 | #195 | Fair 54.7% |
| Immigrants | Poland | 19.3 /100 | #196 | Poor 54.6% |
| Argentineans | 17.5 /100 | #197 | Poor 54.5% |
| Carpatho Rusyns | 16.2 /100 | #198 | Poor 54.4% |
| Immigrants | Norway | 15.9 /100 | #199 | Poor 54.4% |
| Houma | 15.8 /100 | #200 | Poor 54.4% |
| Immigrants | Italy | 15.5 /100 | #201 | Poor 54.4% |
| Immigrants | North Macedonia | 14.9 /100 | #202 | Poor 54.4% |
| Immigrants | Peru | 14.3 /100 | #203 | Poor 54.4% |
| Immigrants | Belgium | 13.7 /100 | #204 | Poor 54.3% |
| Cheyenne | 13.6 /100 | #205 | Poor 54.3% |
| Immigrants | Latin America | 13.1 /100 | #206 | Poor 54.3% |
Demographics Similar to Cherokee by 2 or more Vehicles in Household
In terms of 2 or more vehicles in household, the demographic groups most similar to Cherokee are Northern European (59.9%, a difference of 0.020%), Malaysian (59.8%, a difference of 0.030%), Czechoslovakian (59.8%, a difference of 0.11%), French (59.8%, a difference of 0.17%), and Immigrants from Taiwan (59.7%, a difference of 0.21%).
| Demographics | Rating | Rank | 2 or more Vehicles in Household |
| Immigrants | Mexico | 100.0 /100 | #33 | Exceptional 60.2% |
| Spanish | 100.0 /100 | #34 | Exceptional 60.2% |
| Immigrants | Philippines | 100.0 /100 | #35 | Exceptional 60.1% |
| Chinese | 100.0 /100 | #36 | Exceptional 60.1% |
| Irish | 100.0 /100 | #37 | Exceptional 60.1% |
| Americans | 100.0 /100 | #38 | Exceptional 60.0% |
| British | 100.0 /100 | #39 | Exceptional 60.0% |
| Cherokee | 100.0 /100 | #40 | Exceptional 59.9% |
| Northern Europeans | 100.0 /100 | #41 | Exceptional 59.9% |
| Malaysians | 100.0 /100 | #42 | Exceptional 59.8% |
| Czechoslovakians | 100.0 /100 | #43 | Exceptional 59.8% |
| French | 100.0 /100 | #44 | Exceptional 59.8% |
| Immigrants | Taiwan | 100.0 /100 | #45 | Exceptional 59.7% |
| Immigrants | South Eastern Asia | 100.0 /100 | #46 | Exceptional 59.6% |
| Yaqui | 99.9 /100 | #47 | Exceptional 59.3% |