Lumbee vs White/Caucasian 1 or more Vehicles in Household
COMPARE
Lumbee
White/Caucasian
1 or more Vehicles in Household
1 or more Vehicles in Household Comparison
Lumbee
Whites/Caucasians
89.7%
1 OR MORE VEHICLES IN HOUSEHOLD
52.8/ 100
METRIC RATING
173rd/ 347
METRIC RANK
93.1%
1 OR MORE VEHICLES IN HOUSEHOLD
100.0/ 100
METRIC RATING
13th/ 347
METRIC RANK
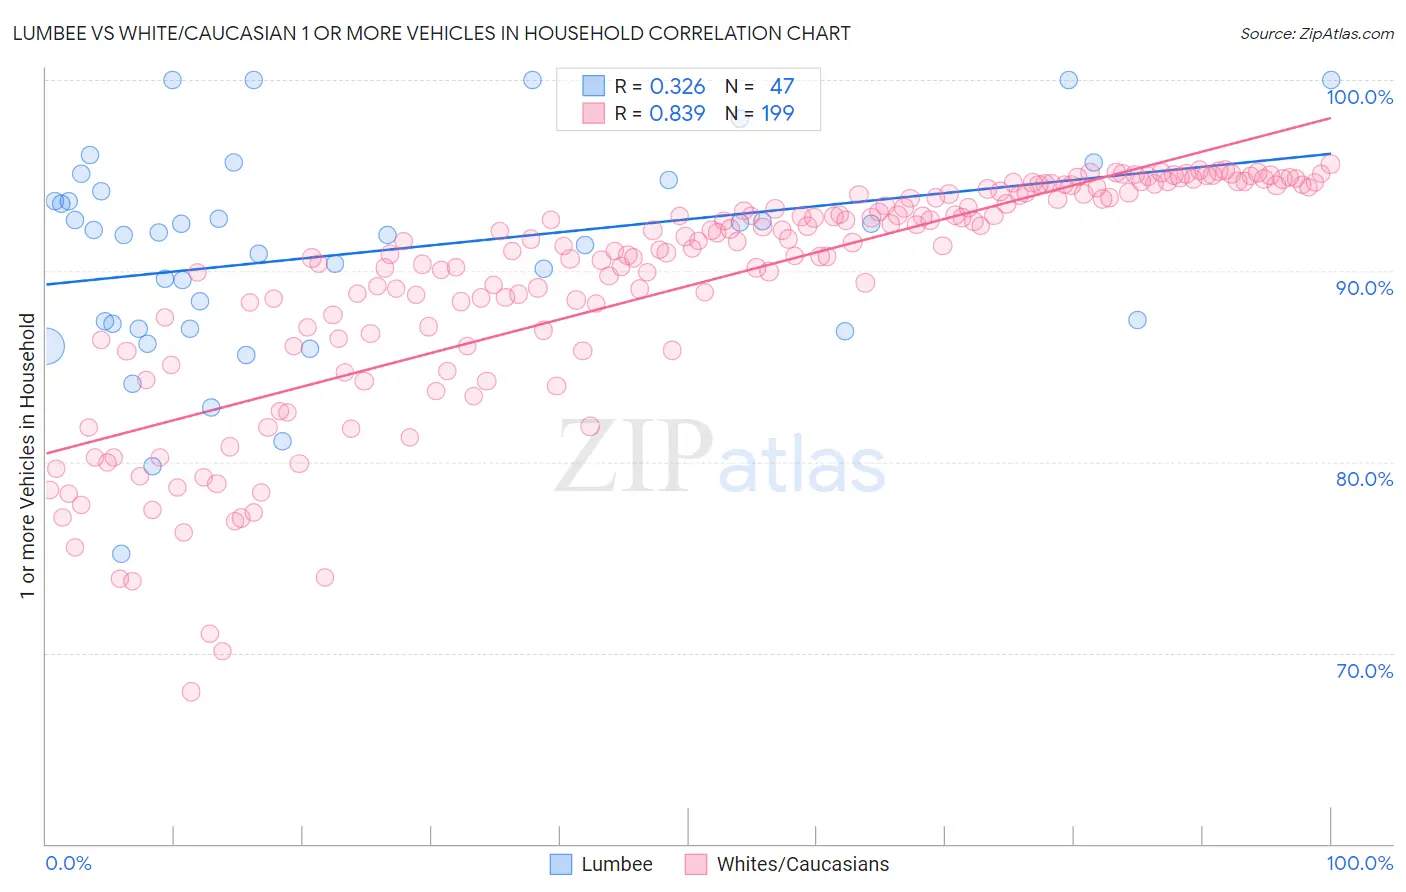
Lumbee vs White/Caucasian 1 or more Vehicles in Household Correlation Chart
The statistical analysis conducted on geographies consisting of 92,265,071 people shows a mild positive correlation between the proportion of Lumbee and percentage of households with 1 or more vehicles available in the United States with a correlation coefficient (R) of 0.326 and weighted average of 89.7%. Similarly, the statistical analysis conducted on geographies consisting of 571,958,607 people shows a very strong positive correlation between the proportion of Whites/Caucasians and percentage of households with 1 or more vehicles available in the United States with a correlation coefficient (R) of 0.839 and weighted average of 93.1%, a difference of 3.7%.
1 or more Vehicles in Household Correlation Summary
| Measurement | Lumbee | White/Caucasian |
| Minimum | 75.2% | 68.0% |
| Maximum | 100.0% | 95.6% |
| Range | 24.8% | 27.6% |
| Mean | 90.9% | 89.2% |
| Median | 91.9% | 91.3% |
| Interquartile 25% (IQ1) | 87.0% | 86.4% |
| Interquartile 75% (IQ3) | 94.2% | 94.0% |
| Interquartile Range (IQR) | 7.2% | 7.6% |
| Standard Deviation (Sample) | 5.5% | 6.1% |
| Standard Deviation (Population) | 5.5% | 6.1% |
Similar Demographics by 1 or more Vehicles in Household
Demographics Similar to Lumbee by 1 or more Vehicles in Household
In terms of 1 or more vehicles in household, the demographic groups most similar to Lumbee are Indonesian (89.7%, a difference of 0.0%), French American Indian (89.8%, a difference of 0.020%), Filipino (89.7%, a difference of 0.040%), Immigrants from Costa Rica (89.8%, a difference of 0.070%), and Immigrants from Burma/Myanmar (89.7%, a difference of 0.080%).
| Demographics | Rating | Rank | 1 or more Vehicles in Household |
| Immigrants | Middle Africa | 62.2 /100 | #166 | Good 89.9% |
| Immigrants | Latin America | 60.3 /100 | #167 | Good 89.8% |
| Immigrants | Cambodia | 60.1 /100 | #168 | Good 89.8% |
| Natives/Alaskans | 59.5 /100 | #169 | Average 89.8% |
| Immigrants | Costa Rica | 57.6 /100 | #170 | Average 89.8% |
| French American Indians | 54.4 /100 | #171 | Average 89.8% |
| Indonesians | 53.0 /100 | #172 | Average 89.7% |
| Lumbee | 52.8 /100 | #173 | Average 89.7% |
| Filipinos | 50.0 /100 | #174 | Average 89.7% |
| Immigrants | Burma/Myanmar | 47.6 /100 | #175 | Average 89.7% |
| Immigrants | Sudan | 47.1 /100 | #176 | Average 89.7% |
| Hmong | 45.8 /100 | #177 | Average 89.6% |
| Immigrants | El Salvador | 44.1 /100 | #178 | Average 89.6% |
| German Russians | 44.0 /100 | #179 | Average 89.6% |
| Arabs | 43.3 /100 | #180 | Average 89.6% |
Demographics Similar to Whites/Caucasians by 1 or more Vehicles in Household
In terms of 1 or more vehicles in household, the demographic groups most similar to Whites/Caucasians are Scandinavian (93.1%, a difference of 0.020%), Irish (93.1%, a difference of 0.040%), Mexican (93.0%, a difference of 0.060%), Assyrian/Chaldean/Syriac (93.0%, a difference of 0.060%), and European (93.0%, a difference of 0.090%).
| Demographics | Rating | Rank | 1 or more Vehicles in Household |
| Danes | 100.0 /100 | #6 | Exceptional 93.5% |
| Scottish | 100.0 /100 | #7 | Exceptional 93.4% |
| Swedes | 100.0 /100 | #8 | Exceptional 93.3% |
| Scotch-Irish | 100.0 /100 | #9 | Exceptional 93.3% |
| Dutch | 100.0 /100 | #10 | Exceptional 93.3% |
| Czechs | 100.0 /100 | #11 | Exceptional 93.3% |
| Scandinavians | 100.0 /100 | #12 | Exceptional 93.1% |
| Whites/Caucasians | 100.0 /100 | #13 | Exceptional 93.1% |
| Irish | 100.0 /100 | #14 | Exceptional 93.1% |
| Mexicans | 100.0 /100 | #15 | Exceptional 93.0% |
| Assyrians/Chaldeans/Syriacs | 100.0 /100 | #16 | Exceptional 93.0% |
| Europeans | 100.0 /100 | #17 | Exceptional 93.0% |
| Welsh | 100.0 /100 | #18 | Exceptional 93.0% |
| Tongans | 100.0 /100 | #19 | Exceptional 92.9% |
| Arapaho | 100.0 /100 | #20 | Exceptional 92.7% |