West Indian vs White/Caucasian Female Poverty Among 18-24 Year Olds
COMPARE
West Indian
White/Caucasian
Female Poverty Among 18-24 Year Olds
Female Poverty Among 18-24 Year Olds Comparison
West Indians
Whites/Caucasians
21.1%
FEMALE POVERTY AMONG 18-24 YEAR OLDS
1.9/ 100
METRIC RATING
251st/ 347
METRIC RANK
20.8%
FEMALE POVERTY AMONG 18-24 YEAR OLDS
6.1/ 100
METRIC RATING
230th/ 347
METRIC RANK
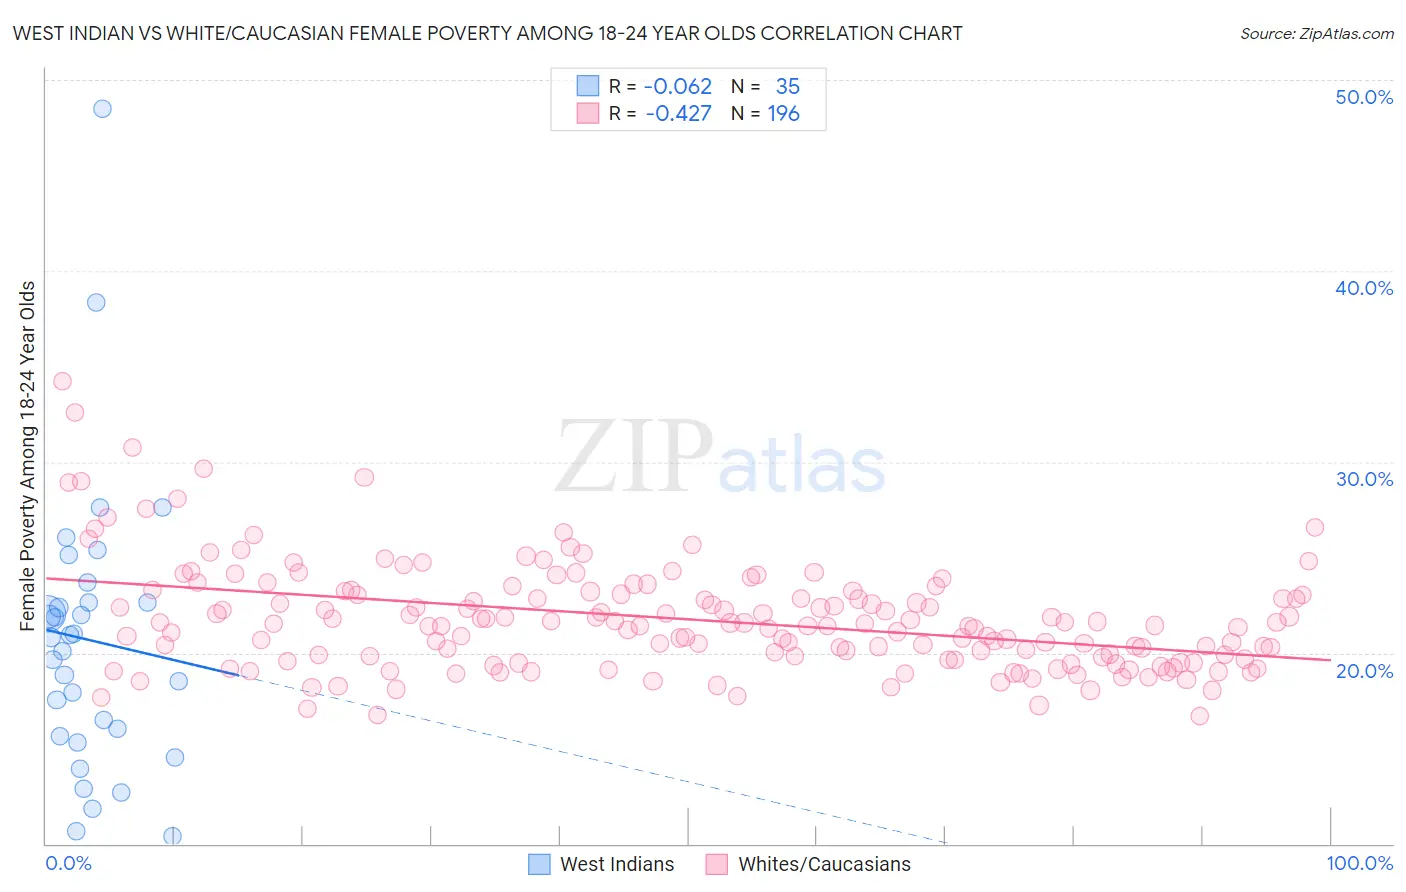
West Indian vs White/Caucasian Female Poverty Among 18-24 Year Olds Correlation Chart
The statistical analysis conducted on geographies consisting of 250,472,705 people shows a slight negative correlation between the proportion of West Indians and poverty level among females between the ages 18 and 24 in the United States with a correlation coefficient (R) of -0.062 and weighted average of 21.1%. Similarly, the statistical analysis conducted on geographies consisting of 545,122,954 people shows a moderate negative correlation between the proportion of Whites/Caucasians and poverty level among females between the ages 18 and 24 in the United States with a correlation coefficient (R) of -0.427 and weighted average of 20.8%, a difference of 1.5%.
Female Poverty Among 18-24 Year Olds Correlation Summary
| Measurement | West Indian | White/Caucasian |
| Minimum | 10.4% | 16.7% |
| Maximum | 48.5% | 34.2% |
| Range | 38.1% | 17.5% |
| Mean | 20.7% | 21.7% |
| Median | 20.8% | 21.4% |
| Interquartile 25% (IQ1) | 15.6% | 19.7% |
| Interquartile 75% (IQ3) | 22.6% | 23.1% |
| Interquartile Range (IQR) | 7.0% | 3.5% |
| Standard Deviation (Sample) | 7.5% | 2.9% |
| Standard Deviation (Population) | 7.4% | 2.8% |
Similar Demographics by Female Poverty Among 18-24 Year Olds
Demographics Similar to West Indians by Female Poverty Among 18-24 Year Olds
In terms of female poverty among 18-24 year olds, the demographic groups most similar to West Indians are South African (21.1%, a difference of 0.18%), Immigrants from West Indies (21.0%, a difference of 0.20%), Delaware (21.1%, a difference of 0.23%), Carpatho Rusyn (21.0%, a difference of 0.33%), and Immigrants from Kenya (21.0%, a difference of 0.35%).
| Demographics | Rating | Rank | Female Poverty Among 18-24 Year Olds |
| Immigrants | Thailand | 3.4 /100 | #244 | Tragic 20.9% |
| Aleuts | 3.3 /100 | #245 | Tragic 20.9% |
| Immigrants | Australia | 3.1 /100 | #246 | Tragic 20.9% |
| Immigrants | Africa | 3.0 /100 | #247 | Tragic 21.0% |
| Immigrants | Kenya | 2.5 /100 | #248 | Tragic 21.0% |
| Carpatho Rusyns | 2.5 /100 | #249 | Tragic 21.0% |
| Immigrants | West Indies | 2.2 /100 | #250 | Tragic 21.0% |
| West Indians | 1.9 /100 | #251 | Tragic 21.1% |
| South Africans | 1.6 /100 | #252 | Tragic 21.1% |
| Delaware | 1.6 /100 | #253 | Tragic 21.1% |
| British West Indians | 1.2 /100 | #254 | Tragic 21.2% |
| Immigrants | Grenada | 1.2 /100 | #255 | Tragic 21.2% |
| Tsimshian | 1.0 /100 | #256 | Tragic 21.2% |
| Taiwanese | 1.0 /100 | #257 | Tragic 21.2% |
| Vietnamese | 0.6 /100 | #258 | Tragic 21.4% |
Demographics Similar to Whites/Caucasians by Female Poverty Among 18-24 Year Olds
In terms of female poverty among 18-24 year olds, the demographic groups most similar to Whites/Caucasians are Australian (20.8%, a difference of 0.0%), Immigrants from St. Vincent and the Grenadines (20.8%, a difference of 0.020%), Finnish (20.8%, a difference of 0.030%), Immigrants from Denmark (20.8%, a difference of 0.060%), and Ghanaian (20.8%, a difference of 0.070%).
| Demographics | Rating | Rank | Female Poverty Among 18-24 Year Olds |
| French | 7.9 /100 | #223 | Tragic 20.7% |
| Immigrants | Liberia | 7.6 /100 | #224 | Tragic 20.7% |
| Norwegians | 7.3 /100 | #225 | Tragic 20.7% |
| Estonians | 7.2 /100 | #226 | Tragic 20.7% |
| Immigrants | Sweden | 6.8 /100 | #227 | Tragic 20.7% |
| Ghanaians | 6.5 /100 | #228 | Tragic 20.8% |
| Australians | 6.1 /100 | #229 | Tragic 20.8% |
| Whites/Caucasians | 6.1 /100 | #230 | Tragic 20.8% |
| Immigrants | St. Vincent and the Grenadines | 6.0 /100 | #231 | Tragic 20.8% |
| Finns | 6.0 /100 | #232 | Tragic 20.8% |
| Immigrants | Denmark | 5.8 /100 | #233 | Tragic 20.8% |
| Welsh | 5.4 /100 | #234 | Tragic 20.8% |
| Immigrants | Uganda | 5.1 /100 | #235 | Tragic 20.8% |
| Okinawans | 4.9 /100 | #236 | Tragic 20.8% |
| Scottish | 4.5 /100 | #237 | Tragic 20.9% |