Ute vs Immigrants from Colombia 1 or more Vehicles in Household
COMPARE
Ute
Immigrants from Colombia
1 or more Vehicles in Household
1 or more Vehicles in Household Comparison
Ute
Immigrants from Colombia
88.7%
1 OR MORE VEHICLES IN HOUSEHOLD
5.6/ 100
METRIC RATING
227th/ 347
METRIC RANK
87.6%
1 OR MORE VEHICLES IN HOUSEHOLD
0.3/ 100
METRIC RATING
267th/ 347
METRIC RANK
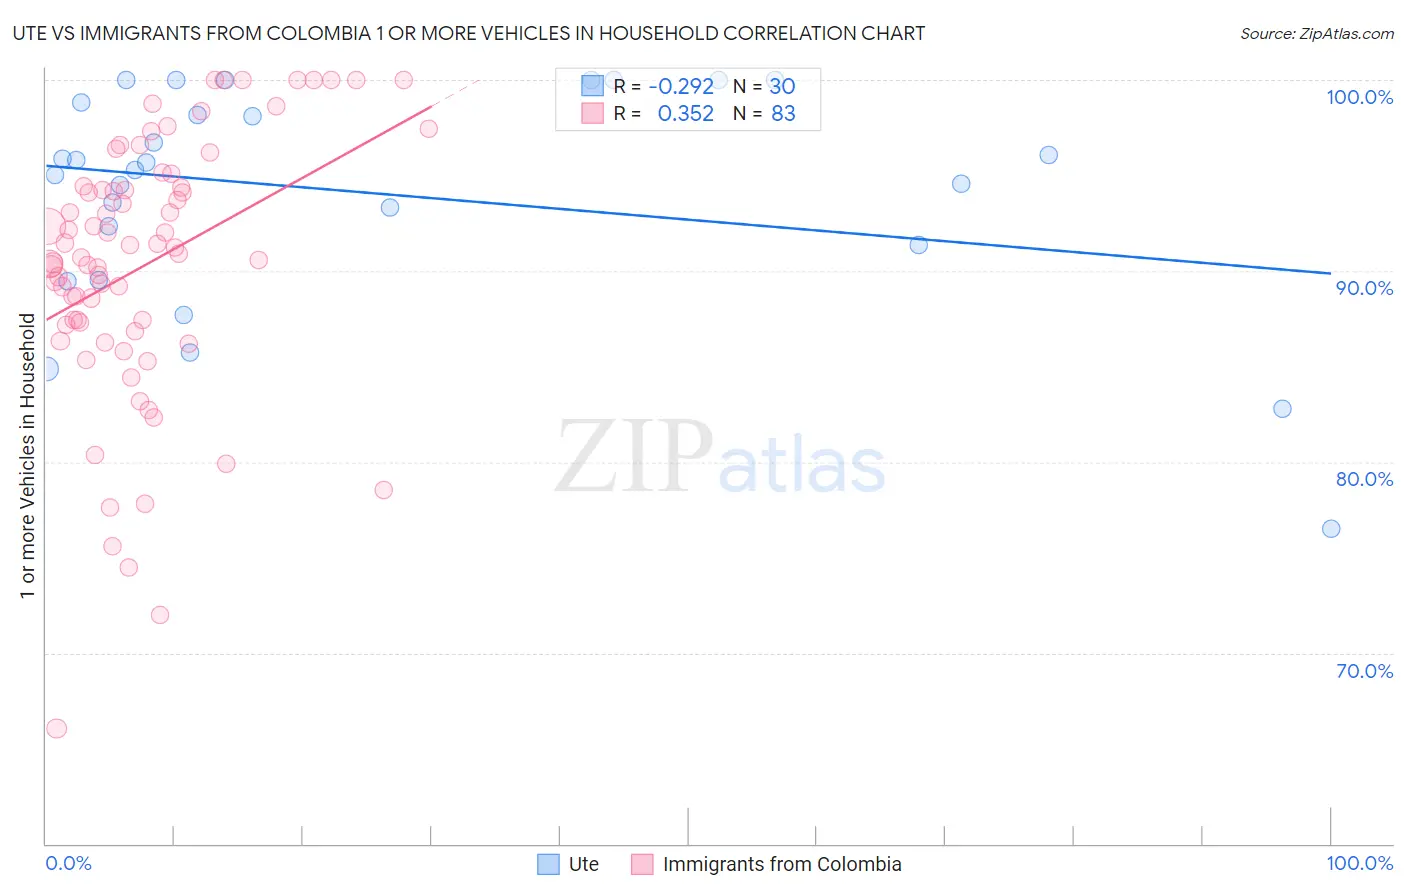
Ute vs Immigrants from Colombia 1 or more Vehicles in Household Correlation Chart
The statistical analysis conducted on geographies consisting of 55,668,072 people shows a weak negative correlation between the proportion of Ute and percentage of households with 1 or more vehicles available in the United States with a correlation coefficient (R) of -0.292 and weighted average of 88.7%. Similarly, the statistical analysis conducted on geographies consisting of 378,512,544 people shows a mild positive correlation between the proportion of Immigrants from Colombia and percentage of households with 1 or more vehicles available in the United States with a correlation coefficient (R) of 0.352 and weighted average of 87.6%, a difference of 1.2%.
1 or more Vehicles in Household Correlation Summary
| Measurement | Ute | Immigrants from Colombia |
| Minimum | 76.5% | 66.1% |
| Maximum | 100.0% | 100.0% |
| Range | 23.5% | 33.9% |
| Mean | 94.1% | 90.3% |
| Median | 95.5% | 90.9% |
| Interquartile 25% (IQ1) | 91.4% | 87.2% |
| Interquartile 75% (IQ3) | 98.8% | 94.4% |
| Interquartile Range (IQR) | 7.5% | 7.2% |
| Standard Deviation (Sample) | 5.9% | 6.9% |
| Standard Deviation (Population) | 5.8% | 6.9% |
Similar Demographics by 1 or more Vehicles in Household
Demographics Similar to Ute by 1 or more Vehicles in Household
In terms of 1 or more vehicles in household, the demographic groups most similar to Ute are Cheyenne (88.7%, a difference of 0.0%), Immigrants from Norway (88.7%, a difference of 0.010%), Immigrants from Romania (88.7%, a difference of 0.020%), Cree (88.7%, a difference of 0.030%), and Immigrants from Sierra Leone (88.7%, a difference of 0.030%).
| Demographics | Rating | Rank | 1 or more Vehicles in Household |
| Immigrants | Zaire | 8.1 /100 | #220 | Tragic 88.8% |
| Peruvians | 7.9 /100 | #221 | Tragic 88.8% |
| Uruguayans | 7.0 /100 | #222 | Tragic 88.8% |
| Immigrants | South America | 7.0 /100 | #223 | Tragic 88.8% |
| Immigrants | Hong Kong | 6.2 /100 | #224 | Tragic 88.7% |
| Cree | 6.0 /100 | #225 | Tragic 88.7% |
| Cheyenne | 5.7 /100 | #226 | Tragic 88.7% |
| Ute | 5.6 /100 | #227 | Tragic 88.7% |
| Immigrants | Norway | 5.5 /100 | #228 | Tragic 88.7% |
| Immigrants | Romania | 5.4 /100 | #229 | Tragic 88.7% |
| Immigrants | Sierra Leone | 5.2 /100 | #230 | Tragic 88.7% |
| Russians | 5.0 /100 | #231 | Tragic 88.7% |
| Immigrants | Japan | 4.9 /100 | #232 | Tragic 88.7% |
| Houma | 4.8 /100 | #233 | Tragic 88.6% |
| Immigrants | Peru | 4.7 /100 | #234 | Tragic 88.6% |
Demographics Similar to Immigrants from Colombia by 1 or more Vehicles in Household
In terms of 1 or more vehicles in household, the demographic groups most similar to Immigrants from Colombia are Israeli (87.7%, a difference of 0.030%), Immigrants from Europe (87.6%, a difference of 0.030%), Immigrants from Africa (87.6%, a difference of 0.080%), Panamanian (87.5%, a difference of 0.10%), and Bermudan (87.5%, a difference of 0.10%).
| Demographics | Rating | Rank | 1 or more Vehicles in Household |
| Macedonians | 0.6 /100 | #260 | Tragic 87.9% |
| Immigrants | Switzerland | 0.6 /100 | #261 | Tragic 87.9% |
| Sub-Saharan Africans | 0.5 /100 | #262 | Tragic 87.9% |
| Immigrants | Egypt | 0.5 /100 | #263 | Tragic 87.8% |
| Immigrants | Liberia | 0.4 /100 | #264 | Tragic 87.8% |
| Africans | 0.4 /100 | #265 | Tragic 87.8% |
| Israelis | 0.3 /100 | #266 | Tragic 87.7% |
| Immigrants | Colombia | 0.3 /100 | #267 | Tragic 87.6% |
| Immigrants | Europe | 0.2 /100 | #268 | Tragic 87.6% |
| Immigrants | Africa | 0.2 /100 | #269 | Tragic 87.6% |
| Panamanians | 0.2 /100 | #270 | Tragic 87.5% |
| Bermudans | 0.2 /100 | #271 | Tragic 87.5% |
| Aleuts | 0.2 /100 | #272 | Tragic 87.5% |
| Immigrants | Northern Africa | 0.2 /100 | #273 | Tragic 87.4% |
| Immigrants | Morocco | 0.1 /100 | #274 | Tragic 87.4% |