Mexican vs Immigrants from Colombia 1 or more Vehicles in Household
COMPARE
Mexican
Immigrants from Colombia
1 or more Vehicles in Household
1 or more Vehicles in Household Comparison
Mexicans
Immigrants from Colombia
93.0%
1 OR MORE VEHICLES IN HOUSEHOLD
100.0/ 100
METRIC RATING
15th/ 347
METRIC RANK
87.6%
1 OR MORE VEHICLES IN HOUSEHOLD
0.3/ 100
METRIC RATING
267th/ 347
METRIC RANK
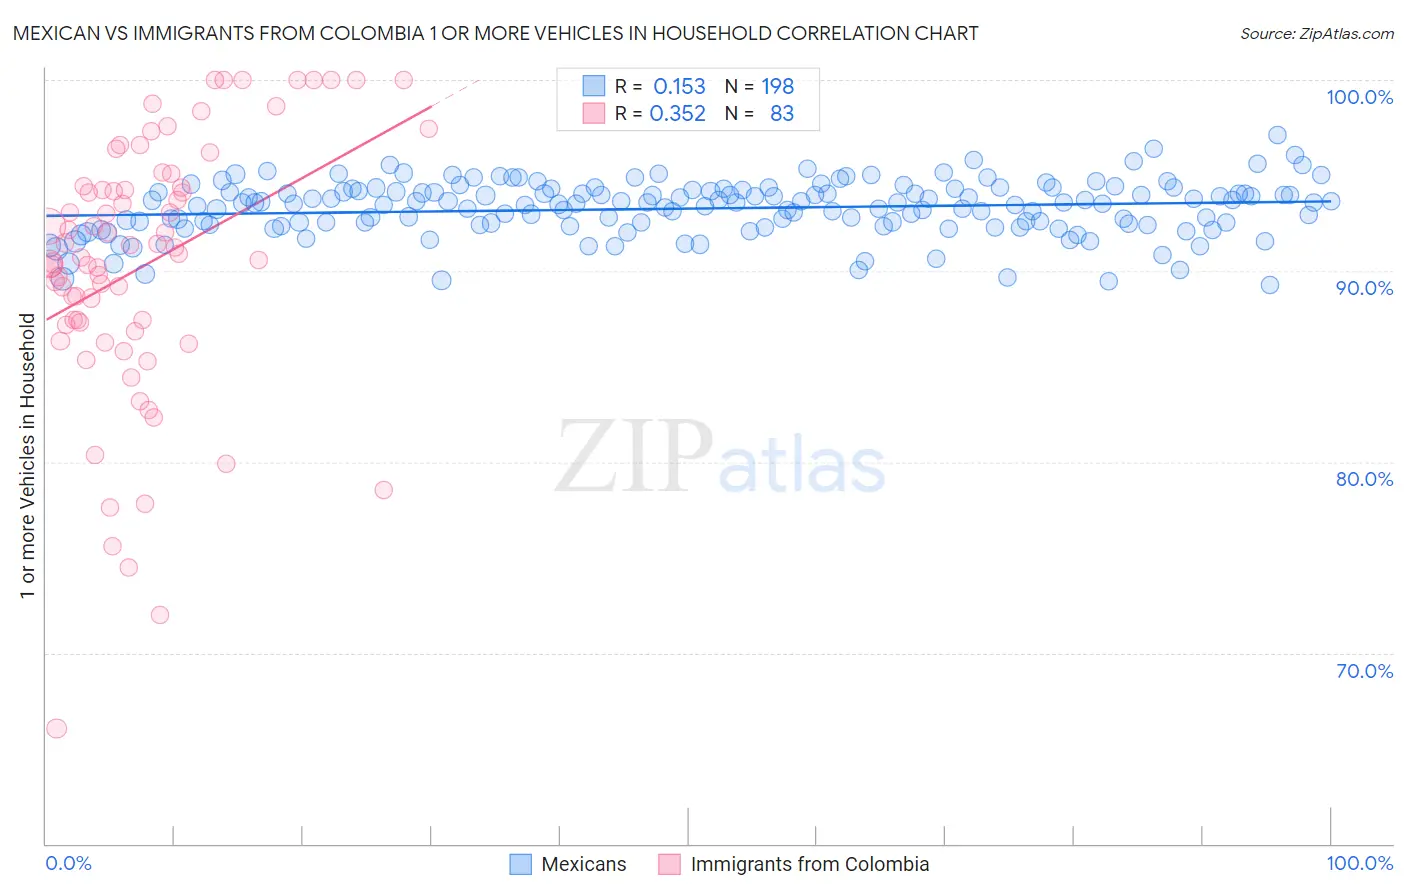
Mexican vs Immigrants from Colombia 1 or more Vehicles in Household Correlation Chart
The statistical analysis conducted on geographies consisting of 536,791,545 people shows a poor positive correlation between the proportion of Mexicans and percentage of households with 1 or more vehicles available in the United States with a correlation coefficient (R) of 0.153 and weighted average of 93.0%. Similarly, the statistical analysis conducted on geographies consisting of 378,512,544 people shows a mild positive correlation between the proportion of Immigrants from Colombia and percentage of households with 1 or more vehicles available in the United States with a correlation coefficient (R) of 0.352 and weighted average of 87.6%, a difference of 6.2%.
1 or more Vehicles in Household Correlation Summary
| Measurement | Mexican | Immigrants from Colombia |
| Minimum | 89.2% | 66.1% |
| Maximum | 97.1% | 100.0% |
| Range | 7.9% | 33.9% |
| Mean | 93.3% | 90.3% |
| Median | 93.6% | 90.9% |
| Interquartile 25% (IQ1) | 92.4% | 87.2% |
| Interquartile 75% (IQ3) | 94.2% | 94.4% |
| Interquartile Range (IQR) | 1.8% | 7.2% |
| Standard Deviation (Sample) | 1.4% | 6.9% |
| Standard Deviation (Population) | 1.4% | 6.9% |
Similar Demographics by 1 or more Vehicles in Household
Demographics Similar to Mexicans by 1 or more Vehicles in Household
In terms of 1 or more vehicles in household, the demographic groups most similar to Mexicans are Assyrian/Chaldean/Syriac (93.0%, a difference of 0.0%), Irish (93.1%, a difference of 0.020%), European (93.0%, a difference of 0.030%), White/Caucasian (93.1%, a difference of 0.060%), and Welsh (93.0%, a difference of 0.060%).
| Demographics | Rating | Rank | 1 or more Vehicles in Household |
| Swedes | 100.0 /100 | #8 | Exceptional 93.3% |
| Scotch-Irish | 100.0 /100 | #9 | Exceptional 93.3% |
| Dutch | 100.0 /100 | #10 | Exceptional 93.3% |
| Czechs | 100.0 /100 | #11 | Exceptional 93.3% |
| Scandinavians | 100.0 /100 | #12 | Exceptional 93.1% |
| Whites/Caucasians | 100.0 /100 | #13 | Exceptional 93.1% |
| Irish | 100.0 /100 | #14 | Exceptional 93.1% |
| Mexicans | 100.0 /100 | #15 | Exceptional 93.0% |
| Assyrians/Chaldeans/Syriacs | 100.0 /100 | #16 | Exceptional 93.0% |
| Europeans | 100.0 /100 | #17 | Exceptional 93.0% |
| Welsh | 100.0 /100 | #18 | Exceptional 93.0% |
| Tongans | 100.0 /100 | #19 | Exceptional 92.9% |
| Arapaho | 100.0 /100 | #20 | Exceptional 92.7% |
| Ottawa | 100.0 /100 | #21 | Exceptional 92.7% |
| French | 100.0 /100 | #22 | Exceptional 92.7% |
Demographics Similar to Immigrants from Colombia by 1 or more Vehicles in Household
In terms of 1 or more vehicles in household, the demographic groups most similar to Immigrants from Colombia are Israeli (87.7%, a difference of 0.030%), Immigrants from Europe (87.6%, a difference of 0.030%), Immigrants from Africa (87.6%, a difference of 0.080%), Panamanian (87.5%, a difference of 0.10%), and Bermudan (87.5%, a difference of 0.10%).
| Demographics | Rating | Rank | 1 or more Vehicles in Household |
| Macedonians | 0.6 /100 | #260 | Tragic 87.9% |
| Immigrants | Switzerland | 0.6 /100 | #261 | Tragic 87.9% |
| Sub-Saharan Africans | 0.5 /100 | #262 | Tragic 87.9% |
| Immigrants | Egypt | 0.5 /100 | #263 | Tragic 87.8% |
| Immigrants | Liberia | 0.4 /100 | #264 | Tragic 87.8% |
| Africans | 0.4 /100 | #265 | Tragic 87.8% |
| Israelis | 0.3 /100 | #266 | Tragic 87.7% |
| Immigrants | Colombia | 0.3 /100 | #267 | Tragic 87.6% |
| Immigrants | Europe | 0.2 /100 | #268 | Tragic 87.6% |
| Immigrants | Africa | 0.2 /100 | #269 | Tragic 87.6% |
| Panamanians | 0.2 /100 | #270 | Tragic 87.5% |
| Bermudans | 0.2 /100 | #271 | Tragic 87.5% |
| Aleuts | 0.2 /100 | #272 | Tragic 87.5% |
| Immigrants | Northern Africa | 0.2 /100 | #273 | Tragic 87.4% |
| Immigrants | Morocco | 0.1 /100 | #274 | Tragic 87.4% |