Immigrants from Mexico vs Immigrants from Colombia 1 or more Vehicles in Household
COMPARE
Immigrants from Mexico
Immigrants from Colombia
1 or more Vehicles in Household
1 or more Vehicles in Household Comparison
Immigrants from Mexico
Immigrants from Colombia
91.9%
1 OR MORE VEHICLES IN HOUSEHOLD
99.8/ 100
METRIC RATING
58th/ 347
METRIC RANK
87.6%
1 OR MORE VEHICLES IN HOUSEHOLD
0.3/ 100
METRIC RATING
267th/ 347
METRIC RANK
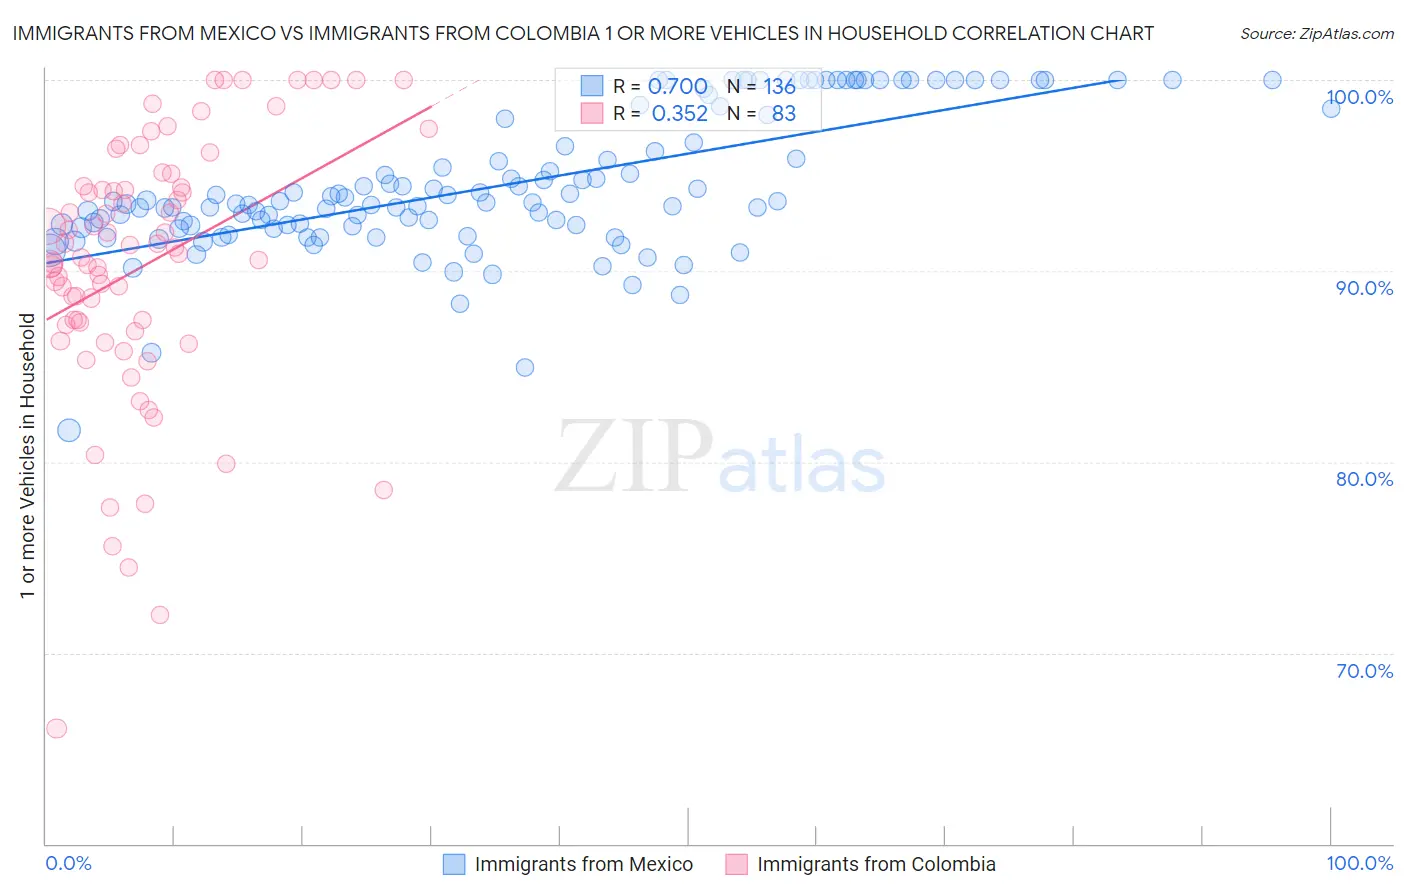
Immigrants from Mexico vs Immigrants from Colombia 1 or more Vehicles in Household Correlation Chart
The statistical analysis conducted on geographies consisting of 513,448,987 people shows a significant positive correlation between the proportion of Immigrants from Mexico and percentage of households with 1 or more vehicles available in the United States with a correlation coefficient (R) of 0.700 and weighted average of 91.9%. Similarly, the statistical analysis conducted on geographies consisting of 378,512,544 people shows a mild positive correlation between the proportion of Immigrants from Colombia and percentage of households with 1 or more vehicles available in the United States with a correlation coefficient (R) of 0.352 and weighted average of 87.6%, a difference of 4.9%.
1 or more Vehicles in Household Correlation Summary
| Measurement | Immigrants from Mexico | Immigrants from Colombia |
| Minimum | 81.7% | 66.1% |
| Maximum | 100.0% | 100.0% |
| Range | 18.3% | 33.9% |
| Mean | 94.5% | 90.3% |
| Median | 93.6% | 90.9% |
| Interquartile 25% (IQ1) | 92.3% | 87.2% |
| Interquartile 75% (IQ3) | 98.1% | 94.4% |
| Interquartile Range (IQR) | 5.8% | 7.2% |
| Standard Deviation (Sample) | 3.7% | 6.9% |
| Standard Deviation (Population) | 3.7% | 6.9% |
Similar Demographics by 1 or more Vehicles in Household
Demographics Similar to Immigrants from Mexico by 1 or more Vehicles in Household
In terms of 1 or more vehicles in household, the demographic groups most similar to Immigrants from Mexico are Venezuelan (91.9%, a difference of 0.010%), Iraqi (91.9%, a difference of 0.020%), Slovak (91.9%, a difference of 0.040%), Immigrants from India (91.9%, a difference of 0.050%), and Thai (91.9%, a difference of 0.050%).
| Demographics | Rating | Rank | 1 or more Vehicles in Household |
| Celtics | 99.9 /100 | #51 | Exceptional 92.1% |
| Koreans | 99.9 /100 | #52 | Exceptional 92.1% |
| Hawaiians | 99.9 /100 | #53 | Exceptional 92.0% |
| Slovenes | 99.9 /100 | #54 | Exceptional 92.0% |
| Immigrants | Afghanistan | 99.9 /100 | #55 | Exceptional 92.0% |
| Immigrants | Venezuela | 99.9 /100 | #56 | Exceptional 92.0% |
| Iraqis | 99.8 /100 | #57 | Exceptional 91.9% |
| Immigrants | Mexico | 99.8 /100 | #58 | Exceptional 91.9% |
| Venezuelans | 99.8 /100 | #59 | Exceptional 91.9% |
| Slovaks | 99.8 /100 | #60 | Exceptional 91.9% |
| Immigrants | India | 99.8 /100 | #61 | Exceptional 91.9% |
| Thais | 99.8 /100 | #62 | Exceptional 91.9% |
| Chinese | 99.8 /100 | #63 | Exceptional 91.9% |
| Croatians | 99.8 /100 | #64 | Exceptional 91.9% |
| Immigrants | Laos | 99.8 /100 | #65 | Exceptional 91.8% |
Demographics Similar to Immigrants from Colombia by 1 or more Vehicles in Household
In terms of 1 or more vehicles in household, the demographic groups most similar to Immigrants from Colombia are Israeli (87.7%, a difference of 0.030%), Immigrants from Europe (87.6%, a difference of 0.030%), Immigrants from Africa (87.6%, a difference of 0.080%), Panamanian (87.5%, a difference of 0.10%), and Bermudan (87.5%, a difference of 0.10%).
| Demographics | Rating | Rank | 1 or more Vehicles in Household |
| Macedonians | 0.6 /100 | #260 | Tragic 87.9% |
| Immigrants | Switzerland | 0.6 /100 | #261 | Tragic 87.9% |
| Sub-Saharan Africans | 0.5 /100 | #262 | Tragic 87.9% |
| Immigrants | Egypt | 0.5 /100 | #263 | Tragic 87.8% |
| Immigrants | Liberia | 0.4 /100 | #264 | Tragic 87.8% |
| Africans | 0.4 /100 | #265 | Tragic 87.8% |
| Israelis | 0.3 /100 | #266 | Tragic 87.7% |
| Immigrants | Colombia | 0.3 /100 | #267 | Tragic 87.6% |
| Immigrants | Europe | 0.2 /100 | #268 | Tragic 87.6% |
| Immigrants | Africa | 0.2 /100 | #269 | Tragic 87.6% |
| Panamanians | 0.2 /100 | #270 | Tragic 87.5% |
| Bermudans | 0.2 /100 | #271 | Tragic 87.5% |
| Aleuts | 0.2 /100 | #272 | Tragic 87.5% |
| Immigrants | Northern Africa | 0.2 /100 | #273 | Tragic 87.4% |
| Immigrants | Morocco | 0.1 /100 | #274 | Tragic 87.4% |