Ute vs Soviet Union 1 or more Vehicles in Household
COMPARE
Ute
Soviet Union
1 or more Vehicles in Household
1 or more Vehicles in Household Comparison
Ute
Soviet Union
88.7%
1 OR MORE VEHICLES IN HOUSEHOLD
5.6/ 100
METRIC RATING
227th/ 347
METRIC RANK
82.7%
1 OR MORE VEHICLES IN HOUSEHOLD
0.0/ 100
METRIC RATING
320th/ 347
METRIC RANK
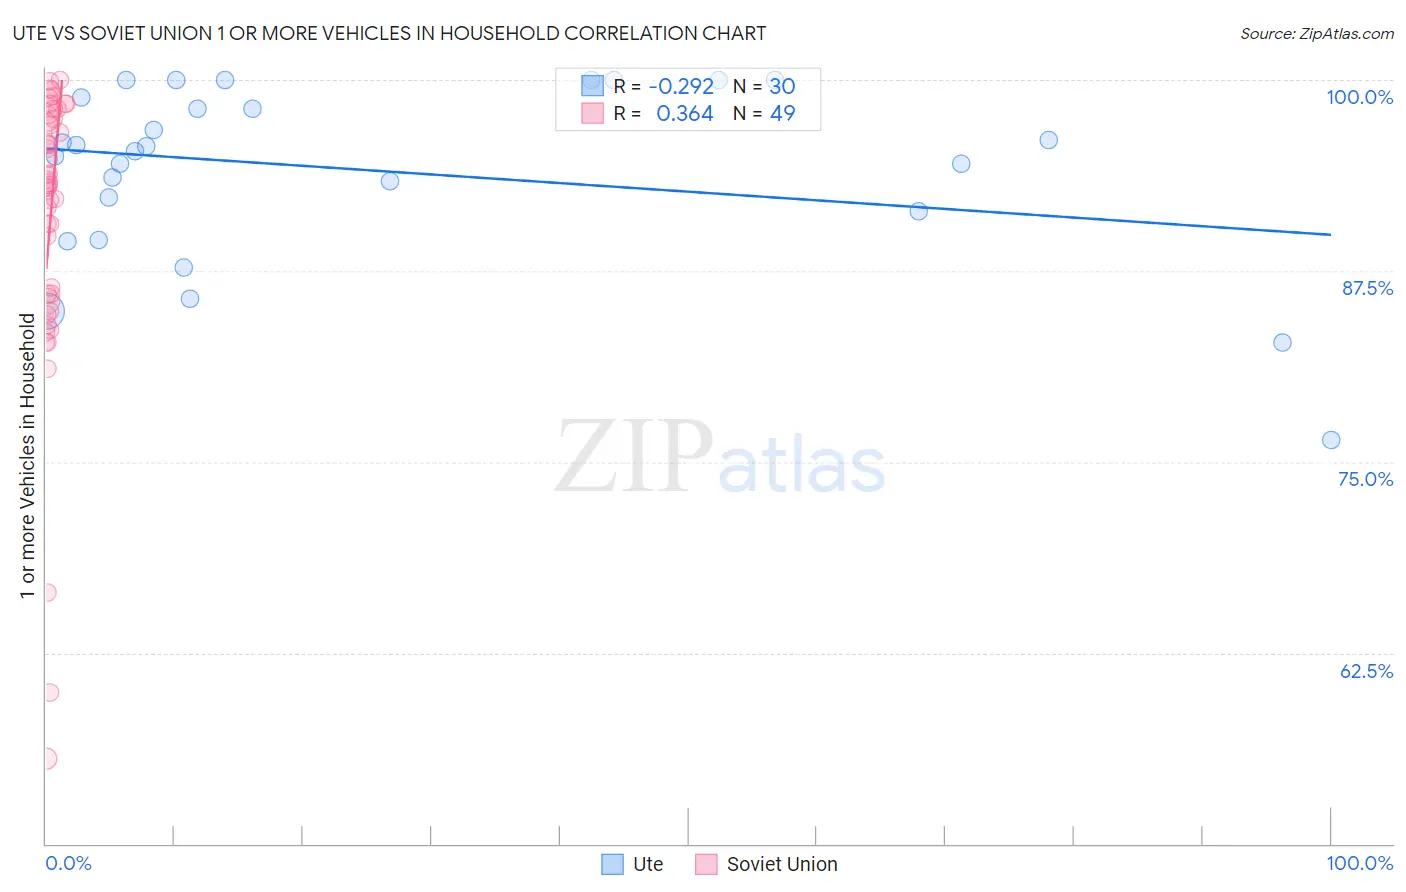
Ute vs Soviet Union 1 or more Vehicles in Household Correlation Chart
The statistical analysis conducted on geographies consisting of 55,668,072 people shows a weak negative correlation between the proportion of Ute and percentage of households with 1 or more vehicles available in the United States with a correlation coefficient (R) of -0.292 and weighted average of 88.7%. Similarly, the statistical analysis conducted on geographies consisting of 43,492,822 people shows a mild positive correlation between the proportion of Soviet Union and percentage of households with 1 or more vehicles available in the United States with a correlation coefficient (R) of 0.364 and weighted average of 82.7%, a difference of 7.3%.
1 or more Vehicles in Household Correlation Summary
| Measurement | Ute | Soviet Union |
| Minimum | 76.5% | 55.6% |
| Maximum | 100.0% | 100.0% |
| Range | 23.5% | 44.4% |
| Mean | 94.1% | 90.7% |
| Median | 95.5% | 93.3% |
| Interquartile 25% (IQ1) | 91.4% | 85.7% |
| Interquartile 75% (IQ3) | 98.8% | 97.6% |
| Interquartile Range (IQR) | 7.5% | 11.8% |
| Standard Deviation (Sample) | 5.9% | 9.6% |
| Standard Deviation (Population) | 5.8% | 9.5% |
Similar Demographics by 1 or more Vehicles in Household
Demographics Similar to Ute by 1 or more Vehicles in Household
In terms of 1 or more vehicles in household, the demographic groups most similar to Ute are Cheyenne (88.7%, a difference of 0.0%), Immigrants from Norway (88.7%, a difference of 0.010%), Immigrants from Romania (88.7%, a difference of 0.020%), Cree (88.7%, a difference of 0.030%), and Immigrants from Sierra Leone (88.7%, a difference of 0.030%).
| Demographics | Rating | Rank | 1 or more Vehicles in Household |
| Immigrants | Zaire | 8.1 /100 | #220 | Tragic 88.8% |
| Peruvians | 7.9 /100 | #221 | Tragic 88.8% |
| Uruguayans | 7.0 /100 | #222 | Tragic 88.8% |
| Immigrants | South America | 7.0 /100 | #223 | Tragic 88.8% |
| Immigrants | Hong Kong | 6.2 /100 | #224 | Tragic 88.7% |
| Cree | 6.0 /100 | #225 | Tragic 88.7% |
| Cheyenne | 5.7 /100 | #226 | Tragic 88.7% |
| Ute | 5.6 /100 | #227 | Tragic 88.7% |
| Immigrants | Norway | 5.5 /100 | #228 | Tragic 88.7% |
| Immigrants | Romania | 5.4 /100 | #229 | Tragic 88.7% |
| Immigrants | Sierra Leone | 5.2 /100 | #230 | Tragic 88.7% |
| Russians | 5.0 /100 | #231 | Tragic 88.7% |
| Immigrants | Japan | 4.9 /100 | #232 | Tragic 88.7% |
| Houma | 4.8 /100 | #233 | Tragic 88.6% |
| Immigrants | Peru | 4.7 /100 | #234 | Tragic 88.6% |
Demographics Similar to Soviet Union by 1 or more Vehicles in Household
In terms of 1 or more vehicles in household, the demographic groups most similar to Soviet Union are Jamaican (82.1%, a difference of 0.64%), Immigrants from Belarus (83.3%, a difference of 0.81%), Immigrants from Ghana (83.4%, a difference of 0.94%), Ghanaian (83.6%, a difference of 1.1%), and Immigrants from Cabo Verde (81.6%, a difference of 1.3%).
| Demographics | Rating | Rank | 1 or more Vehicles in Household |
| Immigrants | Israel | 0.0 /100 | #313 | Tragic 84.5% |
| Albanians | 0.0 /100 | #314 | Tragic 84.4% |
| Cypriots | 0.0 /100 | #315 | Tragic 84.4% |
| Alaska Natives | 0.0 /100 | #316 | Tragic 83.8% |
| Ghanaians | 0.0 /100 | #317 | Tragic 83.6% |
| Immigrants | Ghana | 0.0 /100 | #318 | Tragic 83.4% |
| Immigrants | Belarus | 0.0 /100 | #319 | Tragic 83.3% |
| Soviet Union | 0.0 /100 | #320 | Tragic 82.7% |
| Jamaicans | 0.0 /100 | #321 | Tragic 82.1% |
| Immigrants | Cabo Verde | 0.0 /100 | #322 | Tragic 81.6% |
| Immigrants | Yemen | 0.0 /100 | #323 | Tragic 80.5% |
| Immigrants | Caribbean | 0.0 /100 | #324 | Tragic 80.4% |
| Senegalese | 0.0 /100 | #325 | Tragic 80.4% |
| Immigrants | West Indies | 0.0 /100 | #326 | Tragic 79.5% |
| Immigrants | Senegal | 0.0 /100 | #327 | Tragic 79.0% |