Ute vs Immigrants from Colombia Median Household Income
COMPARE
Ute
Immigrants from Colombia
Median Household Income
Median Household Income Comparison
Ute
Immigrants from Colombia
$72,402
MEDIAN HOUSEHOLD INCOME
0.0/ 100
METRIC RATING
307th/ 347
METRIC RANK
$83,902
MEDIAN HOUSEHOLD INCOME
31.7/ 100
METRIC RATING
189th/ 347
METRIC RANK
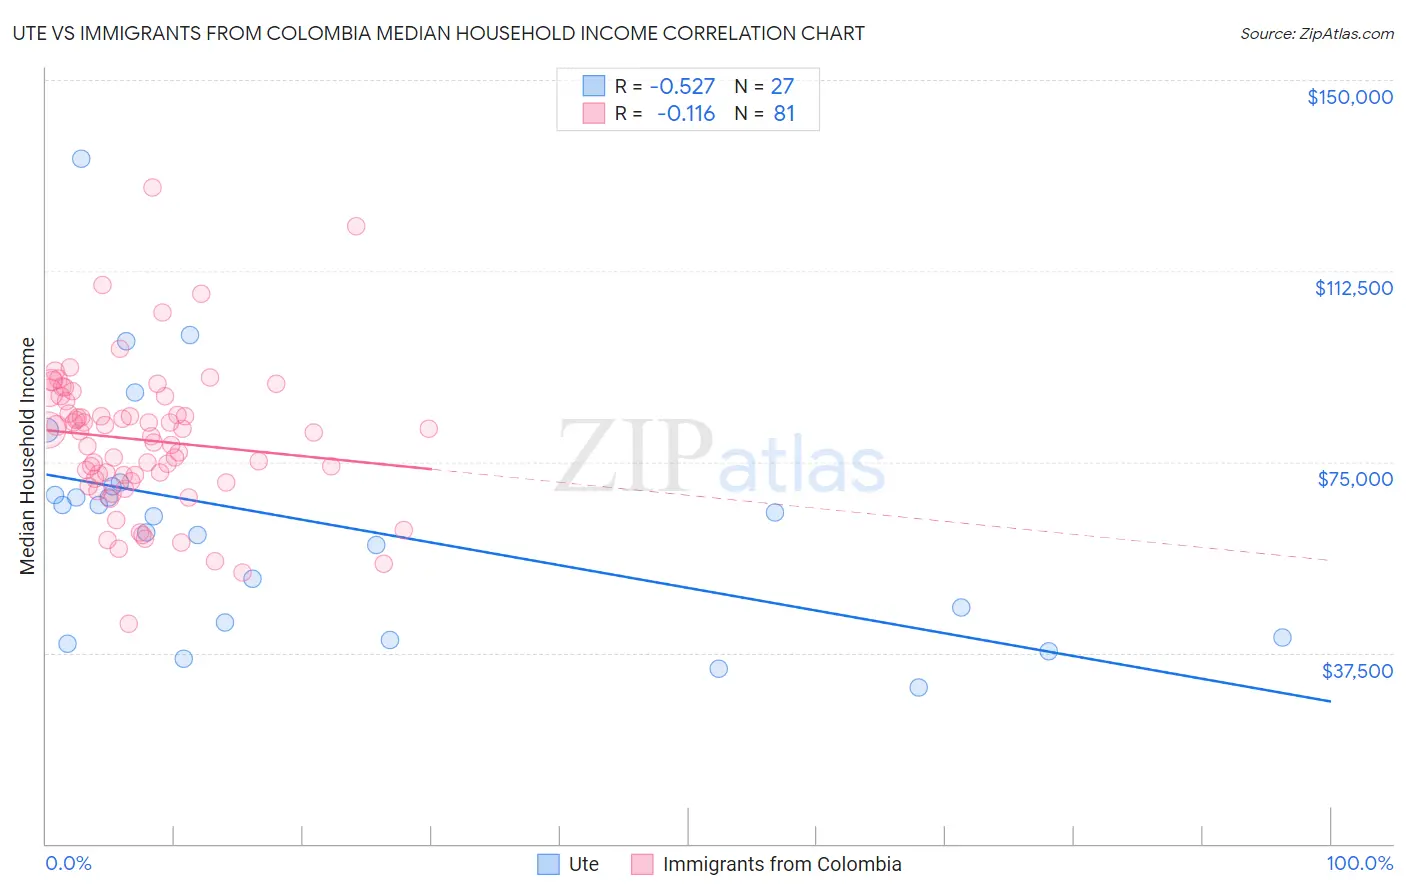
Ute vs Immigrants from Colombia Median Household Income Correlation Chart
The statistical analysis conducted on geographies consisting of 55,657,610 people shows a substantial negative correlation between the proportion of Ute and median household income in the United States with a correlation coefficient (R) of -0.527 and weighted average of $72,402. Similarly, the statistical analysis conducted on geographies consisting of 378,453,155 people shows a poor negative correlation between the proportion of Immigrants from Colombia and median household income in the United States with a correlation coefficient (R) of -0.116 and weighted average of $83,902, a difference of 15.9%.
Median Household Income Correlation Summary
| Measurement | Ute | Immigrants from Colombia |
| Minimum | $30,694 | $43,124 |
| Maximum | $134,629 | $128,990 |
| Range | $103,935 | $85,865 |
| Mean | $62,668 | $79,298 |
| Median | $64,375 | $80,865 |
| Interquartile 25% (IQ1) | $40,417 | $71,504 |
| Interquartile 75% (IQ3) | $70,252 | $87,336 |
| Interquartile Range (IQR) | $29,835 | $15,833 |
| Standard Deviation (Sample) | $23,676 | $14,245 |
| Standard Deviation (Population) | $23,234 | $14,157 |
Similar Demographics by Median Household Income
Demographics Similar to Ute by Median Household Income
In terms of median household income, the demographic groups most similar to Ute are Potawatomi ($72,576, a difference of 0.24%), Yakama ($72,225, a difference of 0.25%), Honduran ($72,588, a difference of 0.26%), Immigrants from Haiti ($72,599, a difference of 0.27%), and African ($72,650, a difference of 0.34%).
| Demographics | Rating | Rank | Median Household Income |
| Immigrants | Dominica | 0.0 /100 | #300 | Tragic $72,760 |
| Cherokee | 0.0 /100 | #301 | Tragic $72,682 |
| Shoshone | 0.0 /100 | #302 | Tragic $72,660 |
| Africans | 0.0 /100 | #303 | Tragic $72,650 |
| Immigrants | Haiti | 0.0 /100 | #304 | Tragic $72,599 |
| Hondurans | 0.0 /100 | #305 | Tragic $72,588 |
| Potawatomi | 0.0 /100 | #306 | Tragic $72,576 |
| Ute | 0.0 /100 | #307 | Tragic $72,402 |
| Yakama | 0.0 /100 | #308 | Tragic $72,225 |
| Immigrants | Caribbean | 0.0 /100 | #309 | Tragic $71,860 |
| U.S. Virgin Islanders | 0.0 /100 | #310 | Tragic $71,853 |
| Immigrants | Zaire | 0.0 /100 | #311 | Tragic $71,801 |
| Immigrants | Honduras | 0.0 /100 | #312 | Tragic $71,452 |
| Immigrants | Bahamas | 0.0 /100 | #313 | Tragic $71,349 |
| Dominicans | 0.0 /100 | #314 | Tragic $71,302 |
Demographics Similar to Immigrants from Colombia by Median Household Income
In terms of median household income, the demographic groups most similar to Immigrants from Colombia are Tlingit-Haida ($83,968, a difference of 0.080%), Slovak ($83,798, a difference of 0.12%), Puget Sound Salish ($84,011, a difference of 0.13%), Belgian ($84,008, a difference of 0.13%), and Iraqi ($83,753, a difference of 0.18%).
| Demographics | Rating | Rank | Median Household Income |
| Uruguayans | 43.5 /100 | #182 | Average $84,691 |
| Spaniards | 42.7 /100 | #183 | Average $84,644 |
| Immigrants | Eastern Africa | 37.4 /100 | #184 | Fair $84,299 |
| Kenyans | 34.2 /100 | #185 | Fair $84,085 |
| Puget Sound Salish | 33.2 /100 | #186 | Fair $84,011 |
| Belgians | 33.2 /100 | #187 | Fair $84,008 |
| Tlingit-Haida | 32.6 /100 | #188 | Fair $83,968 |
| Immigrants | Colombia | 31.7 /100 | #189 | Fair $83,902 |
| Slovaks | 30.2 /100 | #190 | Fair $83,798 |
| Iraqis | 29.6 /100 | #191 | Fair $83,753 |
| Welsh | 28.0 /100 | #192 | Fair $83,628 |
| Finns | 27.7 /100 | #193 | Fair $83,607 |
| Ghanaians | 27.4 /100 | #194 | Fair $83,582 |
| Immigrants | Armenia | 27.0 /100 | #195 | Fair $83,555 |
| French | 26.0 /100 | #196 | Fair $83,468 |