Immigrants from Serbia vs Immigrants from Laos 4 or more Vehicles in Household
COMPARE
Immigrants from Serbia
Immigrants from Laos
4 or more Vehicles in Household
4 or more Vehicles in Household Comparison
Immigrants from Serbia
Immigrants from Laos
5.0%
4 OR MORE VEHICLES IN HOUSEHOLD
0.0/ 100
METRIC RATING
306th/ 347
METRIC RANK
7.7%
4 OR MORE VEHICLES IN HOUSEHOLD
100.0/ 100
METRIC RATING
51st/ 347
METRIC RANK
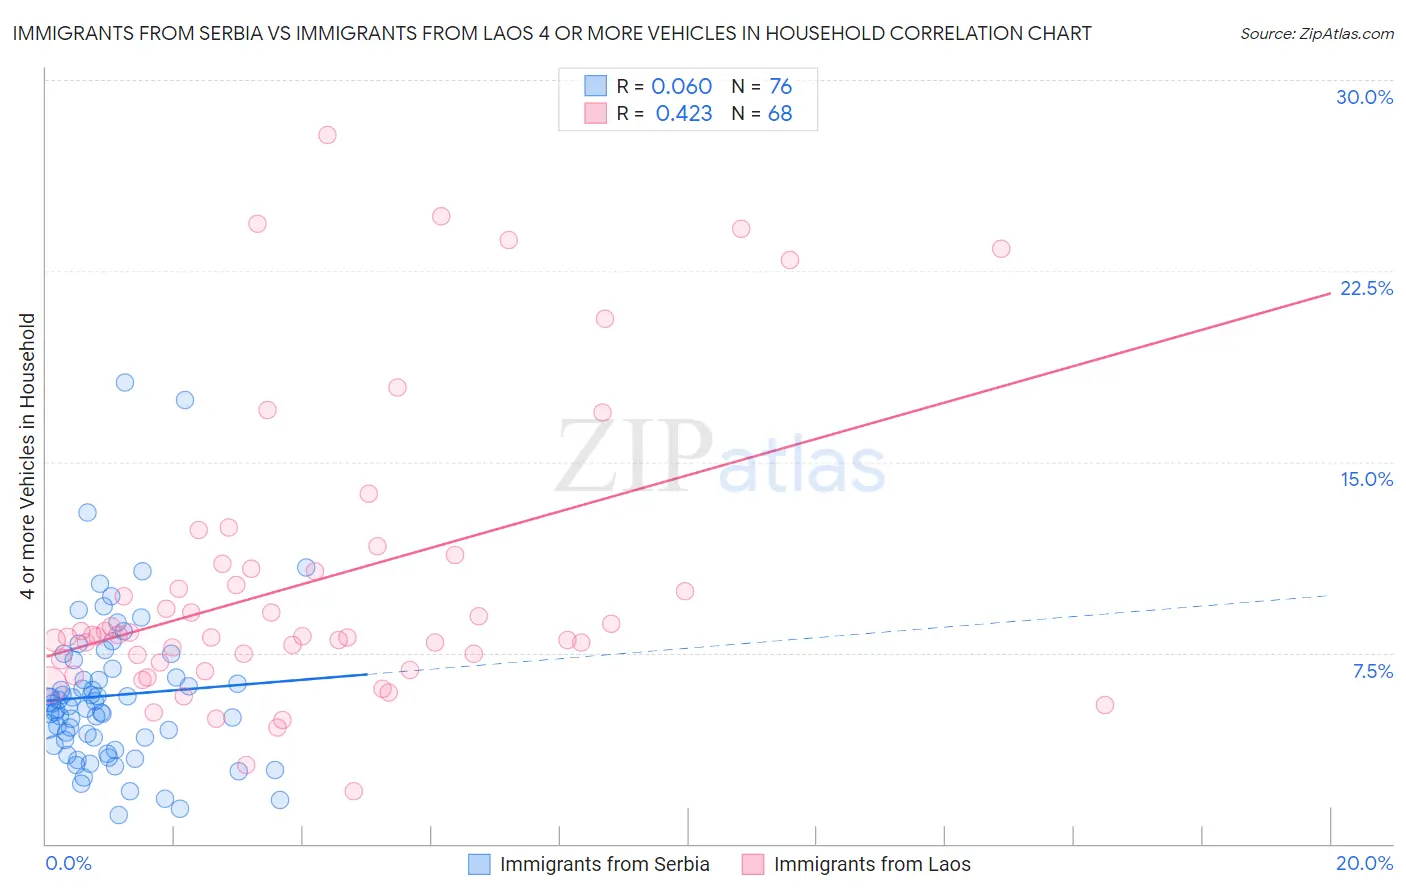
Immigrants from Serbia vs Immigrants from Laos 4 or more Vehicles in Household Correlation Chart
The statistical analysis conducted on geographies consisting of 131,136,431 people shows a slight positive correlation between the proportion of Immigrants from Serbia and percentage of households with 4 or more vehicles available in the United States with a correlation coefficient (R) of 0.060 and weighted average of 5.0%. Similarly, the statistical analysis conducted on geographies consisting of 201,310,160 people shows a moderate positive correlation between the proportion of Immigrants from Laos and percentage of households with 4 or more vehicles available in the United States with a correlation coefficient (R) of 0.423 and weighted average of 7.7%, a difference of 53.4%.
4 or more Vehicles in Household Correlation Summary
| Measurement | Immigrants from Serbia | Immigrants from Laos |
| Minimum | 1.1% | 2.1% |
| Maximum | 18.1% | 27.9% |
| Range | 17.0% | 25.8% |
| Mean | 5.8% | 10.3% |
| Median | 5.4% | 8.2% |
| Interquartile 25% (IQ1) | 4.0% | 7.2% |
| Interquartile 75% (IQ3) | 6.7% | 10.9% |
| Interquartile Range (IQR) | 2.7% | 3.7% |
| Standard Deviation (Sample) | 3.1% | 5.8% |
| Standard Deviation (Population) | 3.0% | 5.7% |
Similar Demographics by 4 or more Vehicles in Household
Demographics Similar to Immigrants from Serbia by 4 or more Vehicles in Household
In terms of 4 or more vehicles in household, the demographic groups most similar to Immigrants from Serbia are Cypriot (5.0%, a difference of 0.090%), Somali (5.0%, a difference of 0.090%), Immigrants from Greece (5.1%, a difference of 0.64%), Menominee (5.0%, a difference of 0.94%), and Bahamian (5.1%, a difference of 1.1%).
| Demographics | Rating | Rank | 4 or more Vehicles in Household |
| Immigrants | Ghana | 0.1 /100 | #299 | Tragic 5.2% |
| Immigrants | Morocco | 0.0 /100 | #300 | Tragic 5.1% |
| Immigrants | Zaire | 0.0 /100 | #301 | Tragic 5.1% |
| Bahamians | 0.0 /100 | #302 | Tragic 5.1% |
| Immigrants | Greece | 0.0 /100 | #303 | Tragic 5.1% |
| Cypriots | 0.0 /100 | #304 | Tragic 5.0% |
| Somalis | 0.0 /100 | #305 | Tragic 5.0% |
| Immigrants | Serbia | 0.0 /100 | #306 | Tragic 5.0% |
| Menominee | 0.0 /100 | #307 | Tragic 5.0% |
| Paraguayans | 0.0 /100 | #308 | Tragic 4.9% |
| Immigrants | Somalia | 0.0 /100 | #309 | Tragic 4.9% |
| Moroccans | 0.0 /100 | #310 | Tragic 4.9% |
| Houma | 0.0 /100 | #311 | Tragic 4.9% |
| Albanians | 0.0 /100 | #312 | Tragic 4.8% |
| Immigrants | Israel | 0.0 /100 | #313 | Tragic 4.8% |
Demographics Similar to Immigrants from Laos by 4 or more Vehicles in Household
In terms of 4 or more vehicles in household, the demographic groups most similar to Immigrants from Laos are Japanese (7.7%, a difference of 0.12%), Immigrants from El Salvador (7.7%, a difference of 0.35%), Malaysian (7.7%, a difference of 0.50%), Cherokee (7.7%, a difference of 0.51%), and Dutch (7.7%, a difference of 0.58%).
| Demographics | Rating | Rank | 4 or more Vehicles in Household |
| Bhutanese | 100.0 /100 | #44 | Exceptional 7.8% |
| Choctaw | 100.0 /100 | #45 | Exceptional 7.8% |
| Crow | 100.0 /100 | #46 | Exceptional 7.8% |
| Osage | 100.0 /100 | #47 | Exceptional 7.8% |
| Swiss | 100.0 /100 | #48 | Exceptional 7.8% |
| Cherokee | 100.0 /100 | #49 | Exceptional 7.7% |
| Immigrants | El Salvador | 100.0 /100 | #50 | Exceptional 7.7% |
| Immigrants | Laos | 100.0 /100 | #51 | Exceptional 7.7% |
| Japanese | 100.0 /100 | #52 | Exceptional 7.7% |
| Malaysians | 100.0 /100 | #53 | Exceptional 7.7% |
| Dutch | 100.0 /100 | #54 | Exceptional 7.7% |
| Immigrants | Oceania | 100.0 /100 | #55 | Exceptional 7.6% |
| English | 100.0 /100 | #56 | Exceptional 7.6% |
| Pennsylvania Germans | 100.0 /100 | #57 | Exceptional 7.6% |
| Swedes | 100.0 /100 | #58 | Exceptional 7.6% |