Osage vs Immigrants from Hong Kong 4 or more Vehicles in Household
COMPARE
Osage
Immigrants from Hong Kong
4 or more Vehicles in Household
4 or more Vehicles in Household Comparison
Osage
Immigrants from Hong Kong
7.8%
4 OR MORE VEHICLES IN HOUSEHOLD
100.0/ 100
METRIC RATING
47th/ 347
METRIC RANK
6.5%
4 OR MORE VEHICLES IN HOUSEHOLD
72.2/ 100
METRIC RATING
151st/ 347
METRIC RANK
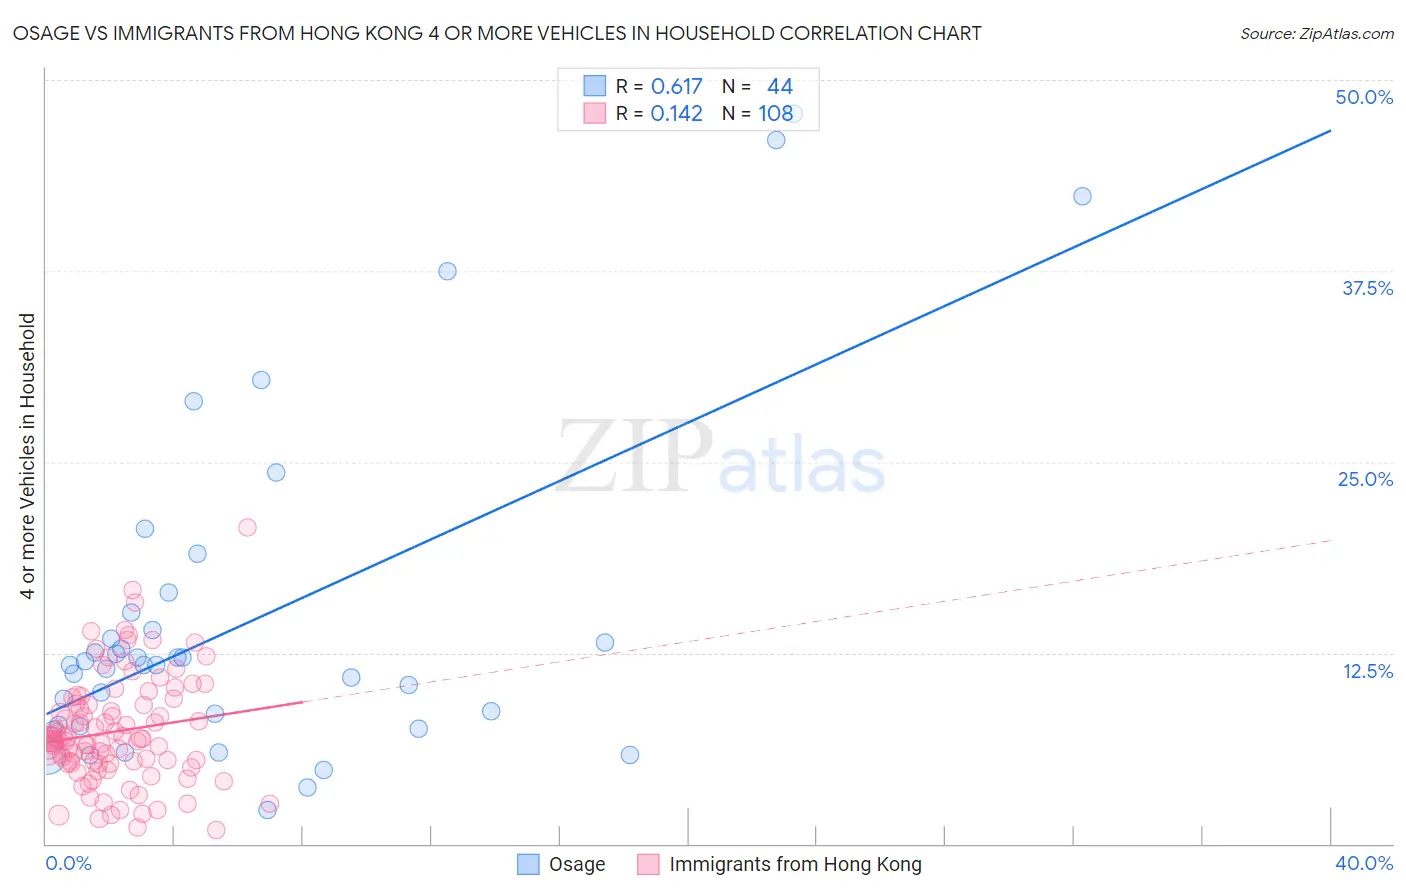
Osage vs Immigrants from Hong Kong 4 or more Vehicles in Household Correlation Chart
The statistical analysis conducted on geographies consisting of 91,747,496 people shows a significant positive correlation between the proportion of Osage and percentage of households with 4 or more vehicles available in the United States with a correlation coefficient (R) of 0.617 and weighted average of 7.8%. Similarly, the statistical analysis conducted on geographies consisting of 252,698,345 people shows a poor positive correlation between the proportion of Immigrants from Hong Kong and percentage of households with 4 or more vehicles available in the United States with a correlation coefficient (R) of 0.142 and weighted average of 6.5%, a difference of 19.9%.
4 or more Vehicles in Household Correlation Summary
| Measurement | Osage | Immigrants from Hong Kong |
| Minimum | 2.2% | 0.93% |
| Maximum | 47.8% | 20.7% |
| Range | 45.7% | 19.7% |
| Mean | 14.6% | 7.3% |
| Median | 11.7% | 6.8% |
| Interquartile 25% (IQ1) | 7.7% | 5.3% |
| Interquartile 75% (IQ3) | 14.6% | 9.1% |
| Interquartile Range (IQR) | 6.8% | 3.9% |
| Standard Deviation (Sample) | 11.0% | 3.5% |
| Standard Deviation (Population) | 10.9% | 3.5% |
Similar Demographics by 4 or more Vehicles in Household
Demographics Similar to Osage by 4 or more Vehicles in Household
In terms of 4 or more vehicles in household, the demographic groups most similar to Osage are Crow (7.8%, a difference of 0.16%), Swiss (7.8%, a difference of 0.17%), Choctaw (7.8%, a difference of 0.33%), Cherokee (7.7%, a difference of 0.36%), and Bhutanese (7.8%, a difference of 0.38%).
| Demographics | Rating | Rank | 4 or more Vehicles in Household |
| Spanish | 100.0 /100 | #40 | Exceptional 7.9% |
| Pima | 100.0 /100 | #41 | Exceptional 7.9% |
| Salvadorans | 100.0 /100 | #42 | Exceptional 7.8% |
| Fijians | 100.0 /100 | #43 | Exceptional 7.8% |
| Bhutanese | 100.0 /100 | #44 | Exceptional 7.8% |
| Choctaw | 100.0 /100 | #45 | Exceptional 7.8% |
| Crow | 100.0 /100 | #46 | Exceptional 7.8% |
| Osage | 100.0 /100 | #47 | Exceptional 7.8% |
| Swiss | 100.0 /100 | #48 | Exceptional 7.8% |
| Cherokee | 100.0 /100 | #49 | Exceptional 7.7% |
| Immigrants | El Salvador | 100.0 /100 | #50 | Exceptional 7.7% |
| Immigrants | Laos | 100.0 /100 | #51 | Exceptional 7.7% |
| Japanese | 100.0 /100 | #52 | Exceptional 7.7% |
| Malaysians | 100.0 /100 | #53 | Exceptional 7.7% |
| Dutch | 100.0 /100 | #54 | Exceptional 7.7% |
Demographics Similar to Immigrants from Hong Kong by 4 or more Vehicles in Household
In terms of 4 or more vehicles in household, the demographic groups most similar to Immigrants from Hong Kong are Yuman (6.5%, a difference of 0.010%), Immigrants from Armenia (6.5%, a difference of 0.13%), New Zealander (6.5%, a difference of 0.14%), Central American Indian (6.5%, a difference of 0.14%), and Immigrants from Jordan (6.5%, a difference of 0.18%).
| Demographics | Rating | Rank | 4 or more Vehicles in Household |
| Immigrants | North America | 78.5 /100 | #144 | Good 6.5% |
| Croatians | 77.8 /100 | #145 | Good 6.5% |
| Immigrants | Costa Rica | 74.4 /100 | #146 | Good 6.5% |
| Immigrants | Iran | 73.9 /100 | #147 | Good 6.5% |
| Immigrants | Jordan | 73.7 /100 | #148 | Good 6.5% |
| Greeks | 73.6 /100 | #149 | Good 6.5% |
| New Zealanders | 73.3 /100 | #150 | Good 6.5% |
| Immigrants | Hong Kong | 72.2 /100 | #151 | Good 6.5% |
| Yuman | 72.1 /100 | #152 | Good 6.5% |
| Immigrants | Armenia | 71.2 /100 | #153 | Good 6.5% |
| Central American Indians | 71.1 /100 | #154 | Good 6.5% |
| Iroquois | 70.4 /100 | #155 | Good 6.5% |
| Iranians | 69.9 /100 | #156 | Good 6.5% |
| Peruvians | 69.4 /100 | #157 | Good 6.5% |
| Zimbabweans | 67.1 /100 | #158 | Good 6.4% |