Uruguayan vs Immigrants from Netherlands In Labor Force | Age 16-19
COMPARE
Uruguayan
Immigrants from Netherlands
In Labor Force | Age 16-19
In Labor Force | Age 16-19 Comparison
Uruguayans
Immigrants from Netherlands
34.9%
IN LABOR FORCE | AGE 16-19
2.6/ 100
METRIC RATING
242nd/ 347
METRIC RANK
37.8%
IN LABOR FORCE | AGE 16-19
93.7/ 100
METRIC RATING
134th/ 347
METRIC RANK
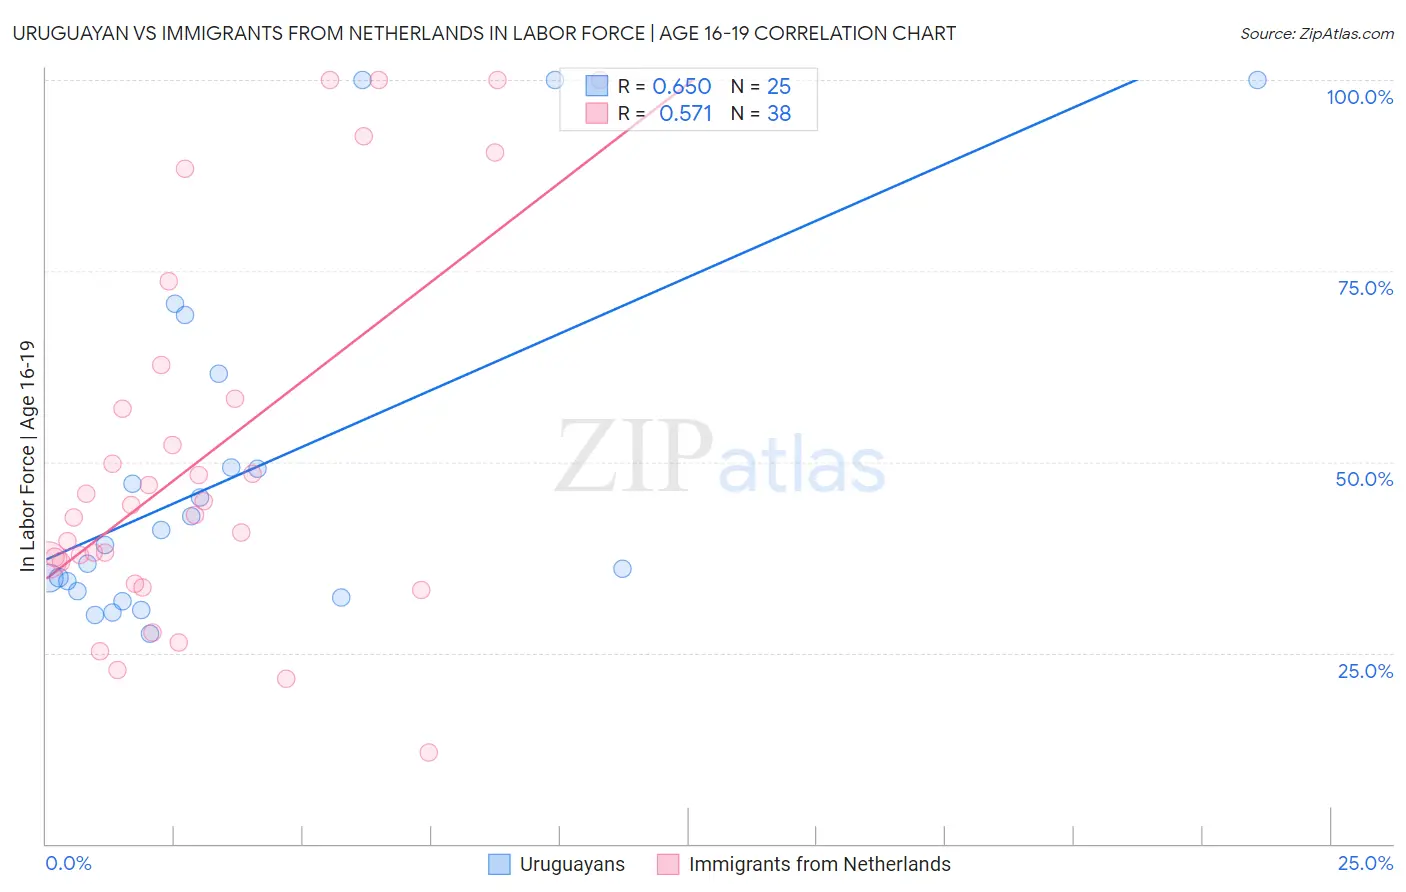
Uruguayan vs Immigrants from Netherlands In Labor Force | Age 16-19 Correlation Chart
The statistical analysis conducted on geographies consisting of 144,711,789 people shows a significant positive correlation between the proportion of Uruguayans and labor force participation rate among population between the ages 16 and 19 in the United States with a correlation coefficient (R) of 0.650 and weighted average of 34.9%. Similarly, the statistical analysis conducted on geographies consisting of 237,512,378 people shows a substantial positive correlation between the proportion of Immigrants from Netherlands and labor force participation rate among population between the ages 16 and 19 in the United States with a correlation coefficient (R) of 0.571 and weighted average of 37.8%, a difference of 8.3%.
In Labor Force | Age 16-19 Correlation Summary
| Measurement | Uruguayan | Immigrants from Netherlands |
| Minimum | 27.5% | 12.0% |
| Maximum | 100.0% | 100.0% |
| Range | 72.5% | 88.0% |
| Mean | 48.3% | 50.8% |
| Median | 39.1% | 43.7% |
| Interquartile 25% (IQ1) | 32.6% | 36.9% |
| Interquartile 75% (IQ3) | 55.3% | 58.3% |
| Interquartile Range (IQR) | 22.7% | 21.4% |
| Standard Deviation (Sample) | 22.7% | 24.7% |
| Standard Deviation (Population) | 22.2% | 24.3% |
Similar Demographics by In Labor Force | Age 16-19
Demographics Similar to Uruguayans by In Labor Force | Age 16-19
In terms of in labor force | age 16-19, the demographic groups most similar to Uruguayans are Pueblo (34.9%, a difference of 0.030%), Immigrants from Turkey (34.9%, a difference of 0.050%), Immigrants from Greece (34.9%, a difference of 0.10%), Immigrants from Ireland (35.0%, a difference of 0.13%), and Immigrants from Sri Lanka (34.9%, a difference of 0.13%).
| Demographics | Rating | Rank | In Labor Force | Age 16-19 |
| Immigrants | Philippines | 4.0 /100 | #235 | Tragic 35.1% |
| Immigrants | Australia | 3.6 /100 | #236 | Tragic 35.1% |
| Immigrants | India | 3.5 /100 | #237 | Tragic 35.0% |
| Immigrants | Vietnam | 3.4 /100 | #238 | Tragic 35.0% |
| Inupiat | 3.2 /100 | #239 | Tragic 35.0% |
| Immigrants | Central America | 3.0 /100 | #240 | Tragic 35.0% |
| Immigrants | Ireland | 2.9 /100 | #241 | Tragic 35.0% |
| Uruguayans | 2.6 /100 | #242 | Tragic 34.9% |
| Pueblo | 2.6 /100 | #243 | Tragic 34.9% |
| Immigrants | Turkey | 2.6 /100 | #244 | Tragic 34.9% |
| Immigrants | Greece | 2.4 /100 | #245 | Tragic 34.9% |
| Immigrants | Sri Lanka | 2.4 /100 | #246 | Tragic 34.9% |
| Laotians | 2.4 /100 | #247 | Tragic 34.9% |
| Central Americans | 2.2 /100 | #248 | Tragic 34.8% |
| Immigrants | Ukraine | 2.2 /100 | #249 | Tragic 34.8% |
Demographics Similar to Immigrants from Netherlands by In Labor Force | Age 16-19
In terms of in labor force | age 16-19, the demographic groups most similar to Immigrants from Netherlands are Macedonian (37.8%, a difference of 0.060%), Australian (37.8%, a difference of 0.090%), Cajun (37.8%, a difference of 0.090%), Cheyenne (37.9%, a difference of 0.21%), and Immigrants from Oceania (37.9%, a difference of 0.23%).
| Demographics | Rating | Rank | In Labor Force | Age 16-19 |
| Choctaw | 95.6 /100 | #127 | Exceptional 38.0% |
| New Zealanders | 95.6 /100 | #128 | Exceptional 38.0% |
| Spaniards | 95.5 /100 | #129 | Exceptional 38.0% |
| Immigrants | Zimbabwe | 95.4 /100 | #130 | Exceptional 38.0% |
| Immigrants | Austria | 95.0 /100 | #131 | Exceptional 37.9% |
| Immigrants | Oceania | 94.7 /100 | #132 | Exceptional 37.9% |
| Cheyenne | 94.6 /100 | #133 | Exceptional 37.9% |
| Immigrants | Netherlands | 93.7 /100 | #134 | Exceptional 37.8% |
| Macedonians | 93.4 /100 | #135 | Exceptional 37.8% |
| Australians | 93.2 /100 | #136 | Exceptional 37.8% |
| Cajuns | 93.2 /100 | #137 | Exceptional 37.8% |
| Comanche | 91.9 /100 | #138 | Exceptional 37.7% |
| Immigrants | Moldova | 91.9 /100 | #139 | Exceptional 37.7% |
| Estonians | 91.7 /100 | #140 | Exceptional 37.7% |
| Syrians | 90.7 /100 | #141 | Exceptional 37.6% |