Turkish vs Apache No Vehicles in Household
COMPARE
Turkish
Apache
No Vehicles in Household
No Vehicles in Household Comparison
Turks
Apache
11.7%
NO VEHICLES IN HOUSEHOLD
2.6/ 100
METRIC RATING
242nd/ 347
METRIC RANK
11.0%
NO VEHICLES IN HOUSEHOLD
14.8/ 100
METRIC RATING
210th/ 347
METRIC RANK
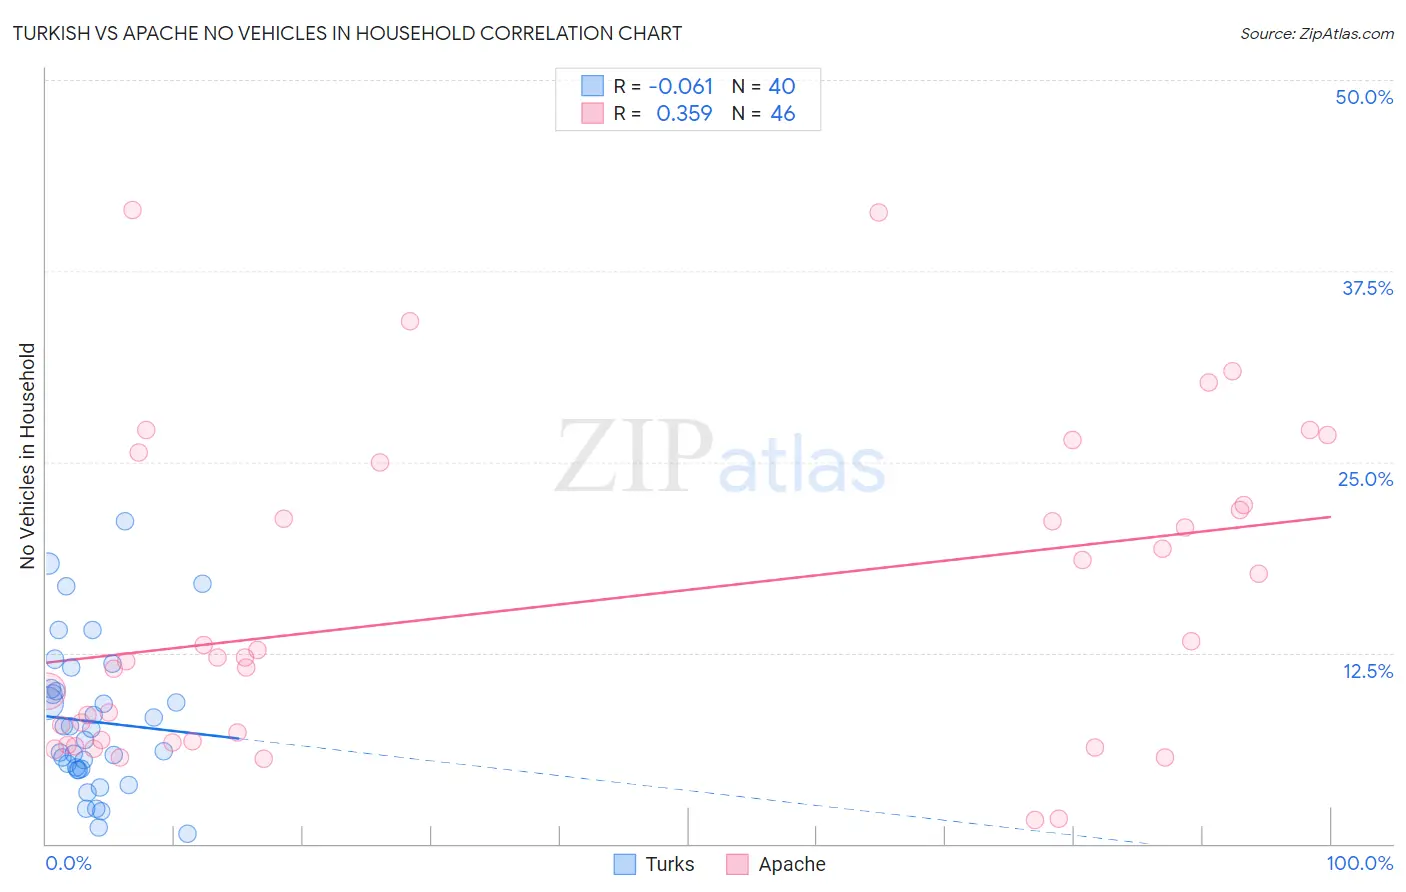
Turkish vs Apache No Vehicles in Household Correlation Chart
The statistical analysis conducted on geographies consisting of 271,510,878 people shows a slight negative correlation between the proportion of Turks and percentage of households with no vehicle available in the United States with a correlation coefficient (R) of -0.061 and weighted average of 11.7%. Similarly, the statistical analysis conducted on geographies consisting of 230,777,431 people shows a mild positive correlation between the proportion of Apache and percentage of households with no vehicle available in the United States with a correlation coefficient (R) of 0.359 and weighted average of 11.0%, a difference of 6.0%.
No Vehicles in Household Correlation Summary
| Measurement | Turkish | Apache |
| Minimum | 0.69% | 1.5% |
| Maximum | 21.1% | 41.5% |
| Range | 20.4% | 40.0% |
| Mean | 8.0% | 15.6% |
| Median | 7.1% | 12.2% |
| Interquartile 25% (IQ1) | 4.9% | 6.7% |
| Interquartile 75% (IQ3) | 10.1% | 22.2% |
| Interquartile Range (IQR) | 5.2% | 15.5% |
| Standard Deviation (Sample) | 4.8% | 10.3% |
| Standard Deviation (Population) | 4.8% | 10.2% |
Similar Demographics by No Vehicles in Household
Demographics Similar to Turks by No Vehicles in Household
In terms of no vehicles in household, the demographic groups most similar to Turks are Eastern European (11.7%, a difference of 0.11%), Immigrants (11.7%, a difference of 0.12%), Taiwanese (11.7%, a difference of 0.18%), Cheyenne (11.7%, a difference of 0.33%), and Immigrants from Portugal (11.7%, a difference of 0.51%).
| Demographics | Rating | Rank | No Vehicles in Household |
| Kiowa | 4.0 /100 | #235 | Tragic 11.5% |
| Cree | 3.5 /100 | #236 | Tragic 11.6% |
| Ute | 3.3 /100 | #237 | Tragic 11.6% |
| Russians | 3.2 /100 | #238 | Tragic 11.6% |
| Taiwanese | 2.8 /100 | #239 | Tragic 11.7% |
| Immigrants | Immigrants | 2.7 /100 | #240 | Tragic 11.7% |
| Eastern Europeans | 2.7 /100 | #241 | Tragic 11.7% |
| Turks | 2.6 /100 | #242 | Tragic 11.7% |
| Cheyenne | 2.4 /100 | #243 | Tragic 11.7% |
| Immigrants | Portugal | 2.2 /100 | #244 | Tragic 11.7% |
| Immigrants | Honduras | 2.1 /100 | #245 | Tragic 11.8% |
| Menominee | 2.0 /100 | #246 | Tragic 11.8% |
| Immigrants | Czechoslovakia | 2.0 /100 | #247 | Tragic 11.8% |
| Immigrants | Belgium | 1.9 /100 | #248 | Tragic 11.8% |
| Immigrants | Nigeria | 1.9 /100 | #249 | Tragic 11.8% |
Demographics Similar to Apache by No Vehicles in Household
In terms of no vehicles in household, the demographic groups most similar to Apache are Pennsylvania German (11.0%, a difference of 0.16%), Crow (11.0%, a difference of 0.16%), Immigrants from Italy (11.0%, a difference of 0.19%), Sierra Leonean (11.0%, a difference of 0.21%), and Immigrants from Western Asia (11.0%, a difference of 0.25%).
| Demographics | Rating | Rank | No Vehicles in Household |
| Iroquois | 17.6 /100 | #203 | Poor 10.9% |
| Guatemalans | 16.1 /100 | #204 | Poor 11.0% |
| Immigrants | Chile | 15.9 /100 | #205 | Poor 11.0% |
| Somalis | 15.9 /100 | #206 | Poor 11.0% |
| Sierra Leoneans | 15.7 /100 | #207 | Poor 11.0% |
| Immigrants | Italy | 15.6 /100 | #208 | Poor 11.0% |
| Pennsylvania Germans | 15.5 /100 | #209 | Poor 11.0% |
| Apache | 14.8 /100 | #210 | Poor 11.0% |
| Crow | 14.2 /100 | #211 | Poor 11.0% |
| Immigrants | Western Asia | 13.9 /100 | #212 | Poor 11.0% |
| Immigrants | Hungary | 12.3 /100 | #213 | Poor 11.1% |
| Immigrants | Denmark | 12.1 /100 | #214 | Poor 11.1% |
| Immigrants | Sri Lanka | 10.6 /100 | #215 | Poor 11.2% |
| Immigrants | Argentina | 10.6 /100 | #216 | Poor 11.2% |
| Dutch West Indians | 10.2 /100 | #217 | Poor 11.2% |