South African vs Apache No Vehicles in Household
COMPARE
South African
Apache
No Vehicles in Household
No Vehicles in Household Comparison
South Africans
Apache
10.2%
NO VEHICLES IN HOUSEHOLD
61.1/ 100
METRIC RATING
164th/ 347
METRIC RANK
11.0%
NO VEHICLES IN HOUSEHOLD
14.8/ 100
METRIC RATING
210th/ 347
METRIC RANK
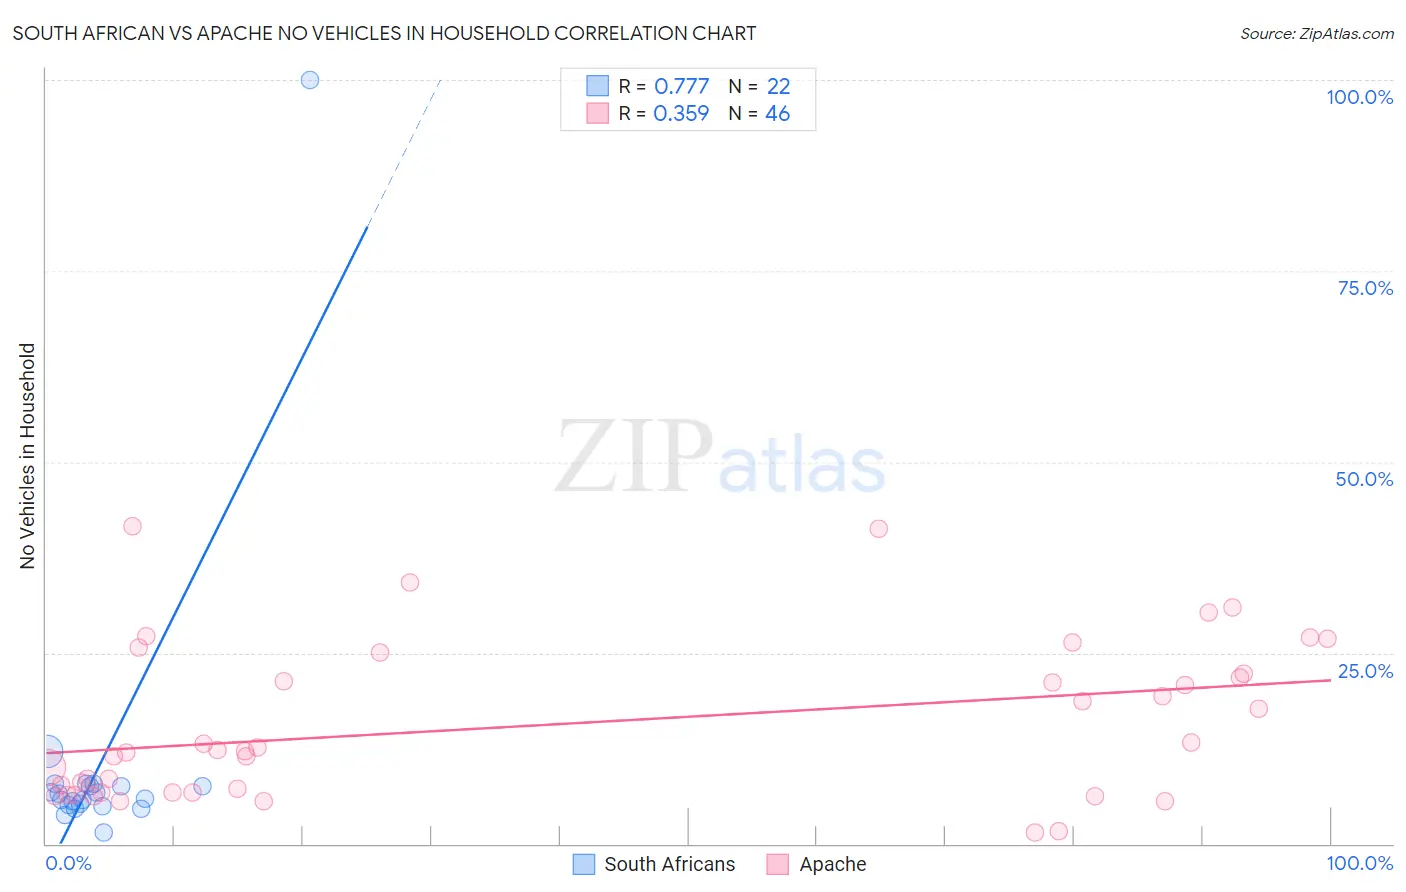
South African vs Apache No Vehicles in Household Correlation Chart
The statistical analysis conducted on geographies consisting of 182,340,903 people shows a strong positive correlation between the proportion of South Africans and percentage of households with no vehicle available in the United States with a correlation coefficient (R) of 0.777 and weighted average of 10.2%. Similarly, the statistical analysis conducted on geographies consisting of 230,777,431 people shows a mild positive correlation between the proportion of Apache and percentage of households with no vehicle available in the United States with a correlation coefficient (R) of 0.359 and weighted average of 11.0%, a difference of 7.6%.
No Vehicles in Household Correlation Summary
| Measurement | South African | Apache |
| Minimum | 1.5% | 1.5% |
| Maximum | 100.0% | 41.5% |
| Range | 98.5% | 40.0% |
| Mean | 10.5% | 15.6% |
| Median | 6.2% | 12.2% |
| Interquartile 25% (IQ1) | 5.1% | 6.7% |
| Interquartile 75% (IQ3) | 7.6% | 22.2% |
| Interquartile Range (IQR) | 2.5% | 15.5% |
| Standard Deviation (Sample) | 20.1% | 10.3% |
| Standard Deviation (Population) | 19.6% | 10.2% |
Similar Demographics by No Vehicles in Household
Demographics Similar to South Africans by No Vehicles in Household
In terms of no vehicles in household, the demographic groups most similar to South Africans are Comanche (10.2%, a difference of 0.040%), Immigrants from Costa Rica (10.3%, a difference of 0.10%), Immigrants from Saudi Arabia (10.3%, a difference of 0.34%), Immigrants from Cambodia (10.2%, a difference of 0.37%), and Immigrants from Austria (10.2%, a difference of 0.48%).
| Demographics | Rating | Rank | No Vehicles in Household |
| Australians | 70.6 /100 | #157 | Good 10.1% |
| Spanish American Indians | 70.2 /100 | #158 | Good 10.1% |
| Immigrants | Indonesia | 69.3 /100 | #159 | Good 10.1% |
| Immigrants | Middle Africa | 65.7 /100 | #160 | Good 10.2% |
| New Zealanders | 65.1 /100 | #161 | Good 10.2% |
| Immigrants | Austria | 64.4 /100 | #162 | Good 10.2% |
| Immigrants | Cambodia | 63.7 /100 | #163 | Good 10.2% |
| South Africans | 61.1 /100 | #164 | Good 10.2% |
| Comanche | 60.8 /100 | #165 | Good 10.2% |
| Immigrants | Costa Rica | 60.5 /100 | #166 | Good 10.3% |
| Immigrants | Saudi Arabia | 58.8 /100 | #167 | Average 10.3% |
| Indonesians | 56.7 /100 | #168 | Average 10.3% |
| Lumbee | 54.7 /100 | #169 | Average 10.3% |
| Immigrants | Latin America | 53.2 /100 | #170 | Average 10.4% |
| Hmong | 52.7 /100 | #171 | Average 10.4% |
Demographics Similar to Apache by No Vehicles in Household
In terms of no vehicles in household, the demographic groups most similar to Apache are Pennsylvania German (11.0%, a difference of 0.16%), Crow (11.0%, a difference of 0.16%), Immigrants from Italy (11.0%, a difference of 0.19%), Sierra Leonean (11.0%, a difference of 0.21%), and Immigrants from Western Asia (11.0%, a difference of 0.25%).
| Demographics | Rating | Rank | No Vehicles in Household |
| Iroquois | 17.6 /100 | #203 | Poor 10.9% |
| Guatemalans | 16.1 /100 | #204 | Poor 11.0% |
| Immigrants | Chile | 15.9 /100 | #205 | Poor 11.0% |
| Somalis | 15.9 /100 | #206 | Poor 11.0% |
| Sierra Leoneans | 15.7 /100 | #207 | Poor 11.0% |
| Immigrants | Italy | 15.6 /100 | #208 | Poor 11.0% |
| Pennsylvania Germans | 15.5 /100 | #209 | Poor 11.0% |
| Apache | 14.8 /100 | #210 | Poor 11.0% |
| Crow | 14.2 /100 | #211 | Poor 11.0% |
| Immigrants | Western Asia | 13.9 /100 | #212 | Poor 11.0% |
| Immigrants | Hungary | 12.3 /100 | #213 | Poor 11.1% |
| Immigrants | Denmark | 12.1 /100 | #214 | Poor 11.1% |
| Immigrants | Sri Lanka | 10.6 /100 | #215 | Poor 11.2% |
| Immigrants | Argentina | 10.6 /100 | #216 | Poor 11.2% |
| Dutch West Indians | 10.2 /100 | #217 | Poor 11.2% |