Tsimshian vs Immigrants from Sri Lanka 3rd Grade
COMPARE
Tsimshian
Immigrants from Sri Lanka
3rd Grade
3rd Grade Comparison
Tsimshian
Immigrants from Sri Lanka
98.8%
3RD GRADE
100.0/ 100
METRIC RATING
5th/ 347
METRIC RANK
97.7%
3RD GRADE
45.1/ 100
METRIC RATING
180th/ 347
METRIC RANK
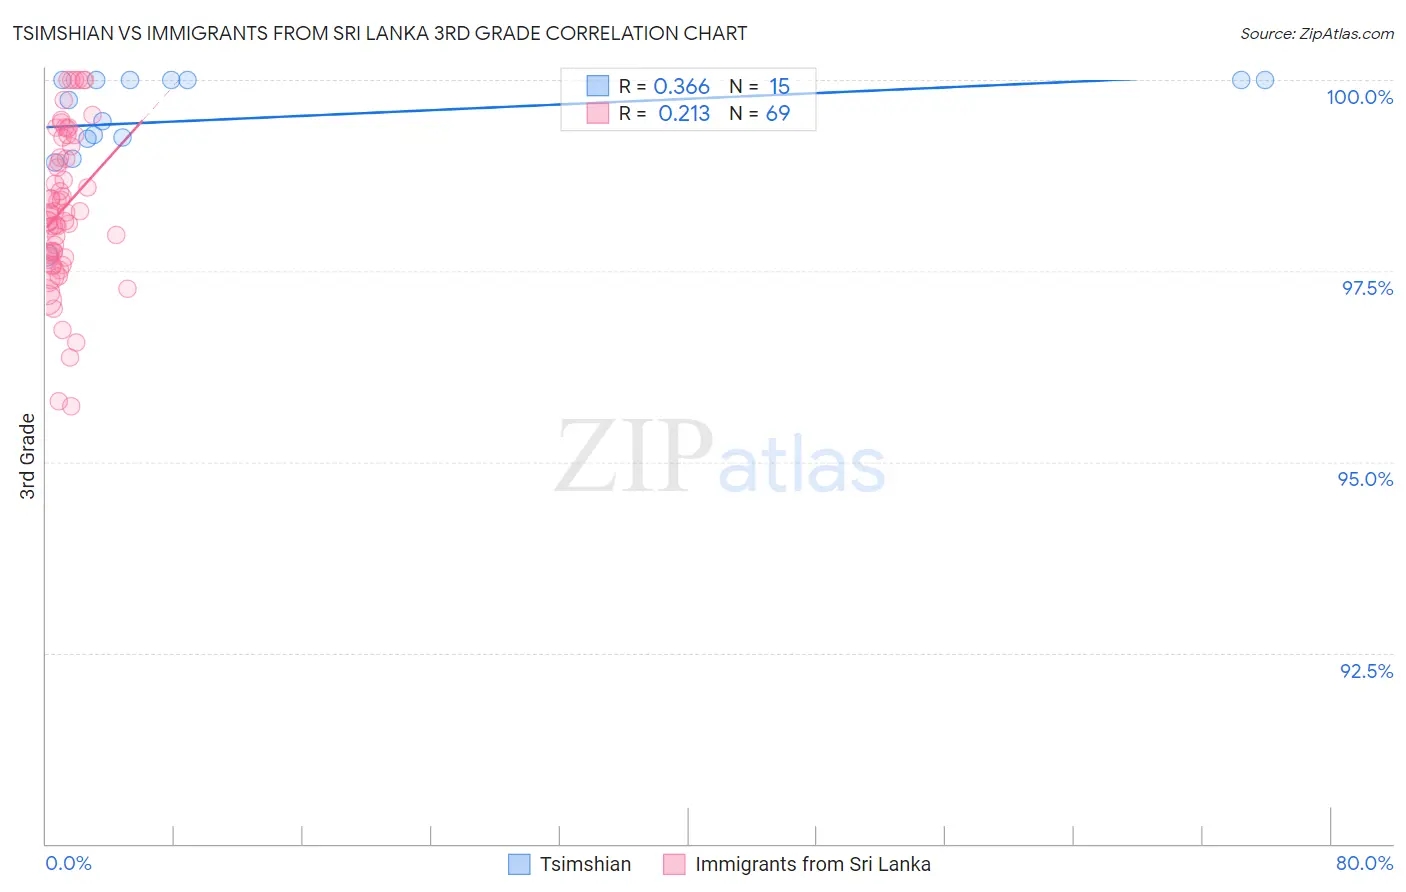
Tsimshian vs Immigrants from Sri Lanka 3rd Grade Correlation Chart
The statistical analysis conducted on geographies consisting of 15,626,544 people shows a mild positive correlation between the proportion of Tsimshian and percentage of population with at least 3rd grade education in the United States with a correlation coefficient (R) of 0.366 and weighted average of 98.8%. Similarly, the statistical analysis conducted on geographies consisting of 149,700,552 people shows a weak positive correlation between the proportion of Immigrants from Sri Lanka and percentage of population with at least 3rd grade education in the United States with a correlation coefficient (R) of 0.213 and weighted average of 97.7%, a difference of 1.0%.
3rd Grade Correlation Summary
| Measurement | Tsimshian | Immigrants from Sri Lanka |
| Minimum | 97.7% | 95.7% |
| Maximum | 100.0% | 100.0% |
| Range | 2.3% | 4.3% |
| Mean | 99.5% | 98.3% |
| Median | 99.7% | 98.3% |
| Interquartile 25% (IQ1) | 99.2% | 97.7% |
| Interquartile 75% (IQ3) | 100.0% | 99.2% |
| Interquartile Range (IQR) | 0.77% | 1.5% |
| Standard Deviation (Sample) | 0.65% | 1.0% |
| Standard Deviation (Population) | 0.62% | 1.00% |
Similar Demographics by 3rd Grade
Demographics Similar to Tsimshian by 3rd Grade
In terms of 3rd grade, the demographic groups most similar to Tsimshian are Inupiat (98.8%, a difference of 0.010%), Welsh (98.8%, a difference of 0.040%), Alaskan Athabascan (98.7%, a difference of 0.10%), Norwegian (98.6%, a difference of 0.14%), and Slovak (98.6%, a difference of 0.15%).
| Demographics | Rating | Rank | 3rd Grade |
| Crow | 100.0 /100 | #1 | Exceptional 99.6% |
| Yup'ik | 100.0 /100 | #2 | Exceptional 99.0% |
| Welsh | 100.0 /100 | #3 | Exceptional 98.8% |
| Inupiat | 100.0 /100 | #4 | Exceptional 98.8% |
| Tsimshian | 100.0 /100 | #5 | Exceptional 98.8% |
| Alaskan Athabascans | 100.0 /100 | #6 | Exceptional 98.7% |
| Norwegians | 100.0 /100 | #7 | Exceptional 98.6% |
| Slovaks | 100.0 /100 | #8 | Exceptional 98.6% |
| Germans | 100.0 /100 | #9 | Exceptional 98.6% |
| Alaska Natives | 100.0 /100 | #10 | Exceptional 98.6% |
| Slovenes | 100.0 /100 | #11 | Exceptional 98.6% |
| English | 100.0 /100 | #12 | Exceptional 98.6% |
| Tlingit-Haida | 100.0 /100 | #13 | Exceptional 98.5% |
| Carpatho Rusyns | 100.0 /100 | #14 | Exceptional 98.5% |
| Swedes | 100.0 /100 | #15 | Exceptional 98.5% |
Demographics Similar to Immigrants from Sri Lanka by 3rd Grade
In terms of 3rd grade, the demographic groups most similar to Immigrants from Sri Lanka are Immigrants from Brazil (97.7%, a difference of 0.0%), Immigrants from Belarus (97.7%, a difference of 0.0%), Immigrants from Venezuela (97.7%, a difference of 0.0%), Immigrants from Micronesia (97.8%, a difference of 0.010%), and Immigrants from Poland (97.8%, a difference of 0.010%).
| Demographics | Rating | Rank | 3rd Grade |
| Immigrants | Korea | 50.9 /100 | #173 | Average 97.8% |
| Navajo | 50.0 /100 | #174 | Average 97.8% |
| Immigrants | Micronesia | 47.6 /100 | #175 | Average 97.8% |
| Immigrants | Poland | 47.1 /100 | #176 | Average 97.8% |
| Egyptians | 46.6 /100 | #177 | Average 97.7% |
| Immigrants | Brazil | 46.4 /100 | #178 | Average 97.7% |
| Immigrants | Belarus | 45.9 /100 | #179 | Average 97.7% |
| Immigrants | Sri Lanka | 45.1 /100 | #180 | Average 97.7% |
| Immigrants | Venezuela | 44.4 /100 | #181 | Average 97.7% |
| Argentineans | 42.9 /100 | #182 | Average 97.7% |
| Arabs | 40.0 /100 | #183 | Fair 97.7% |
| Immigrants | Kazakhstan | 37.4 /100 | #184 | Fair 97.7% |
| Immigrants | Argentina | 37.0 /100 | #185 | Fair 97.7% |
| Portuguese | 36.2 /100 | #186 | Fair 97.7% |
| Natives/Alaskans | 35.2 /100 | #187 | Fair 97.7% |