Tsimshian vs Immigrants from Indonesia 1 or more Vehicles in Household
COMPARE
Tsimshian
Immigrants from Indonesia
1 or more Vehicles in Household
1 or more Vehicles in Household Comparison
Tsimshian
Immigrants from Indonesia
91.4%
1 OR MORE VEHICLES IN HOUSEHOLD
99.3/ 100
METRIC RATING
85th/ 347
METRIC RANK
90.0%
1 OR MORE VEHICLES IN HOUSEHOLD
68.8/ 100
METRIC RATING
160th/ 347
METRIC RANK
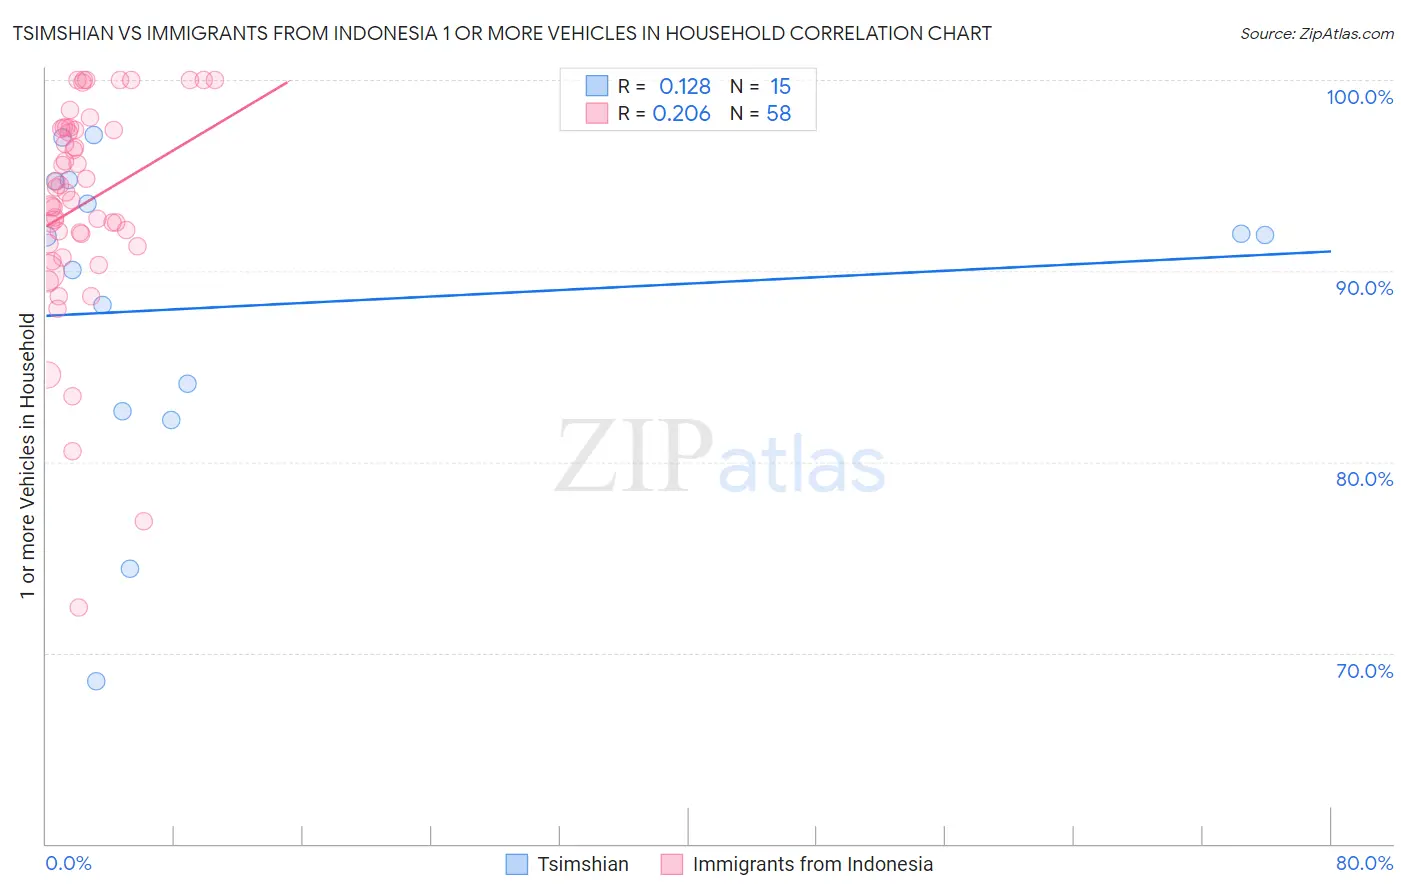
Tsimshian vs Immigrants from Indonesia 1 or more Vehicles in Household Correlation Chart
The statistical analysis conducted on geographies consisting of 15,626,544 people shows a poor positive correlation between the proportion of Tsimshian and percentage of households with 1 or more vehicles available in the United States with a correlation coefficient (R) of 0.128 and weighted average of 91.4%. Similarly, the statistical analysis conducted on geographies consisting of 215,621,131 people shows a weak positive correlation between the proportion of Immigrants from Indonesia and percentage of households with 1 or more vehicles available in the United States with a correlation coefficient (R) of 0.206 and weighted average of 90.0%, a difference of 1.6%.
1 or more Vehicles in Household Correlation Summary
| Measurement | Tsimshian | Immigrants from Indonesia |
| Minimum | 68.5% | 72.3% |
| Maximum | 97.2% | 100.0% |
| Range | 28.6% | 27.7% |
| Mean | 88.2% | 93.5% |
| Median | 91.8% | 93.9% |
| Interquartile 25% (IQ1) | 82.7% | 91.4% |
| Interquartile 75% (IQ3) | 94.7% | 97.4% |
| Interquartile Range (IQR) | 12.0% | 6.0% |
| Standard Deviation (Sample) | 8.4% | 5.6% |
| Standard Deviation (Population) | 8.1% | 5.6% |
Similar Demographics by 1 or more Vehicles in Household
Demographics Similar to Tsimshian by 1 or more Vehicles in Household
In terms of 1 or more vehicles in household, the demographic groups most similar to Tsimshian are Jordanian (91.4%, a difference of 0.010%), Lebanese (91.4%, a difference of 0.020%), Immigrants from England (91.4%, a difference of 0.020%), Osage (91.4%, a difference of 0.020%), and Immigrants from South Eastern Asia (91.4%, a difference of 0.030%).
| Demographics | Rating | Rank | 1 or more Vehicles in Household |
| Iranians | 99.4 /100 | #78 | Exceptional 91.5% |
| Immigrants | South Central Asia | 99.4 /100 | #79 | Exceptional 91.5% |
| Bolivians | 99.4 /100 | #80 | Exceptional 91.5% |
| Immigrants | South Eastern Asia | 99.3 /100 | #81 | Exceptional 91.4% |
| Lebanese | 99.3 /100 | #82 | Exceptional 91.4% |
| Immigrants | England | 99.3 /100 | #83 | Exceptional 91.4% |
| Jordanians | 99.3 /100 | #84 | Exceptional 91.4% |
| Tsimshian | 99.3 /100 | #85 | Exceptional 91.4% |
| Osage | 99.2 /100 | #86 | Exceptional 91.4% |
| Immigrants | Germany | 99.2 /100 | #87 | Exceptional 91.4% |
| Spanish Americans | 99.2 /100 | #88 | Exceptional 91.4% |
| Bangladeshis | 99.2 /100 | #89 | Exceptional 91.4% |
| Immigrants | Canada | 99.2 /100 | #90 | Exceptional 91.4% |
| Immigrants | Jordan | 99.2 /100 | #91 | Exceptional 91.4% |
| Bhutanese | 99.2 /100 | #92 | Exceptional 91.4% |
Demographics Similar to Immigrants from Indonesia by 1 or more Vehicles in Household
In terms of 1 or more vehicles in household, the demographic groups most similar to Immigrants from Indonesia are Salvadoran (90.0%, a difference of 0.0%), South African (90.0%, a difference of 0.020%), Spanish American Indian (89.9%, a difference of 0.030%), Immigrants from Congo (90.0%, a difference of 0.040%), and Brazilian (90.0%, a difference of 0.040%).
| Demographics | Rating | Rank | 1 or more Vehicles in Household |
| New Zealanders | 73.8 /100 | #153 | Good 90.1% |
| Immigrants | Uganda | 73.8 /100 | #154 | Good 90.1% |
| Immigrants | Immigrants | 73.6 /100 | #155 | Good 90.1% |
| Australians | 72.4 /100 | #156 | Good 90.0% |
| Immigrants | Congo | 71.2 /100 | #157 | Good 90.0% |
| Brazilians | 71.0 /100 | #158 | Good 90.0% |
| South Africans | 69.7 /100 | #159 | Good 90.0% |
| Immigrants | Indonesia | 68.8 /100 | #160 | Good 90.0% |
| Salvadorans | 68.7 /100 | #161 | Good 90.0% |
| Spanish American Indians | 67.0 /100 | #162 | Good 89.9% |
| Immigrants | Austria | 65.5 /100 | #163 | Good 89.9% |
| Comanche | 63.4 /100 | #164 | Good 89.9% |
| Immigrants | Saudi Arabia | 62.6 /100 | #165 | Good 89.9% |
| Immigrants | Middle Africa | 62.2 /100 | #166 | Good 89.9% |
| Immigrants | Latin America | 60.3 /100 | #167 | Good 89.8% |