Tsimshian vs Ghanaian 1 or more Vehicles in Household
COMPARE
Tsimshian
Ghanaian
1 or more Vehicles in Household
1 or more Vehicles in Household Comparison
Tsimshian
Ghanaians
91.4%
1 OR MORE VEHICLES IN HOUSEHOLD
99.3/ 100
METRIC RATING
85th/ 347
METRIC RANK
83.6%
1 OR MORE VEHICLES IN HOUSEHOLD
0.0/ 100
METRIC RATING
317th/ 347
METRIC RANK
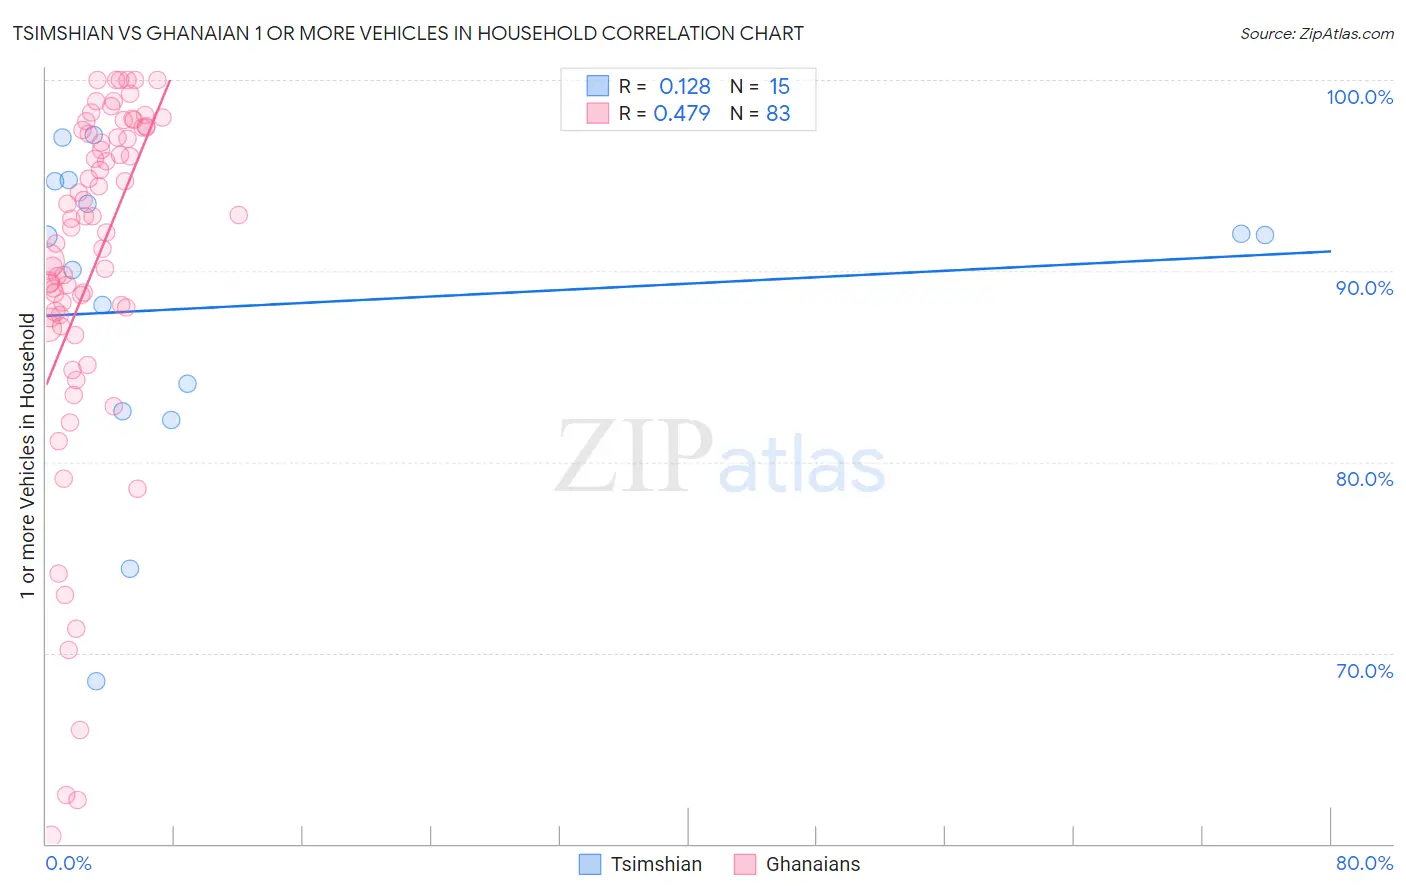
Tsimshian vs Ghanaian 1 or more Vehicles in Household Correlation Chart
The statistical analysis conducted on geographies consisting of 15,626,544 people shows a poor positive correlation between the proportion of Tsimshian and percentage of households with 1 or more vehicles available in the United States with a correlation coefficient (R) of 0.128 and weighted average of 91.4%. Similarly, the statistical analysis conducted on geographies consisting of 190,247,159 people shows a moderate positive correlation between the proportion of Ghanaians and percentage of households with 1 or more vehicles available in the United States with a correlation coefficient (R) of 0.479 and weighted average of 83.6%, a difference of 9.3%.
1 or more Vehicles in Household Correlation Summary
| Measurement | Tsimshian | Ghanaian |
| Minimum | 68.5% | 60.4% |
| Maximum | 97.2% | 100.0% |
| Range | 28.6% | 39.6% |
| Mean | 88.2% | 90.1% |
| Median | 91.8% | 92.3% |
| Interquartile 25% (IQ1) | 82.7% | 87.6% |
| Interquartile 75% (IQ3) | 94.7% | 97.4% |
| Interquartile Range (IQR) | 12.0% | 9.8% |
| Standard Deviation (Sample) | 8.4% | 9.3% |
| Standard Deviation (Population) | 8.1% | 9.2% |
Similar Demographics by 1 or more Vehicles in Household
Demographics Similar to Tsimshian by 1 or more Vehicles in Household
In terms of 1 or more vehicles in household, the demographic groups most similar to Tsimshian are Jordanian (91.4%, a difference of 0.010%), Lebanese (91.4%, a difference of 0.020%), Immigrants from England (91.4%, a difference of 0.020%), Osage (91.4%, a difference of 0.020%), and Immigrants from South Eastern Asia (91.4%, a difference of 0.030%).
| Demographics | Rating | Rank | 1 or more Vehicles in Household |
| Iranians | 99.4 /100 | #78 | Exceptional 91.5% |
| Immigrants | South Central Asia | 99.4 /100 | #79 | Exceptional 91.5% |
| Bolivians | 99.4 /100 | #80 | Exceptional 91.5% |
| Immigrants | South Eastern Asia | 99.3 /100 | #81 | Exceptional 91.4% |
| Lebanese | 99.3 /100 | #82 | Exceptional 91.4% |
| Immigrants | England | 99.3 /100 | #83 | Exceptional 91.4% |
| Jordanians | 99.3 /100 | #84 | Exceptional 91.4% |
| Tsimshian | 99.3 /100 | #85 | Exceptional 91.4% |
| Osage | 99.2 /100 | #86 | Exceptional 91.4% |
| Immigrants | Germany | 99.2 /100 | #87 | Exceptional 91.4% |
| Spanish Americans | 99.2 /100 | #88 | Exceptional 91.4% |
| Bangladeshis | 99.2 /100 | #89 | Exceptional 91.4% |
| Immigrants | Canada | 99.2 /100 | #90 | Exceptional 91.4% |
| Immigrants | Jordan | 99.2 /100 | #91 | Exceptional 91.4% |
| Bhutanese | 99.2 /100 | #92 | Exceptional 91.4% |
Demographics Similar to Ghanaians by 1 or more Vehicles in Household
In terms of 1 or more vehicles in household, the demographic groups most similar to Ghanaians are Immigrants from Ghana (83.4%, a difference of 0.20%), Alaska Native (83.8%, a difference of 0.22%), Immigrants from Belarus (83.3%, a difference of 0.34%), Cypriot (84.4%, a difference of 0.91%), and Albanian (84.4%, a difference of 0.98%).
| Demographics | Rating | Rank | 1 or more Vehicles in Household |
| U.S. Virgin Islanders | 0.0 /100 | #310 | Tragic 84.6% |
| Puerto Ricans | 0.0 /100 | #311 | Tragic 84.6% |
| Cape Verdeans | 0.0 /100 | #312 | Tragic 84.5% |
| Immigrants | Israel | 0.0 /100 | #313 | Tragic 84.5% |
| Albanians | 0.0 /100 | #314 | Tragic 84.4% |
| Cypriots | 0.0 /100 | #315 | Tragic 84.4% |
| Alaska Natives | 0.0 /100 | #316 | Tragic 83.8% |
| Ghanaians | 0.0 /100 | #317 | Tragic 83.6% |
| Immigrants | Ghana | 0.0 /100 | #318 | Tragic 83.4% |
| Immigrants | Belarus | 0.0 /100 | #319 | Tragic 83.3% |
| Soviet Union | 0.0 /100 | #320 | Tragic 82.7% |
| Jamaicans | 0.0 /100 | #321 | Tragic 82.1% |
| Immigrants | Cabo Verde | 0.0 /100 | #322 | Tragic 81.6% |
| Immigrants | Yemen | 0.0 /100 | #323 | Tragic 80.5% |
| Immigrants | Caribbean | 0.0 /100 | #324 | Tragic 80.4% |