Bermudan vs Slovak 2 or more Vehicles in Household
COMPARE
Bermudan
Slovak
2 or more Vehicles in Household
2 or more Vehicles in Household Comparison
Bermudans
Slovaks
50.6%
2 OR MORE VEHICLES IN HOUSEHOLD
0.0/ 100
METRIC RATING
294th/ 347
METRIC RANK
58.0%
2 OR MORE VEHICLES IN HOUSEHOLD
99.2/ 100
METRIC RATING
85th/ 347
METRIC RANK
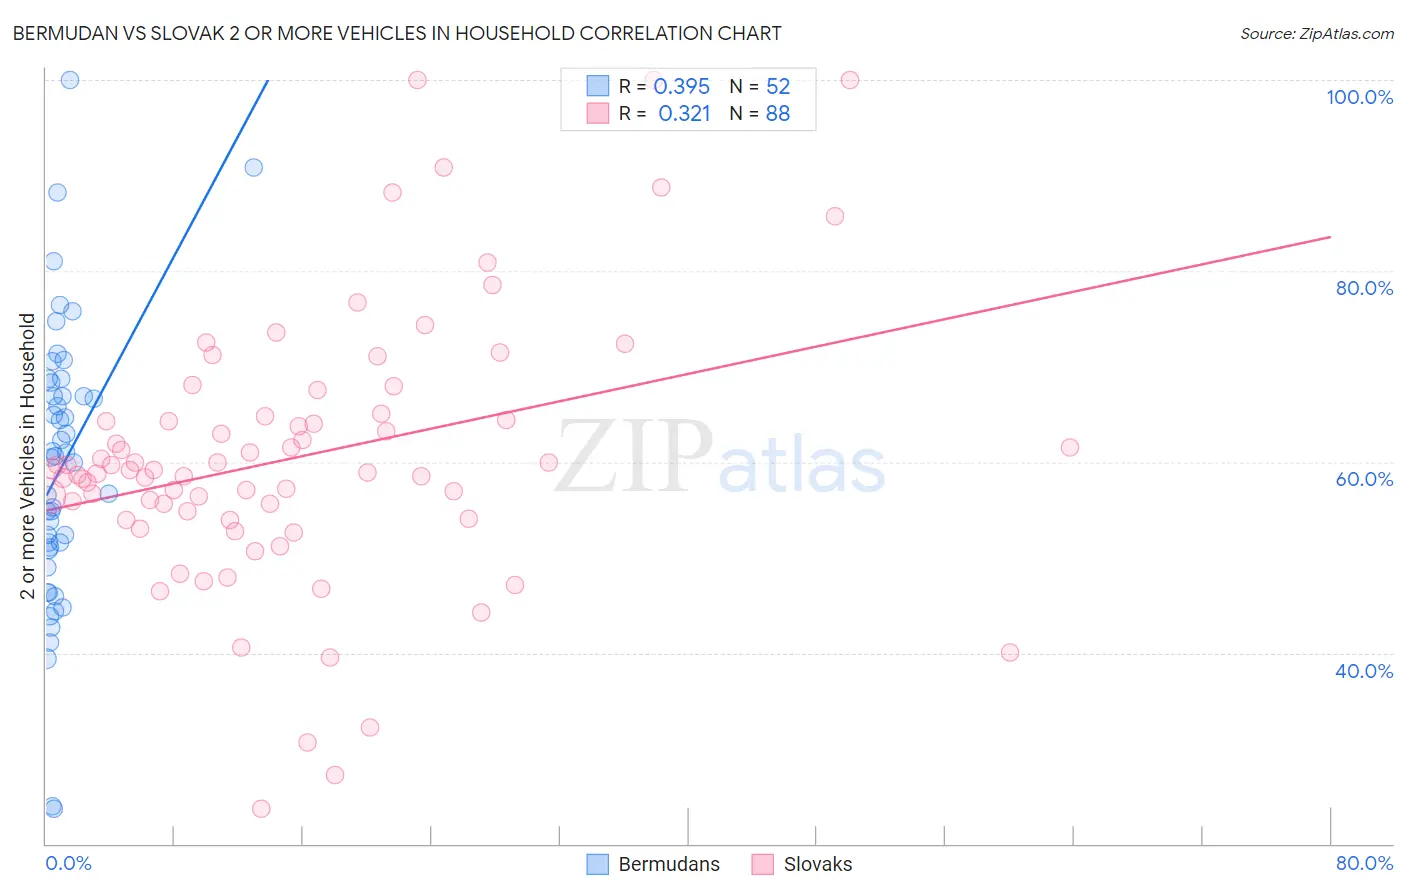
Bermudan vs Slovak 2 or more Vehicles in Household Correlation Chart
The statistical analysis conducted on geographies consisting of 55,716,623 people shows a mild positive correlation between the proportion of Bermudans and percentage of households with 2 or more vehicles available in the United States with a correlation coefficient (R) of 0.395 and weighted average of 50.6%. Similarly, the statistical analysis conducted on geographies consisting of 397,714,521 people shows a mild positive correlation between the proportion of Slovaks and percentage of households with 2 or more vehicles available in the United States with a correlation coefficient (R) of 0.321 and weighted average of 58.0%, a difference of 14.6%.
2 or more Vehicles in Household Correlation Summary
| Measurement | Bermudan | Slovak |
| Minimum | 23.7% | 23.6% |
| Maximum | 100.0% | 100.0% |
| Range | 76.3% | 76.4% |
| Mean | 59.5% | 60.5% |
| Median | 60.5% | 59.1% |
| Interquartile 25% (IQ1) | 50.9% | 54.5% |
| Interquartile 75% (IQ3) | 67.6% | 64.6% |
| Interquartile Range (IQR) | 16.8% | 10.1% |
| Standard Deviation (Sample) | 14.7% | 14.2% |
| Standard Deviation (Population) | 14.6% | 14.1% |
Similar Demographics by 2 or more Vehicles in Household
Demographics Similar to Bermudans by 2 or more Vehicles in Household
In terms of 2 or more vehicles in household, the demographic groups most similar to Bermudans are Cypriot (50.6%, a difference of 0.070%), Immigrants from Somalia (50.5%, a difference of 0.11%), Immigrants from Spain (50.4%, a difference of 0.38%), Paraguayan (50.3%, a difference of 0.51%), and Immigrants from Morocco (50.3%, a difference of 0.54%).
| Demographics | Rating | Rank | 2 or more Vehicles in Household |
| Immigrants | Serbia | 0.1 /100 | #287 | Tragic 51.3% |
| Okinawans | 0.1 /100 | #288 | Tragic 51.2% |
| Somalis | 0.0 /100 | #289 | Tragic 51.1% |
| Immigrants | Panama | 0.0 /100 | #290 | Tragic 51.1% |
| Belizeans | 0.0 /100 | #291 | Tragic 51.0% |
| Immigrants | Ukraine | 0.0 /100 | #292 | Tragic 50.9% |
| Blacks/African Americans | 0.0 /100 | #293 | Tragic 50.9% |
| Bermudans | 0.0 /100 | #294 | Tragic 50.6% |
| Cypriots | 0.0 /100 | #295 | Tragic 50.6% |
| Immigrants | Somalia | 0.0 /100 | #296 | Tragic 50.5% |
| Immigrants | Spain | 0.0 /100 | #297 | Tragic 50.4% |
| Paraguayans | 0.0 /100 | #298 | Tragic 50.3% |
| Immigrants | Morocco | 0.0 /100 | #299 | Tragic 50.3% |
| Immigrants | Russia | 0.0 /100 | #300 | Tragic 50.3% |
| Immigrants | Greece | 0.0 /100 | #301 | Tragic 50.2% |
Demographics Similar to Slovaks by 2 or more Vehicles in Household
In terms of 2 or more vehicles in household, the demographic groups most similar to Slovaks are Potawatomi (58.0%, a difference of 0.030%), Maltese (58.0%, a difference of 0.050%), Thai (57.9%, a difference of 0.070%), Icelander (58.0%, a difference of 0.080%), and Immigrants from Iran (57.9%, a difference of 0.080%).
| Demographics | Rating | Rank | 2 or more Vehicles in Household |
| Lithuanians | 99.5 /100 | #78 | Exceptional 58.2% |
| Delaware | 99.4 /100 | #79 | Exceptional 58.2% |
| Immigrants | England | 99.3 /100 | #80 | Exceptional 58.1% |
| Immigrants | Iraq | 99.3 /100 | #81 | Exceptional 58.1% |
| Iranians | 99.3 /100 | #82 | Exceptional 58.1% |
| Icelanders | 99.2 /100 | #83 | Exceptional 58.0% |
| Maltese | 99.2 /100 | #84 | Exceptional 58.0% |
| Slovaks | 99.2 /100 | #85 | Exceptional 58.0% |
| Potawatomi | 99.1 /100 | #86 | Exceptional 58.0% |
| Thais | 99.1 /100 | #87 | Exceptional 57.9% |
| Immigrants | Iran | 99.1 /100 | #88 | Exceptional 57.9% |
| Immigrants | Germany | 99.0 /100 | #89 | Exceptional 57.9% |
| Hispanics or Latinos | 99.0 /100 | #90 | Exceptional 57.9% |
| Pakistanis | 99.0 /100 | #91 | Exceptional 57.9% |
| Shoshone | 99.0 /100 | #92 | Exceptional 57.9% |