Immigrants from Argentina vs Syrian 4 or more Vehicles in Household
COMPARE
Immigrants from Argentina
Syrian
4 or more Vehicles in Household
4 or more Vehicles in Household Comparison
Immigrants from Argentina
Syrians
5.9%
4 OR MORE VEHICLES IN HOUSEHOLD
6.0/ 100
METRIC RATING
232nd/ 347
METRIC RANK
6.3%
4 OR MORE VEHICLES IN HOUSEHOLD
42.0/ 100
METRIC RATING
180th/ 347
METRIC RANK
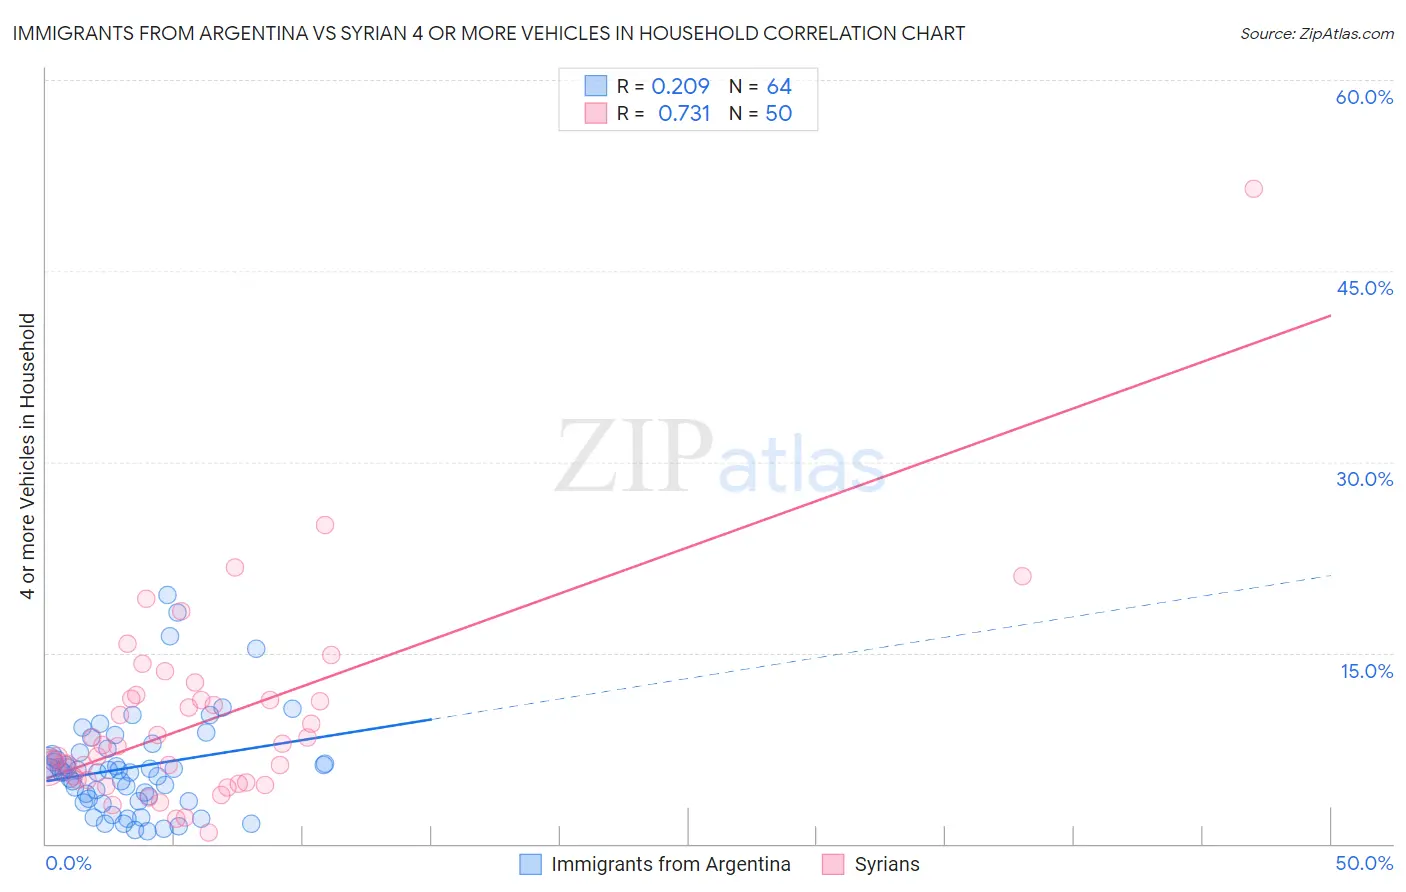
Immigrants from Argentina vs Syrian 4 or more Vehicles in Household Correlation Chart
The statistical analysis conducted on geographies consisting of 263,256,749 people shows a weak positive correlation between the proportion of Immigrants from Argentina and percentage of households with 4 or more vehicles available in the United States with a correlation coefficient (R) of 0.209 and weighted average of 5.9%. Similarly, the statistical analysis conducted on geographies consisting of 265,313,464 people shows a strong positive correlation between the proportion of Syrians and percentage of households with 4 or more vehicles available in the United States with a correlation coefficient (R) of 0.731 and weighted average of 6.3%, a difference of 6.6%.
4 or more Vehicles in Household Correlation Summary
| Measurement | Immigrants from Argentina | Syrian |
| Minimum | 0.94% | 0.87% |
| Maximum | 19.5% | 51.4% |
| Range | 18.6% | 50.6% |
| Mean | 6.0% | 9.8% |
| Median | 5.7% | 7.7% |
| Interquartile 25% (IQ1) | 3.4% | 5.0% |
| Interquartile 75% (IQ3) | 7.1% | 11.4% |
| Interquartile Range (IQR) | 3.6% | 6.4% |
| Standard Deviation (Sample) | 3.9% | 8.1% |
| Standard Deviation (Population) | 3.8% | 8.0% |
Similar Demographics by 4 or more Vehicles in Household
Demographics Similar to Immigrants from Argentina by 4 or more Vehicles in Household
In terms of 4 or more vehicles in household, the demographic groups most similar to Immigrants from Argentina are Sierra Leonean (5.9%, a difference of 0.010%), Immigrants from Switzerland (5.9%, a difference of 0.18%), Immigrants from Malaysia (5.9%, a difference of 0.30%), Eastern European (5.9%, a difference of 0.37%), and Immigrants from Uganda (5.9%, a difference of 0.65%).
| Demographics | Rating | Rank | 4 or more Vehicles in Household |
| Indonesians | 8.9 /100 | #225 | Tragic 6.0% |
| Immigrants | Singapore | 7.9 /100 | #226 | Tragic 5.9% |
| Immigrants | Western Asia | 7.8 /100 | #227 | Tragic 5.9% |
| Immigrants | Uganda | 7.5 /100 | #228 | Tragic 5.9% |
| Eastern Europeans | 6.8 /100 | #229 | Tragic 5.9% |
| Immigrants | Malaysia | 6.7 /100 | #230 | Tragic 5.9% |
| Immigrants | Switzerland | 6.4 /100 | #231 | Tragic 5.9% |
| Immigrants | Argentina | 6.0 /100 | #232 | Tragic 5.9% |
| Sierra Leoneans | 6.0 /100 | #233 | Tragic 5.9% |
| Africans | 4.6 /100 | #234 | Tragic 5.8% |
| Immigrants | Hungary | 4.6 /100 | #235 | Tragic 5.8% |
| Immigrants | Eritrea | 4.5 /100 | #236 | Tragic 5.8% |
| Turks | 4.1 /100 | #237 | Tragic 5.8% |
| Immigrants | Belgium | 4.0 /100 | #238 | Tragic 5.8% |
| Immigrants | Australia | 3.8 /100 | #239 | Tragic 5.8% |
Demographics Similar to Syrians by 4 or more Vehicles in Household
In terms of 4 or more vehicles in household, the demographic groups most similar to Syrians are Yugoslavian (6.3%, a difference of 0.090%), Immigrants from Japan (6.3%, a difference of 0.11%), South American Indian (6.3%, a difference of 0.14%), Belizean (6.3%, a difference of 0.27%), and Immigrants from Burma/Myanmar (6.2%, a difference of 0.48%).
| Demographics | Rating | Rank | 4 or more Vehicles in Household |
| Slovenes | 51.1 /100 | #173 | Average 6.3% |
| Lithuanians | 50.0 /100 | #174 | Average 6.3% |
| Immigrants | Western Europe | 48.8 /100 | #175 | Average 6.3% |
| Ukrainians | 47.6 /100 | #176 | Average 6.3% |
| Slovaks | 46.9 /100 | #177 | Average 6.3% |
| Belizeans | 44.5 /100 | #178 | Average 6.3% |
| Immigrants | Japan | 43.1 /100 | #179 | Average 6.3% |
| Syrians | 42.0 /100 | #180 | Average 6.3% |
| Yugoslavians | 41.1 /100 | #181 | Average 6.3% |
| South American Indians | 40.7 /100 | #182 | Average 6.3% |
| Immigrants | Burma/Myanmar | 37.5 /100 | #183 | Fair 6.2% |
| Iraqis | 37.3 /100 | #184 | Fair 6.2% |
| Thais | 36.9 /100 | #185 | Fair 6.2% |
| Immigrants | Northern Europe | 36.8 /100 | #186 | Fair 6.2% |
| Immigrants | South Africa | 35.4 /100 | #187 | Fair 6.2% |