Thai vs Immigrants from Bahamas 3 or more Vehicles in Household
COMPARE
Thai
Immigrants from Bahamas
3 or more Vehicles in Household
3 or more Vehicles in Household Comparison
Thais
Immigrants from Bahamas
19.8%
3 OR MORE VEHICLES IN HOUSEHOLD
71.1/ 100
METRIC RATING
156th/ 347
METRIC RANK
17.4%
3 OR MORE VEHICLES IN HOUSEHOLD
0.3/ 100
METRIC RATING
278th/ 347
METRIC RANK
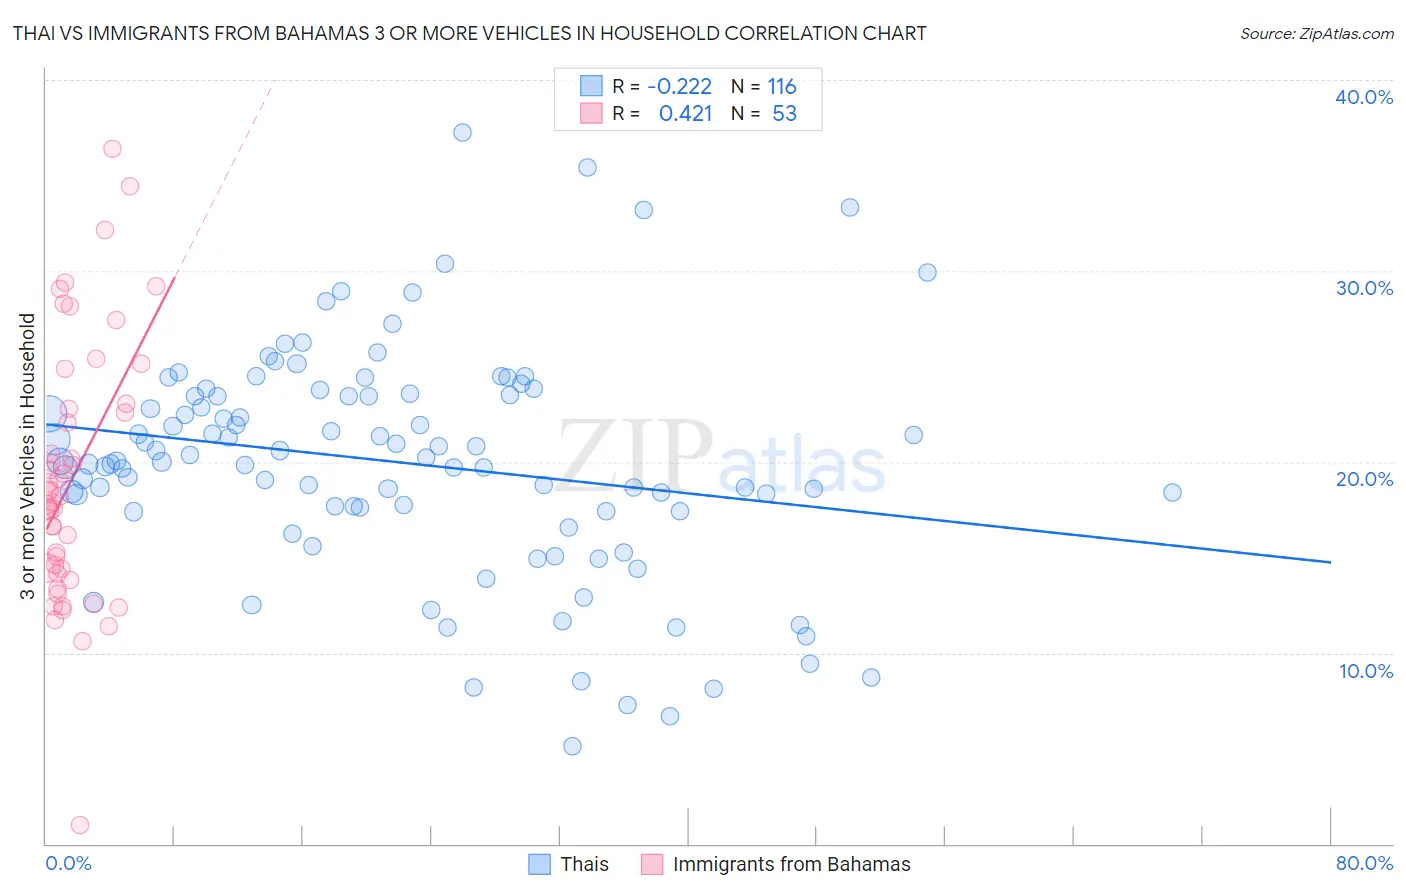
Thai vs Immigrants from Bahamas 3 or more Vehicles in Household Correlation Chart
The statistical analysis conducted on geographies consisting of 475,154,298 people shows a weak negative correlation between the proportion of Thais and percentage of households with 3 or more vehicles available in the United States with a correlation coefficient (R) of -0.222 and weighted average of 19.8%. Similarly, the statistical analysis conducted on geographies consisting of 104,594,814 people shows a moderate positive correlation between the proportion of Immigrants from Bahamas and percentage of households with 3 or more vehicles available in the United States with a correlation coefficient (R) of 0.421 and weighted average of 17.4%, a difference of 13.9%.
3 or more Vehicles in Household Correlation Summary
| Measurement | Thai | Immigrants from Bahamas |
| Minimum | 5.1% | 1.0% |
| Maximum | 37.3% | 36.4% |
| Range | 32.2% | 35.4% |
| Mean | 20.0% | 19.2% |
| Median | 20.0% | 18.2% |
| Interquartile 25% (IQ1) | 17.5% | 14.3% |
| Interquartile 75% (IQ3) | 23.5% | 22.9% |
| Interquartile Range (IQR) | 6.0% | 8.6% |
| Standard Deviation (Sample) | 5.9% | 6.8% |
| Standard Deviation (Population) | 5.9% | 6.7% |
Similar Demographics by 3 or more Vehicles in Household
Demographics Similar to Thais by 3 or more Vehicles in Household
In terms of 3 or more vehicles in household, the demographic groups most similar to Thais are Hungarian (19.8%, a difference of 0.050%), Armenian (19.8%, a difference of 0.20%), Tlingit-Haida (19.9%, a difference of 0.21%), Immigrants from Pakistan (19.8%, a difference of 0.26%), and Immigrants from Lebanon (19.8%, a difference of 0.31%).
| Demographics | Rating | Rank | 3 or more Vehicles in Household |
| Immigrants | Iran | 80.9 /100 | #149 | Excellent 20.0% |
| Immigrants | Immigrants | 80.8 /100 | #150 | Excellent 20.0% |
| Taiwanese | 80.6 /100 | #151 | Excellent 20.0% |
| Lebanese | 79.8 /100 | #152 | Good 20.0% |
| Yuman | 75.6 /100 | #153 | Good 19.9% |
| Immigrants | Jordan | 75.0 /100 | #154 | Good 19.9% |
| Tlingit-Haida | 73.4 /100 | #155 | Good 19.9% |
| Thais | 71.1 /100 | #156 | Good 19.8% |
| Hungarians | 70.5 /100 | #157 | Good 19.8% |
| Armenians | 68.8 /100 | #158 | Good 19.8% |
| Immigrants | Pakistan | 68.2 /100 | #159 | Good 19.8% |
| Immigrants | Lebanon | 67.6 /100 | #160 | Good 19.8% |
| Immigrants | Guatemala | 65.6 /100 | #161 | Good 19.7% |
| Estonians | 63.2 /100 | #162 | Good 19.7% |
| Chileans | 63.0 /100 | #163 | Good 19.7% |
Demographics Similar to Immigrants from Bahamas by 3 or more Vehicles in Household
In terms of 3 or more vehicles in household, the demographic groups most similar to Immigrants from Bahamas are Immigrants from Kazakhstan (17.4%, a difference of 0.010%), Immigrants from Eastern Europe (17.4%, a difference of 0.050%), Brazilian (17.4%, a difference of 0.090%), Immigrants from Latvia (17.4%, a difference of 0.10%), and Okinawan (17.4%, a difference of 0.23%).
| Demographics | Rating | Rank | 3 or more Vehicles in Household |
| South Americans | 0.6 /100 | #271 | Tragic 17.6% |
| Immigrants | Africa | 0.5 /100 | #272 | Tragic 17.6% |
| Immigrants | Sudan | 0.5 /100 | #273 | Tragic 17.6% |
| Immigrants | Bosnia and Herzegovina | 0.5 /100 | #274 | Tragic 17.5% |
| Immigrants | Ukraine | 0.4 /100 | #275 | Tragic 17.5% |
| Okinawans | 0.4 /100 | #276 | Tragic 17.4% |
| Brazilians | 0.4 /100 | #277 | Tragic 17.4% |
| Immigrants | Bahamas | 0.3 /100 | #278 | Tragic 17.4% |
| Immigrants | Kazakhstan | 0.3 /100 | #279 | Tragic 17.4% |
| Immigrants | Eastern Europe | 0.3 /100 | #280 | Tragic 17.4% |
| Immigrants | Latvia | 0.3 /100 | #281 | Tragic 17.4% |
| Immigrants | Ireland | 0.3 /100 | #282 | Tragic 17.3% |
| Blacks/African Americans | 0.3 /100 | #283 | Tragic 17.3% |
| Immigrants | Colombia | 0.3 /100 | #284 | Tragic 17.3% |
| Immigrants | Croatia | 0.2 /100 | #285 | Tragic 17.2% |