Guyanese vs Immigrants from Bahamas 3 or more Vehicles in Household
COMPARE
Guyanese
Immigrants from Bahamas
3 or more Vehicles in Household
3 or more Vehicles in Household Comparison
Guyanese
Immigrants from Bahamas
11.5%
3 OR MORE VEHICLES IN HOUSEHOLD
0.0/ 100
METRIC RATING
341st/ 347
METRIC RANK
17.4%
3 OR MORE VEHICLES IN HOUSEHOLD
0.3/ 100
METRIC RATING
278th/ 347
METRIC RANK
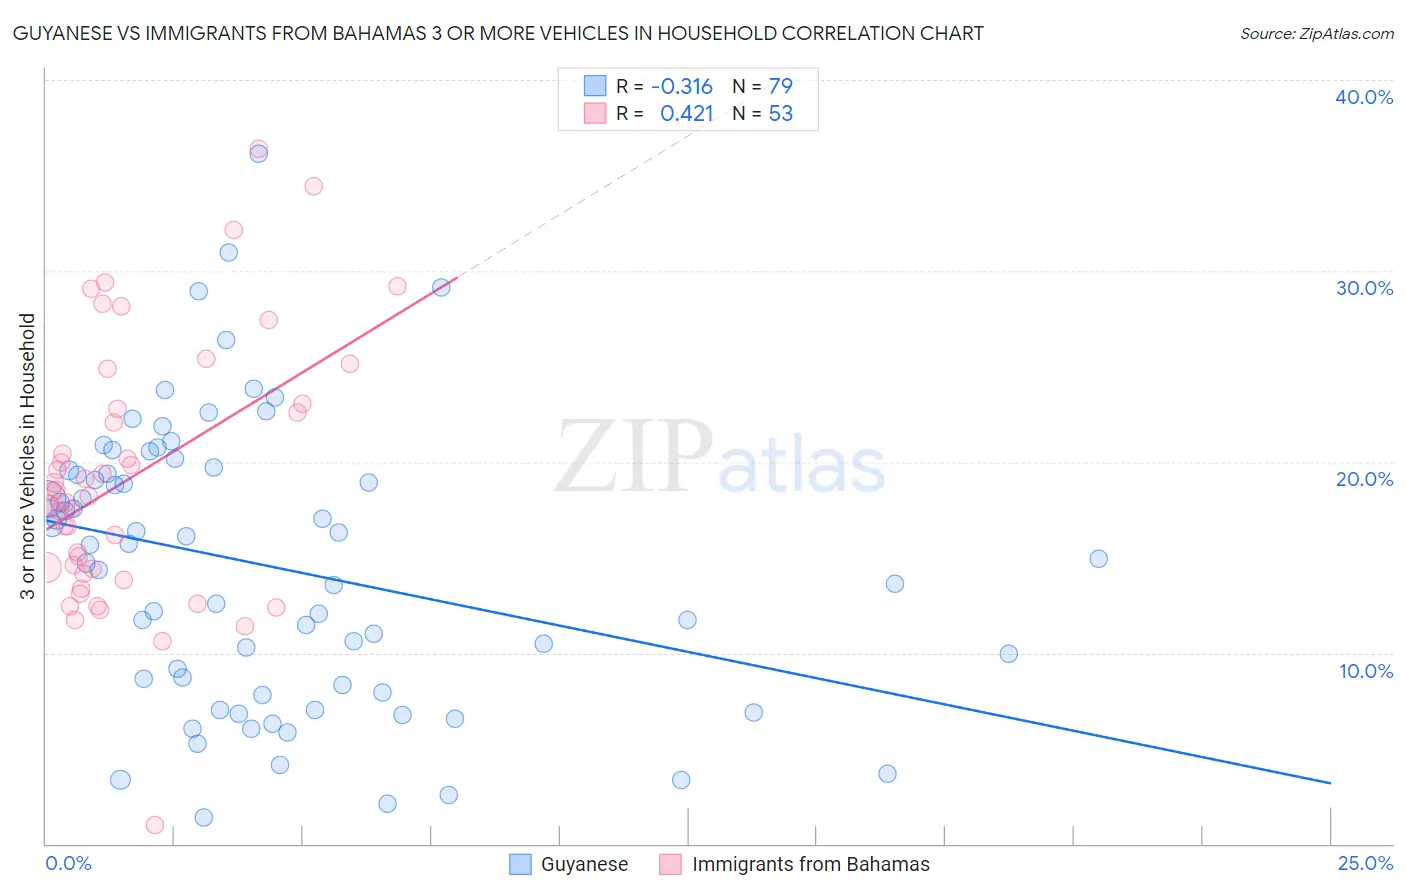
Guyanese vs Immigrants from Bahamas 3 or more Vehicles in Household Correlation Chart
The statistical analysis conducted on geographies consisting of 176,755,882 people shows a mild negative correlation between the proportion of Guyanese and percentage of households with 3 or more vehicles available in the United States with a correlation coefficient (R) of -0.316 and weighted average of 11.5%. Similarly, the statistical analysis conducted on geographies consisting of 104,594,814 people shows a moderate positive correlation between the proportion of Immigrants from Bahamas and percentage of households with 3 or more vehicles available in the United States with a correlation coefficient (R) of 0.421 and weighted average of 17.4%, a difference of 52.0%.
3 or more Vehicles in Household Correlation Summary
| Measurement | Guyanese | Immigrants from Bahamas |
| Minimum | 1.4% | 1.0% |
| Maximum | 36.1% | 36.4% |
| Range | 34.7% | 35.4% |
| Mean | 14.5% | 19.2% |
| Median | 15.0% | 18.2% |
| Interquartile 25% (IQ1) | 7.9% | 14.3% |
| Interquartile 75% (IQ3) | 19.5% | 22.9% |
| Interquartile Range (IQR) | 11.6% | 8.6% |
| Standard Deviation (Sample) | 7.4% | 6.8% |
| Standard Deviation (Population) | 7.4% | 6.7% |
Similar Demographics by 3 or more Vehicles in Household
Demographics Similar to Guyanese by 3 or more Vehicles in Household
In terms of 3 or more vehicles in household, the demographic groups most similar to Guyanese are British West Indian (11.4%, a difference of 0.040%), Immigrants from Guyana (11.2%, a difference of 1.9%), Dominican (11.2%, a difference of 2.0%), Immigrants from Barbados (11.7%, a difference of 2.4%), and Immigrants from Uzbekistan (12.0%, a difference of 4.7%).
| Demographics | Rating | Rank | 3 or more Vehicles in Household |
| Immigrants | Cabo Verde | 0.0 /100 | #333 | Tragic 13.6% |
| Immigrants | Ecuador | 0.0 /100 | #334 | Tragic 13.4% |
| Immigrants | Trinidad and Tobago | 0.0 /100 | #335 | Tragic 13.3% |
| Barbadians | 0.0 /100 | #336 | Tragic 12.6% |
| Immigrants | Bangladesh | 0.0 /100 | #337 | Tragic 12.5% |
| Vietnamese | 0.0 /100 | #338 | Tragic 12.5% |
| Immigrants | Uzbekistan | 0.0 /100 | #339 | Tragic 12.0% |
| Immigrants | Barbados | 0.0 /100 | #340 | Tragic 11.7% |
| Guyanese | 0.0 /100 | #341 | Tragic 11.5% |
| British West Indians | 0.0 /100 | #342 | Tragic 11.4% |
| Immigrants | Guyana | 0.0 /100 | #343 | Tragic 11.2% |
| Dominicans | 0.0 /100 | #344 | Tragic 11.2% |
| Immigrants | Dominican Republic | 0.0 /100 | #345 | Tragic 10.4% |
| Immigrants | St. Vincent and the Grenadines | 0.0 /100 | #346 | Tragic 10.1% |
| Immigrants | Grenada | 0.0 /100 | #347 | Tragic 9.1% |
Demographics Similar to Immigrants from Bahamas by 3 or more Vehicles in Household
In terms of 3 or more vehicles in household, the demographic groups most similar to Immigrants from Bahamas are Immigrants from Kazakhstan (17.4%, a difference of 0.010%), Immigrants from Eastern Europe (17.4%, a difference of 0.050%), Brazilian (17.4%, a difference of 0.090%), Immigrants from Latvia (17.4%, a difference of 0.10%), and Okinawan (17.4%, a difference of 0.23%).
| Demographics | Rating | Rank | 3 or more Vehicles in Household |
| South Americans | 0.6 /100 | #271 | Tragic 17.6% |
| Immigrants | Africa | 0.5 /100 | #272 | Tragic 17.6% |
| Immigrants | Sudan | 0.5 /100 | #273 | Tragic 17.6% |
| Immigrants | Bosnia and Herzegovina | 0.5 /100 | #274 | Tragic 17.5% |
| Immigrants | Ukraine | 0.4 /100 | #275 | Tragic 17.5% |
| Okinawans | 0.4 /100 | #276 | Tragic 17.4% |
| Brazilians | 0.4 /100 | #277 | Tragic 17.4% |
| Immigrants | Bahamas | 0.3 /100 | #278 | Tragic 17.4% |
| Immigrants | Kazakhstan | 0.3 /100 | #279 | Tragic 17.4% |
| Immigrants | Eastern Europe | 0.3 /100 | #280 | Tragic 17.4% |
| Immigrants | Latvia | 0.3 /100 | #281 | Tragic 17.4% |
| Immigrants | Ireland | 0.3 /100 | #282 | Tragic 17.3% |
| Blacks/African Americans | 0.3 /100 | #283 | Tragic 17.3% |
| Immigrants | Colombia | 0.3 /100 | #284 | Tragic 17.3% |
| Immigrants | Croatia | 0.2 /100 | #285 | Tragic 17.2% |