Dutch West Indian vs Immigrants from Switzerland 4 or more Vehicles in Household
COMPARE
Dutch West Indian
Immigrants from Switzerland
4 or more Vehicles in Household
4 or more Vehicles in Household Comparison
Dutch West Indians
Immigrants from Switzerland
7.1%
4 OR MORE VEHICLES IN HOUSEHOLD
99.3/ 100
METRIC RATING
94th/ 347
METRIC RANK
5.9%
4 OR MORE VEHICLES IN HOUSEHOLD
6.4/ 100
METRIC RATING
231st/ 347
METRIC RANK
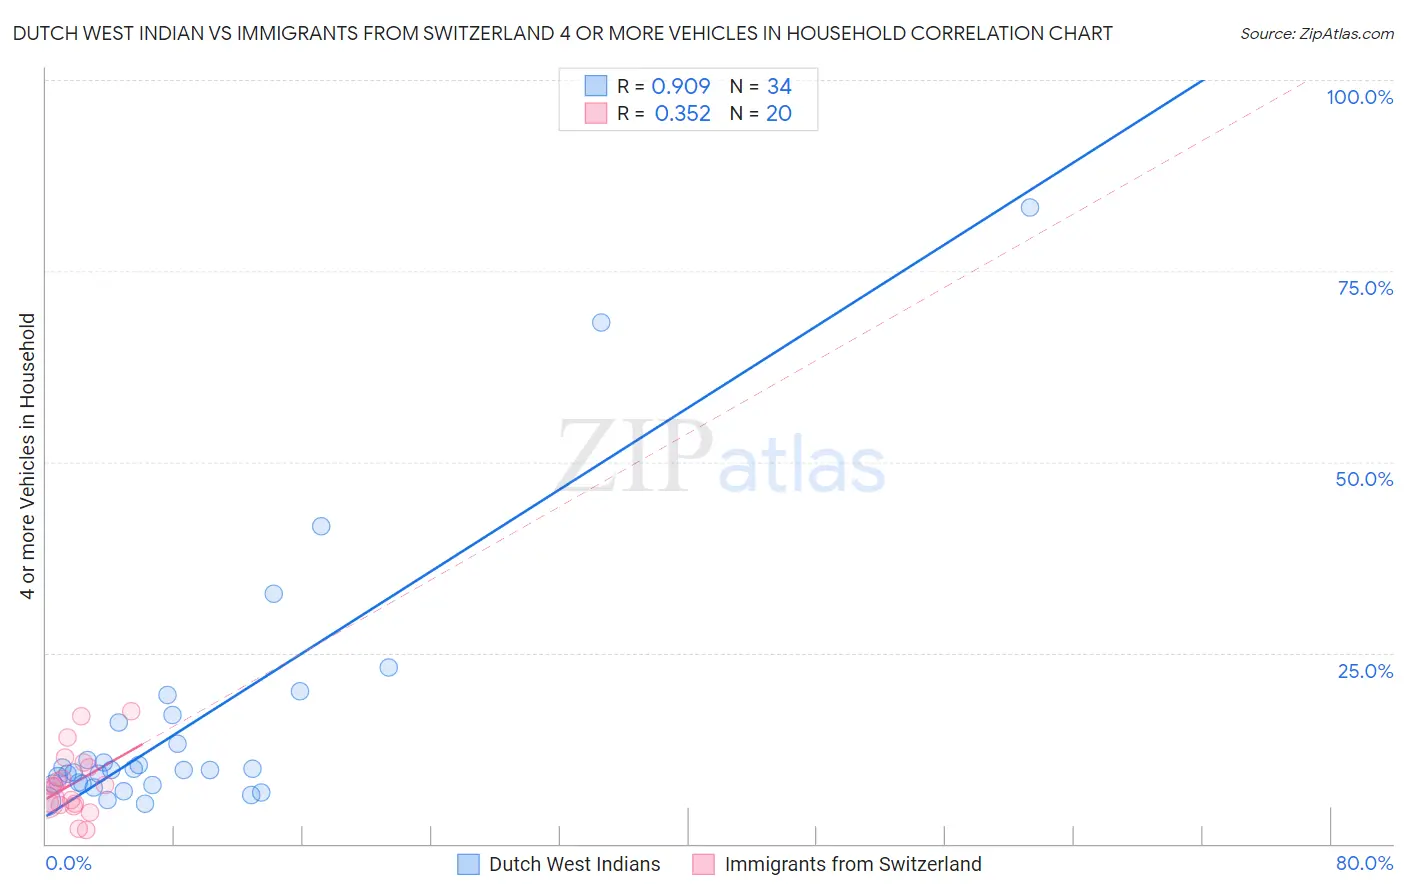
Dutch West Indian vs Immigrants from Switzerland 4 or more Vehicles in Household Correlation Chart
The statistical analysis conducted on geographies consisting of 85,699,538 people shows a near-perfect positive correlation between the proportion of Dutch West Indians and percentage of households with 4 or more vehicles available in the United States with a correlation coefficient (R) of 0.909 and weighted average of 7.1%. Similarly, the statistical analysis conducted on geographies consisting of 147,473,847 people shows a mild positive correlation between the proportion of Immigrants from Switzerland and percentage of households with 4 or more vehicles available in the United States with a correlation coefficient (R) of 0.352 and weighted average of 5.9%, a difference of 20.9%.
4 or more Vehicles in Household Correlation Summary
| Measurement | Dutch West Indian | Immigrants from Switzerland |
| Minimum | 5.3% | 1.8% |
| Maximum | 83.3% | 17.3% |
| Range | 78.0% | 15.5% |
| Mean | 15.8% | 7.9% |
| Median | 9.7% | 7.5% |
| Interquartile 25% (IQ1) | 7.8% | 5.2% |
| Interquartile 75% (IQ3) | 15.8% | 10.3% |
| Interquartile Range (IQR) | 8.0% | 5.1% |
| Standard Deviation (Sample) | 17.2% | 4.3% |
| Standard Deviation (Population) | 16.9% | 4.2% |
Similar Demographics by 4 or more Vehicles in Household
Demographics Similar to Dutch West Indians by 4 or more Vehicles in Household
In terms of 4 or more vehicles in household, the demographic groups most similar to Dutch West Indians are Immigrants from Afghanistan (7.1%, a difference of 0.010%), Immigrants from Latin America (7.1%, a difference of 0.18%), Czechoslovakian (7.1%, a difference of 0.21%), Central American (7.1%, a difference of 0.23%), and Assyrian/Chaldean/Syriac (7.2%, a difference of 0.34%).
| Demographics | Rating | Rank | 4 or more Vehicles in Household |
| Delaware | 99.6 /100 | #87 | Exceptional 7.2% |
| Immigrants | Nonimmigrants | 99.6 /100 | #88 | Exceptional 7.2% |
| British | 99.6 /100 | #89 | Exceptional 7.2% |
| Creek | 99.6 /100 | #90 | Exceptional 7.2% |
| Assyrians/Chaldeans/Syriacs | 99.4 /100 | #91 | Exceptional 7.2% |
| Immigrants | Latin America | 99.4 /100 | #92 | Exceptional 7.1% |
| Immigrants | Afghanistan | 99.3 /100 | #93 | Exceptional 7.1% |
| Dutch West Indians | 99.3 /100 | #94 | Exceptional 7.1% |
| Czechoslovakians | 99.3 /100 | #95 | Exceptional 7.1% |
| Central Americans | 99.3 /100 | #96 | Exceptional 7.1% |
| Celtics | 99.1 /100 | #97 | Exceptional 7.1% |
| Irish | 99.0 /100 | #98 | Exceptional 7.1% |
| Seminole | 98.8 /100 | #99 | Exceptional 7.0% |
| Taiwanese | 98.7 /100 | #100 | Exceptional 7.0% |
| Pakistanis | 98.7 /100 | #101 | Exceptional 7.0% |
Demographics Similar to Immigrants from Switzerland by 4 or more Vehicles in Household
In terms of 4 or more vehicles in household, the demographic groups most similar to Immigrants from Switzerland are Immigrants from Malaysia (5.9%, a difference of 0.12%), Eastern European (5.9%, a difference of 0.18%), Immigrants from Argentina (5.9%, a difference of 0.18%), Sierra Leonean (5.9%, a difference of 0.20%), and Immigrants from Uganda (5.9%, a difference of 0.47%).
| Demographics | Rating | Rank | 4 or more Vehicles in Household |
| Cubans | 9.2 /100 | #224 | Tragic 6.0% |
| Indonesians | 8.9 /100 | #225 | Tragic 6.0% |
| Immigrants | Singapore | 7.9 /100 | #226 | Tragic 5.9% |
| Immigrants | Western Asia | 7.8 /100 | #227 | Tragic 5.9% |
| Immigrants | Uganda | 7.5 /100 | #228 | Tragic 5.9% |
| Eastern Europeans | 6.8 /100 | #229 | Tragic 5.9% |
| Immigrants | Malaysia | 6.7 /100 | #230 | Tragic 5.9% |
| Immigrants | Switzerland | 6.4 /100 | #231 | Tragic 5.9% |
| Immigrants | Argentina | 6.0 /100 | #232 | Tragic 5.9% |
| Sierra Leoneans | 6.0 /100 | #233 | Tragic 5.9% |
| Africans | 4.6 /100 | #234 | Tragic 5.8% |
| Immigrants | Hungary | 4.6 /100 | #235 | Tragic 5.8% |
| Immigrants | Eritrea | 4.5 /100 | #236 | Tragic 5.8% |
| Turks | 4.1 /100 | #237 | Tragic 5.8% |
| Immigrants | Belgium | 4.0 /100 | #238 | Tragic 5.8% |