Taiwanese vs Immigrants from Switzerland Child Poverty Among Boys Under 16
COMPARE
Taiwanese
Immigrants from Switzerland
Child Poverty Among Boys Under 16
Child Poverty Among Boys Under 16 Comparison
Taiwanese
Immigrants from Switzerland
14.8%
CHILD POVERTY AMONG BOYS UNDER 16
97.3/ 100
METRIC RATING
85th/ 347
METRIC RANK
15.0%
CHILD POVERTY AMONG BOYS UNDER 16
95.4/ 100
METRIC RATING
104th/ 347
METRIC RANK
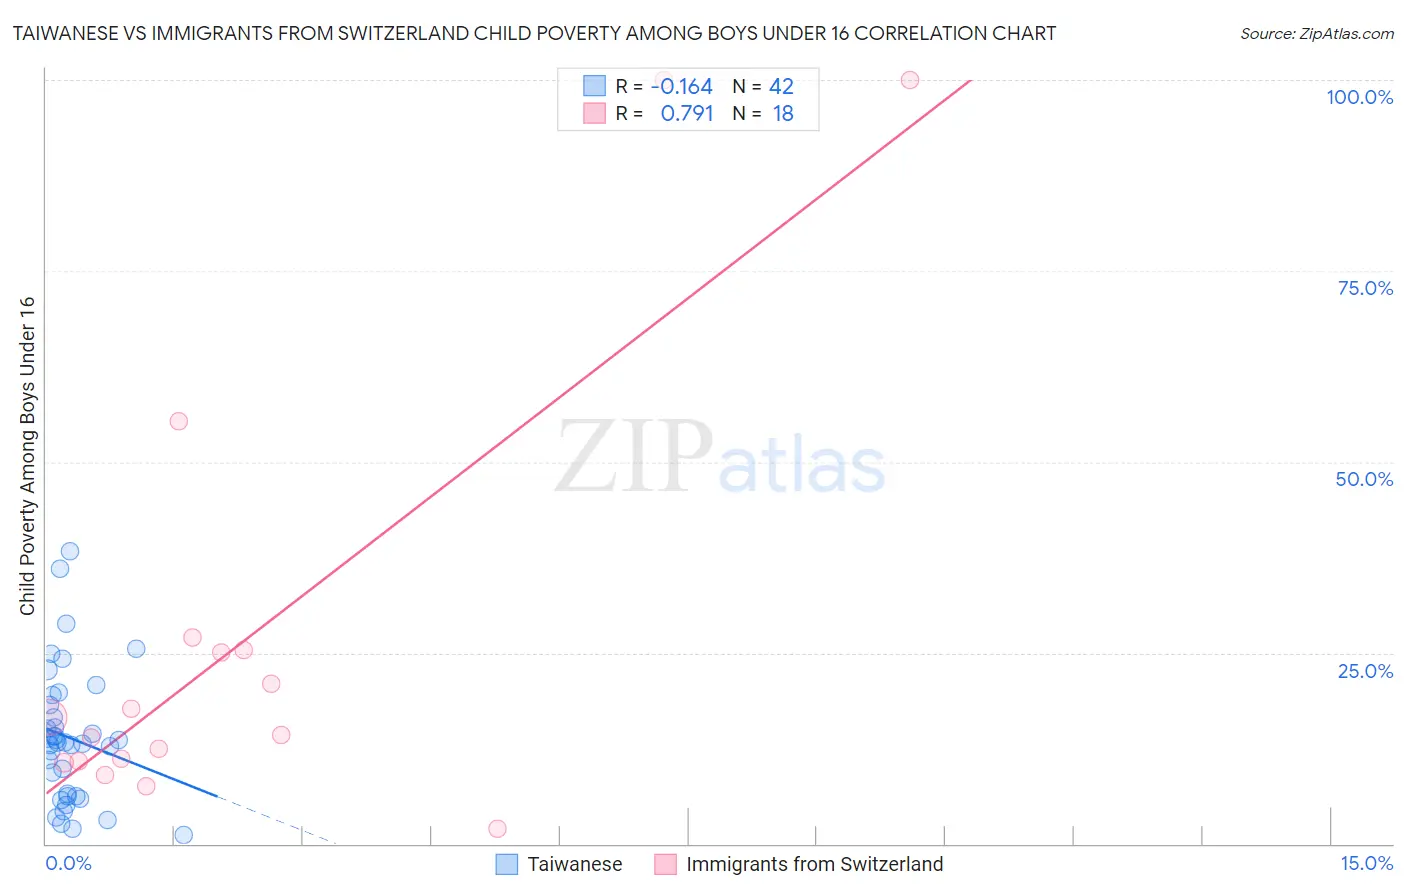
Taiwanese vs Immigrants from Switzerland Child Poverty Among Boys Under 16 Correlation Chart
The statistical analysis conducted on geographies consisting of 31,649,664 people shows a poor negative correlation between the proportion of Taiwanese and poverty level among boys under the age of 16 in the United States with a correlation coefficient (R) of -0.164 and weighted average of 14.8%. Similarly, the statistical analysis conducted on geographies consisting of 146,543,918 people shows a strong positive correlation between the proportion of Immigrants from Switzerland and poverty level among boys under the age of 16 in the United States with a correlation coefficient (R) of 0.791 and weighted average of 15.0%, a difference of 1.7%.
Child Poverty Among Boys Under 16 Correlation Summary
| Measurement | Taiwanese | Immigrants from Switzerland |
| Minimum | 1.1% | 2.0% |
| Maximum | 38.2% | 100.0% |
| Range | 37.2% | 98.0% |
| Mean | 13.8% | 26.6% |
| Median | 13.2% | 15.4% |
| Interquartile 25% (IQ1) | 6.3% | 10.8% |
| Interquartile 75% (IQ3) | 18.1% | 25.4% |
| Interquartile Range (IQR) | 11.8% | 14.6% |
| Standard Deviation (Sample) | 8.7% | 29.1% |
| Standard Deviation (Population) | 8.5% | 28.2% |
Demographics Similar to Taiwanese and Immigrants from Switzerland by Child Poverty Among Boys Under 16
In terms of child poverty among boys under 16, the demographic groups most similar to Taiwanese are Swiss (14.8%, a difference of 0.040%), German (14.8%, a difference of 0.070%), Northern European (14.8%, a difference of 0.12%), Immigrants from North America (14.8%, a difference of 0.13%), and Immigrants from Argentina (14.8%, a difference of 0.21%). Similarly, the demographic groups most similar to Immigrants from Switzerland are Immigrants from Denmark (15.0%, a difference of 0.10%), Romanian (15.0%, a difference of 0.14%), Immigrants from Belarus (15.0%, a difference of 0.21%), Chilean (15.0%, a difference of 0.26%), and Immigrants from France (15.0%, a difference of 0.50%).
| Demographics | Rating | Rank | Child Poverty Among Boys Under 16 |
| Swiss | 97.3 /100 | #84 | Exceptional 14.8% |
| Taiwanese | 97.3 /100 | #85 | Exceptional 14.8% |
| Germans | 97.2 /100 | #86 | Exceptional 14.8% |
| Northern Europeans | 97.2 /100 | #87 | Exceptional 14.8% |
| Immigrants | North America | 97.1 /100 | #88 | Exceptional 14.8% |
| Immigrants | Argentina | 97.1 /100 | #89 | Exceptional 14.8% |
| Austrians | 97.1 /100 | #90 | Exceptional 14.8% |
| Paraguayans | 96.8 /100 | #91 | Exceptional 14.9% |
| Argentineans | 96.7 /100 | #92 | Exceptional 14.9% |
| Sri Lankans | 96.7 /100 | #93 | Exceptional 14.9% |
| Immigrants | Italy | 96.7 /100 | #94 | Exceptional 14.9% |
| Finns | 96.5 /100 | #95 | Exceptional 14.9% |
| Immigrants | North Macedonia | 96.3 /100 | #96 | Exceptional 14.9% |
| Immigrants | Egypt | 96.2 /100 | #97 | Exceptional 14.9% |
| British | 96.2 /100 | #98 | Exceptional 15.0% |
| Immigrants | France | 96.1 /100 | #99 | Exceptional 15.0% |
| Chileans | 95.8 /100 | #100 | Exceptional 15.0% |
| Immigrants | Belarus | 95.7 /100 | #101 | Exceptional 15.0% |
| Romanians | 95.6 /100 | #102 | Exceptional 15.0% |
| Immigrants | Denmark | 95.6 /100 | #103 | Exceptional 15.0% |
| Immigrants | Switzerland | 95.4 /100 | #104 | Exceptional 15.0% |