Syrian vs Immigrants from Belize 4 or more Vehicles in Household
COMPARE
Syrian
Immigrants from Belize
4 or more Vehicles in Household
4 or more Vehicles in Household Comparison
Syrians
Immigrants from Belize
6.3%
4 OR MORE VEHICLES IN HOUSEHOLD
42.0/ 100
METRIC RATING
180th/ 347
METRIC RANK
6.1%
4 OR MORE VEHICLES IN HOUSEHOLD
19.8/ 100
METRIC RATING
204th/ 347
METRIC RANK
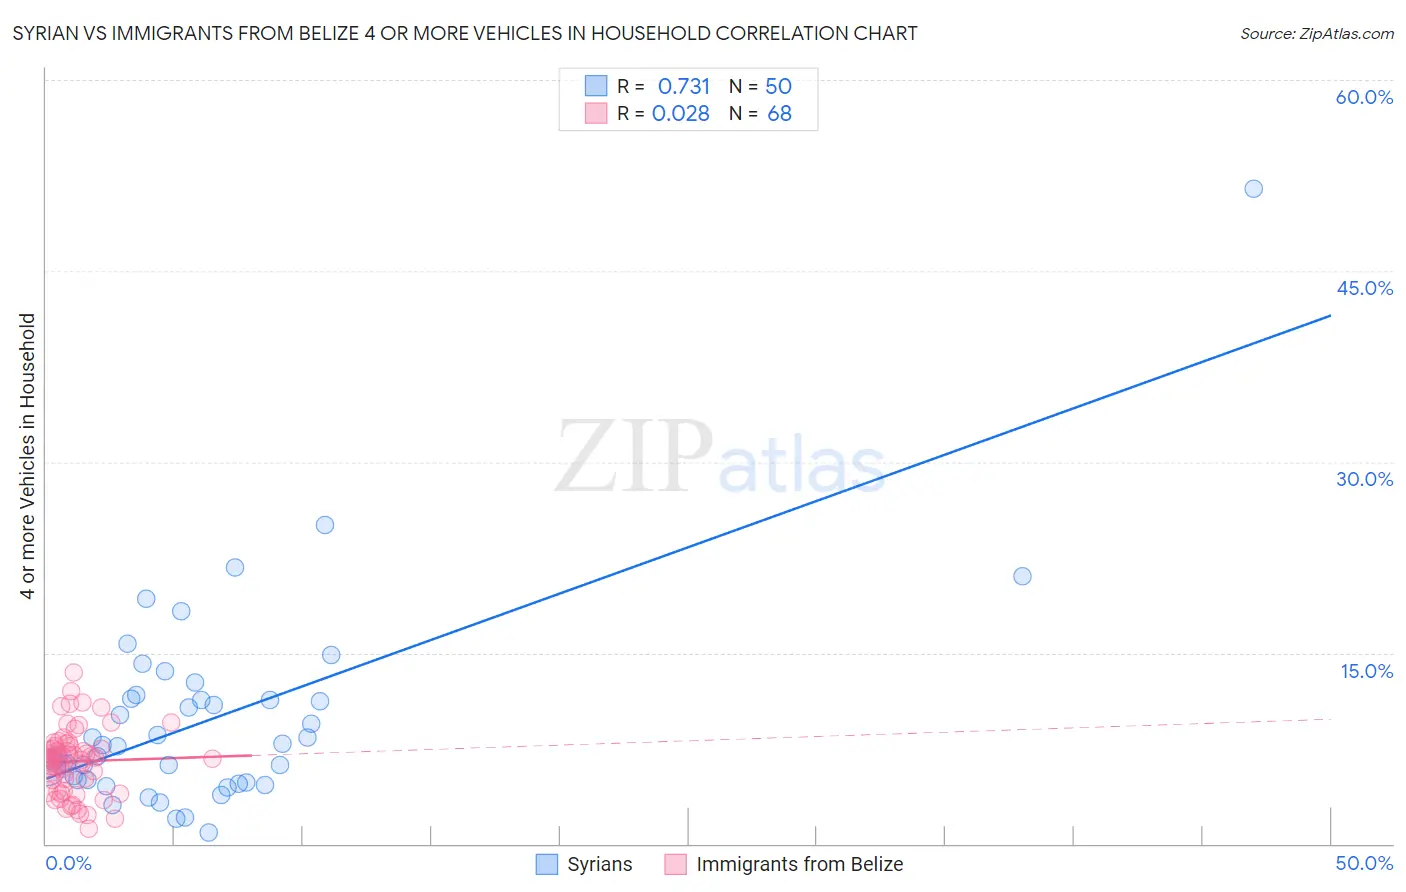
Syrian vs Immigrants from Belize 4 or more Vehicles in Household Correlation Chart
The statistical analysis conducted on geographies consisting of 265,313,464 people shows a strong positive correlation between the proportion of Syrians and percentage of households with 4 or more vehicles available in the United States with a correlation coefficient (R) of 0.731 and weighted average of 6.3%. Similarly, the statistical analysis conducted on geographies consisting of 129,765,587 people shows no correlation between the proportion of Immigrants from Belize and percentage of households with 4 or more vehicles available in the United States with a correlation coefficient (R) of 0.028 and weighted average of 6.1%, a difference of 2.8%.
4 or more Vehicles in Household Correlation Summary
| Measurement | Syrian | Immigrants from Belize |
| Minimum | 0.87% | 1.2% |
| Maximum | 51.4% | 13.4% |
| Range | 50.6% | 12.3% |
| Mean | 9.8% | 6.5% |
| Median | 7.7% | 6.8% |
| Interquartile 25% (IQ1) | 5.0% | 4.6% |
| Interquartile 75% (IQ3) | 11.4% | 7.6% |
| Interquartile Range (IQR) | 6.4% | 3.0% |
| Standard Deviation (Sample) | 8.1% | 2.5% |
| Standard Deviation (Population) | 8.0% | 2.5% |
Similar Demographics by 4 or more Vehicles in Household
Demographics Similar to Syrians by 4 or more Vehicles in Household
In terms of 4 or more vehicles in household, the demographic groups most similar to Syrians are Yugoslavian (6.3%, a difference of 0.090%), Immigrants from Japan (6.3%, a difference of 0.11%), South American Indian (6.3%, a difference of 0.14%), Belizean (6.3%, a difference of 0.27%), and Immigrants from Burma/Myanmar (6.2%, a difference of 0.48%).
| Demographics | Rating | Rank | 4 or more Vehicles in Household |
| Slovenes | 51.1 /100 | #173 | Average 6.3% |
| Lithuanians | 50.0 /100 | #174 | Average 6.3% |
| Immigrants | Western Europe | 48.8 /100 | #175 | Average 6.3% |
| Ukrainians | 47.6 /100 | #176 | Average 6.3% |
| Slovaks | 46.9 /100 | #177 | Average 6.3% |
| Belizeans | 44.5 /100 | #178 | Average 6.3% |
| Immigrants | Japan | 43.1 /100 | #179 | Average 6.3% |
| Syrians | 42.0 /100 | #180 | Average 6.3% |
| Yugoslavians | 41.1 /100 | #181 | Average 6.3% |
| South American Indians | 40.7 /100 | #182 | Average 6.3% |
| Immigrants | Burma/Myanmar | 37.5 /100 | #183 | Fair 6.2% |
| Iraqis | 37.3 /100 | #184 | Fair 6.2% |
| Thais | 36.9 /100 | #185 | Fair 6.2% |
| Immigrants | Northern Europe | 36.8 /100 | #186 | Fair 6.2% |
| Immigrants | South Africa | 35.4 /100 | #187 | Fair 6.2% |
Demographics Similar to Immigrants from Belize by 4 or more Vehicles in Household
In terms of 4 or more vehicles in household, the demographic groups most similar to Immigrants from Belize are Honduran (6.1%, a difference of 0.090%), Immigrants from Sierra Leone (6.1%, a difference of 0.10%), Kenyan (6.1%, a difference of 0.23%), Immigrants from South Central Asia (6.1%, a difference of 0.24%), and Egyptian (6.1%, a difference of 0.25%).
| Demographics | Rating | Rank | 4 or more Vehicles in Household |
| Immigrants | Sri Lanka | 23.7 /100 | #197 | Fair 6.1% |
| Immigrants | Portugal | 22.3 /100 | #198 | Fair 6.1% |
| Immigrants | Norway | 21.8 /100 | #199 | Fair 6.1% |
| Latvians | 21.7 /100 | #200 | Fair 6.1% |
| Egyptians | 21.4 /100 | #201 | Fair 6.1% |
| Immigrants | South Central Asia | 21.3 /100 | #202 | Fair 6.1% |
| Immigrants | Sierra Leone | 20.5 /100 | #203 | Fair 6.1% |
| Immigrants | Belize | 19.8 /100 | #204 | Poor 6.1% |
| Hondurans | 19.3 /100 | #205 | Poor 6.1% |
| Kenyans | 18.5 /100 | #206 | Poor 6.1% |
| Immigrants | Chile | 16.9 /100 | #207 | Poor 6.1% |
| Immigrants | Nigeria | 15.6 /100 | #208 | Poor 6.1% |
| Immigrants | Honduras | 15.4 /100 | #209 | Poor 6.1% |
| Immigrants | Zimbabwe | 15.1 /100 | #210 | Poor 6.0% |
| Panamanians | 14.8 /100 | #211 | Poor 6.0% |