Syrian vs Immigrants from Senegal In Labor Force | Age 25-29
COMPARE
Syrian
Immigrants from Senegal
In Labor Force | Age 25-29
In Labor Force | Age 25-29 Comparison
Syrians
Immigrants from Senegal
84.8%
IN LABOR FORCE | AGE 25-29
76.5/ 100
METRIC RATING
134th/ 347
METRIC RANK
84.8%
IN LABOR FORCE | AGE 25-29
68.3/ 100
METRIC RATING
145th/ 347
METRIC RANK
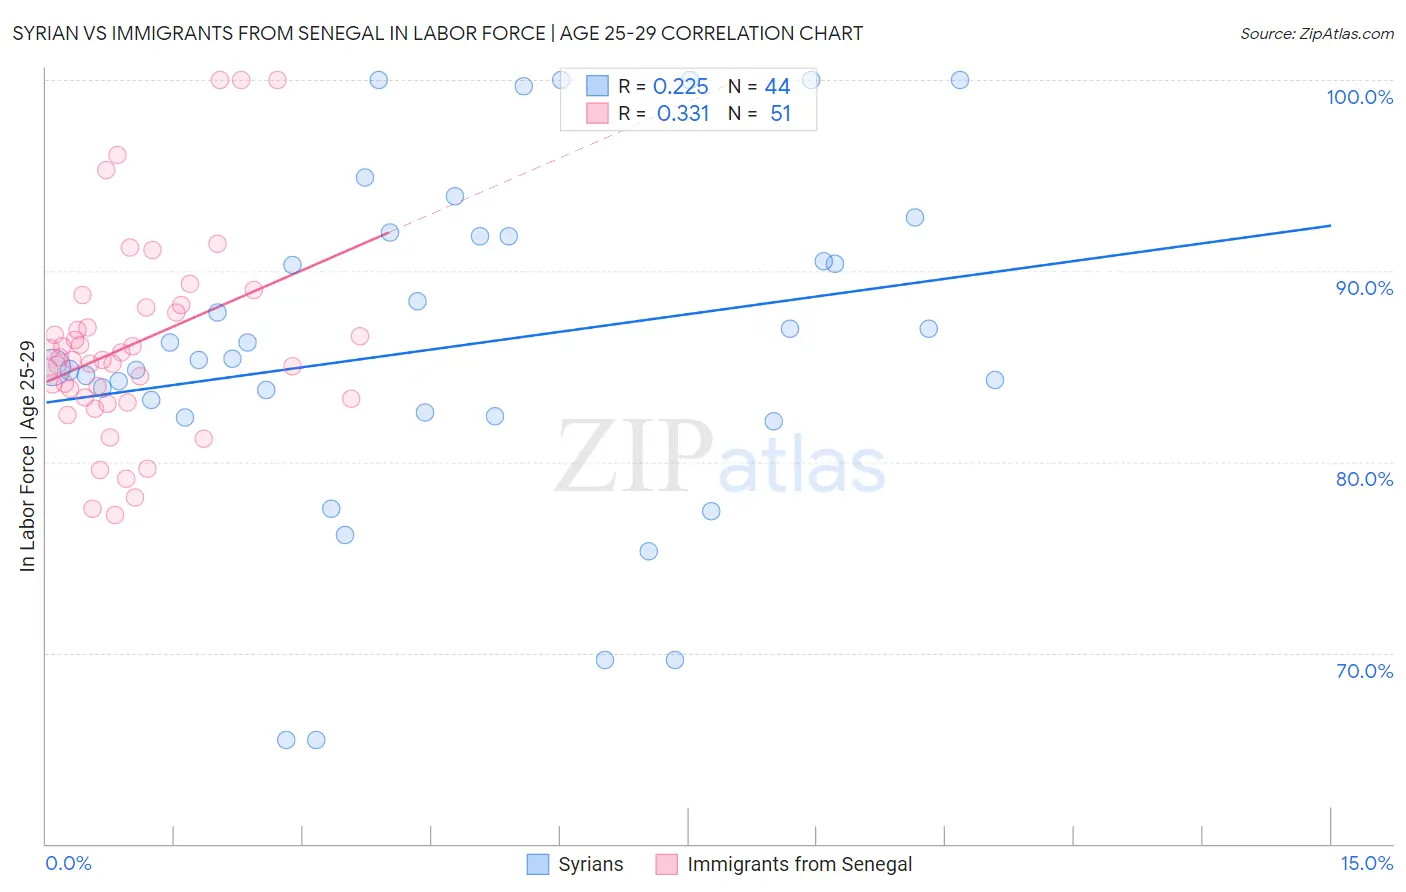
Syrian vs Immigrants from Senegal In Labor Force | Age 25-29 Correlation Chart
The statistical analysis conducted on geographies consisting of 266,239,805 people shows a weak positive correlation between the proportion of Syrians and labor force participation rate among population between the ages 25 and 29 in the United States with a correlation coefficient (R) of 0.225 and weighted average of 84.8%. Similarly, the statistical analysis conducted on geographies consisting of 90,123,722 people shows a mild positive correlation between the proportion of Immigrants from Senegal and labor force participation rate among population between the ages 25 and 29 in the United States with a correlation coefficient (R) of 0.331 and weighted average of 84.8%, a difference of 0.080%.
In Labor Force | Age 25-29 Correlation Summary
| Measurement | Syrian | Immigrants from Senegal |
| Minimum | 65.4% | 77.2% |
| Maximum | 100.0% | 100.0% |
| Range | 34.6% | 22.8% |
| Mean | 86.0% | 86.1% |
| Median | 85.4% | 85.4% |
| Interquartile 25% (IQ1) | 82.5% | 83.3% |
| Interquartile 75% (IQ3) | 91.8% | 88.1% |
| Interquartile Range (IQR) | 9.3% | 4.8% |
| Standard Deviation (Sample) | 8.8% | 5.2% |
| Standard Deviation (Population) | 8.7% | 5.2% |
Demographics Similar to Syrians and Immigrants from Senegal by In Labor Force | Age 25-29
In terms of in labor force | age 25-29, the demographic groups most similar to Syrians are Immigrants from Hungary (84.8%, a difference of 0.0%), Romanian (84.8%, a difference of 0.010%), Asian (84.8%, a difference of 0.010%), Bhutanese (84.8%, a difference of 0.010%), and Iranian (84.8%, a difference of 0.020%). Similarly, the demographic groups most similar to Immigrants from Senegal are Icelander (84.8%, a difference of 0.0%), Immigrants from Asia (84.8%, a difference of 0.0%), Pakistani (84.8%, a difference of 0.010%), Sri Lankan (84.8%, a difference of 0.010%), and Immigrants from Laos (84.8%, a difference of 0.010%).
| Demographics | Rating | Rank | In Labor Force | Age 25-29 |
| Immigrants | Russia | 81.6 /100 | #129 | Excellent 84.9% |
| Northern Europeans | 81.3 /100 | #130 | Excellent 84.9% |
| Iranians | 78.1 /100 | #131 | Good 84.8% |
| Romanians | 77.7 /100 | #132 | Good 84.8% |
| Asians | 77.7 /100 | #133 | Good 84.8% |
| Syrians | 76.5 /100 | #134 | Good 84.8% |
| Immigrants | Hungary | 76.4 /100 | #135 | Good 84.8% |
| Bhutanese | 76.0 /100 | #136 | Good 84.8% |
| Immigrants | Canada | 73.5 /100 | #137 | Good 84.8% |
| Armenians | 72.7 /100 | #138 | Good 84.8% |
| Immigrants | Eastern Asia | 72.6 /100 | #139 | Good 84.8% |
| Immigrants | North America | 72.1 /100 | #140 | Good 84.8% |
| Danes | 71.9 /100 | #141 | Good 84.8% |
| Pakistanis | 70.0 /100 | #142 | Good 84.8% |
| Sri Lankans | 69.2 /100 | #143 | Good 84.8% |
| Immigrants | Laos | 69.0 /100 | #144 | Good 84.8% |
| Immigrants | Senegal | 68.3 /100 | #145 | Good 84.8% |
| Icelanders | 68.2 /100 | #146 | Good 84.8% |
| Immigrants | Asia | 68.2 /100 | #147 | Good 84.8% |
| Immigrants | England | 65.2 /100 | #148 | Good 84.7% |
| Peruvians | 64.7 /100 | #149 | Good 84.7% |