Immigrants from Armenia vs Immigrants from Sweden 4 or more Vehicles in Household
COMPARE
Immigrants from Armenia
Immigrants from Sweden
4 or more Vehicles in Household
4 or more Vehicles in Household Comparison
Immigrants from Armenia
Immigrants from Sweden
6.5%
4 OR MORE VEHICLES IN HOUSEHOLD
71.2/ 100
METRIC RATING
153rd/ 347
METRIC RANK
6.2%
4 OR MORE VEHICLES IN HOUSEHOLD
27.0/ 100
METRIC RATING
194th/ 347
METRIC RANK
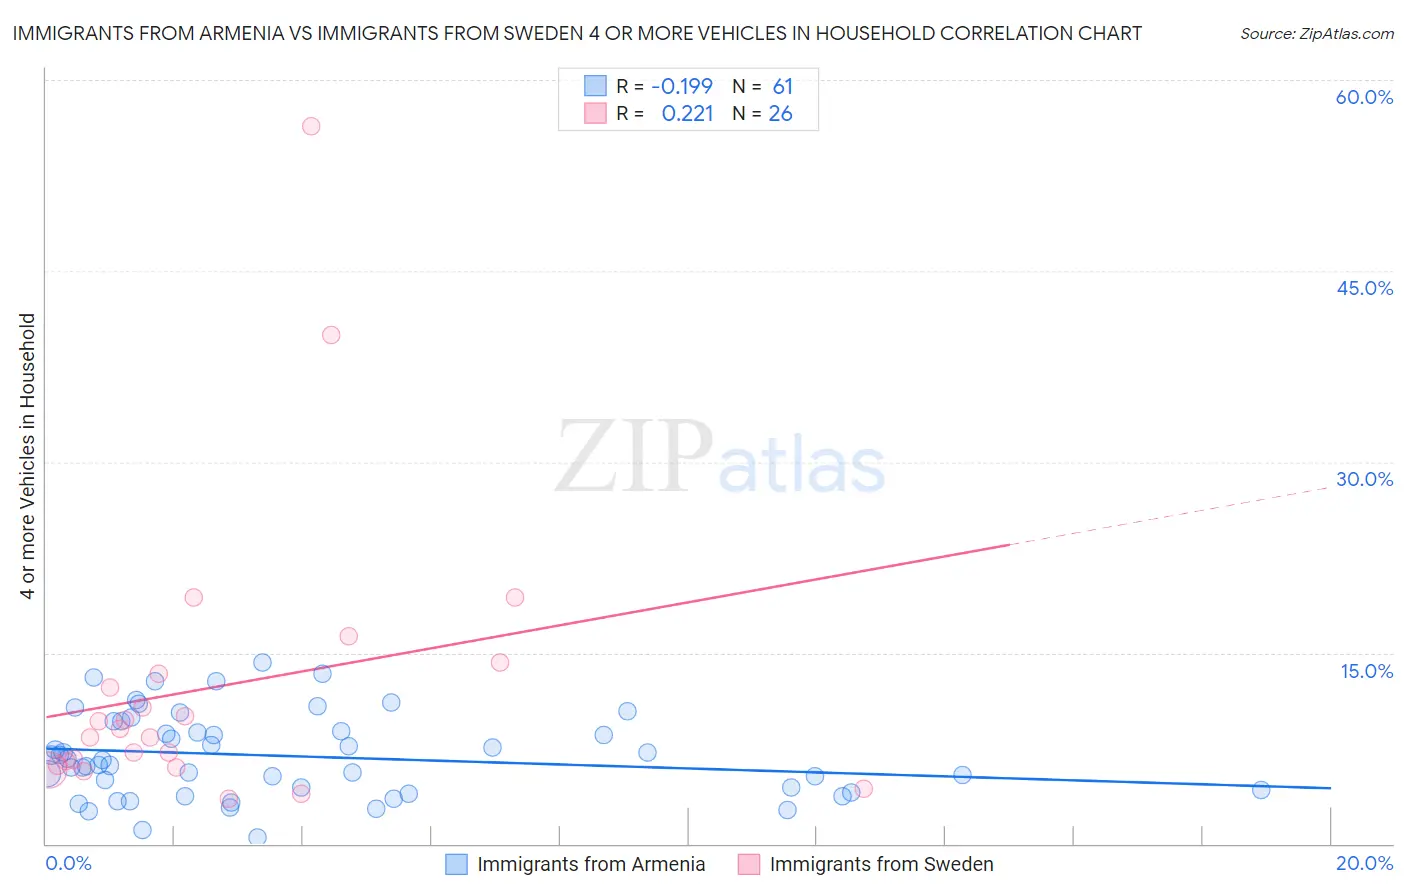
Immigrants from Armenia vs Immigrants from Sweden 4 or more Vehicles in Household Correlation Chart
The statistical analysis conducted on geographies consisting of 97,454,619 people shows a poor negative correlation between the proportion of Immigrants from Armenia and percentage of households with 4 or more vehicles available in the United States with a correlation coefficient (R) of -0.199 and weighted average of 6.5%. Similarly, the statistical analysis conducted on geographies consisting of 163,976,202 people shows a weak positive correlation between the proportion of Immigrants from Sweden and percentage of households with 4 or more vehicles available in the United States with a correlation coefficient (R) of 0.221 and weighted average of 6.2%, a difference of 4.9%.
4 or more Vehicles in Household Correlation Summary
| Measurement | Immigrants from Armenia | Immigrants from Sweden |
| Minimum | 0.45% | 3.6% |
| Maximum | 14.3% | 56.4% |
| Range | 13.8% | 52.8% |
| Mean | 6.9% | 12.3% |
| Median | 6.6% | 8.7% |
| Interquartile 25% (IQ1) | 4.1% | 6.2% |
| Interquartile 75% (IQ3) | 9.2% | 13.4% |
| Interquartile Range (IQR) | 5.1% | 7.2% |
| Standard Deviation (Sample) | 3.3% | 11.6% |
| Standard Deviation (Population) | 3.2% | 11.4% |
Similar Demographics by 4 or more Vehicles in Household
Demographics Similar to Immigrants from Armenia by 4 or more Vehicles in Household
In terms of 4 or more vehicles in household, the demographic groups most similar to Immigrants from Armenia are Central American Indian (6.5%, a difference of 0.010%), Iroquois (6.5%, a difference of 0.090%), Yuman (6.5%, a difference of 0.11%), Immigrants from Hong Kong (6.5%, a difference of 0.13%), and Iranian (6.5%, a difference of 0.16%).
| Demographics | Rating | Rank | 4 or more Vehicles in Household |
| Immigrants | Costa Rica | 74.4 /100 | #146 | Good 6.5% |
| Immigrants | Iran | 73.9 /100 | #147 | Good 6.5% |
| Immigrants | Jordan | 73.7 /100 | #148 | Good 6.5% |
| Greeks | 73.6 /100 | #149 | Good 6.5% |
| New Zealanders | 73.3 /100 | #150 | Good 6.5% |
| Immigrants | Hong Kong | 72.2 /100 | #151 | Good 6.5% |
| Yuman | 72.1 /100 | #152 | Good 6.5% |
| Immigrants | Armenia | 71.2 /100 | #153 | Good 6.5% |
| Central American Indians | 71.1 /100 | #154 | Good 6.5% |
| Iroquois | 70.4 /100 | #155 | Good 6.5% |
| Iranians | 69.9 /100 | #156 | Good 6.5% |
| Peruvians | 69.4 /100 | #157 | Good 6.5% |
| Zimbabweans | 67.1 /100 | #158 | Good 6.4% |
| Indians (Asian) | 66.3 /100 | #159 | Good 6.4% |
| Palestinians | 65.8 /100 | #160 | Good 6.4% |
Demographics Similar to Immigrants from Sweden by 4 or more Vehicles in Household
In terms of 4 or more vehicles in household, the demographic groups most similar to Immigrants from Sweden are Argentinean (6.2%, a difference of 0.0%), Tsimshian (6.2%, a difference of 0.070%), Immigrants from Kuwait (6.2%, a difference of 0.13%), Immigrants from Sri Lanka (6.1%, a difference of 0.45%), and Romanian (6.2%, a difference of 0.47%).
| Demographics | Rating | Rank | 4 or more Vehicles in Household |
| Immigrants | South Africa | 35.4 /100 | #187 | Fair 6.2% |
| Kiowa | 34.7 /100 | #188 | Fair 6.2% |
| Immigrants | Eastern Asia | 33.3 /100 | #189 | Fair 6.2% |
| South Africans | 32.2 /100 | #190 | Fair 6.2% |
| Inupiat | 30.7 /100 | #191 | Fair 6.2% |
| Romanians | 30.7 /100 | #192 | Fair 6.2% |
| Immigrants | Kuwait | 28.0 /100 | #193 | Fair 6.2% |
| Immigrants | Sweden | 27.0 /100 | #194 | Fair 6.2% |
| Argentineans | 27.0 /100 | #195 | Fair 6.2% |
| Tsimshian | 26.4 /100 | #196 | Fair 6.2% |
| Immigrants | Sri Lanka | 23.7 /100 | #197 | Fair 6.1% |
| Immigrants | Portugal | 22.3 /100 | #198 | Fair 6.1% |
| Immigrants | Norway | 21.8 /100 | #199 | Fair 6.1% |
| Latvians | 21.7 /100 | #200 | Fair 6.1% |
| Egyptians | 21.4 /100 | #201 | Fair 6.1% |