Spanish American Indian vs Immigrants from Cambodia 2 or more Vehicles in Household
COMPARE
Spanish American Indian
Immigrants from Cambodia
2 or more Vehicles in Household
2 or more Vehicles in Household Comparison
Spanish American Indians
Immigrants from Cambodia
60.3%
2 OR MORE VEHICLES IN HOUSEHOLD
100.0/ 100
METRIC RATING
31st/ 347
METRIC RANK
56.2%
2 OR MORE VEHICLES IN HOUSEHOLD
83.6/ 100
METRIC RATING
141st/ 347
METRIC RANK
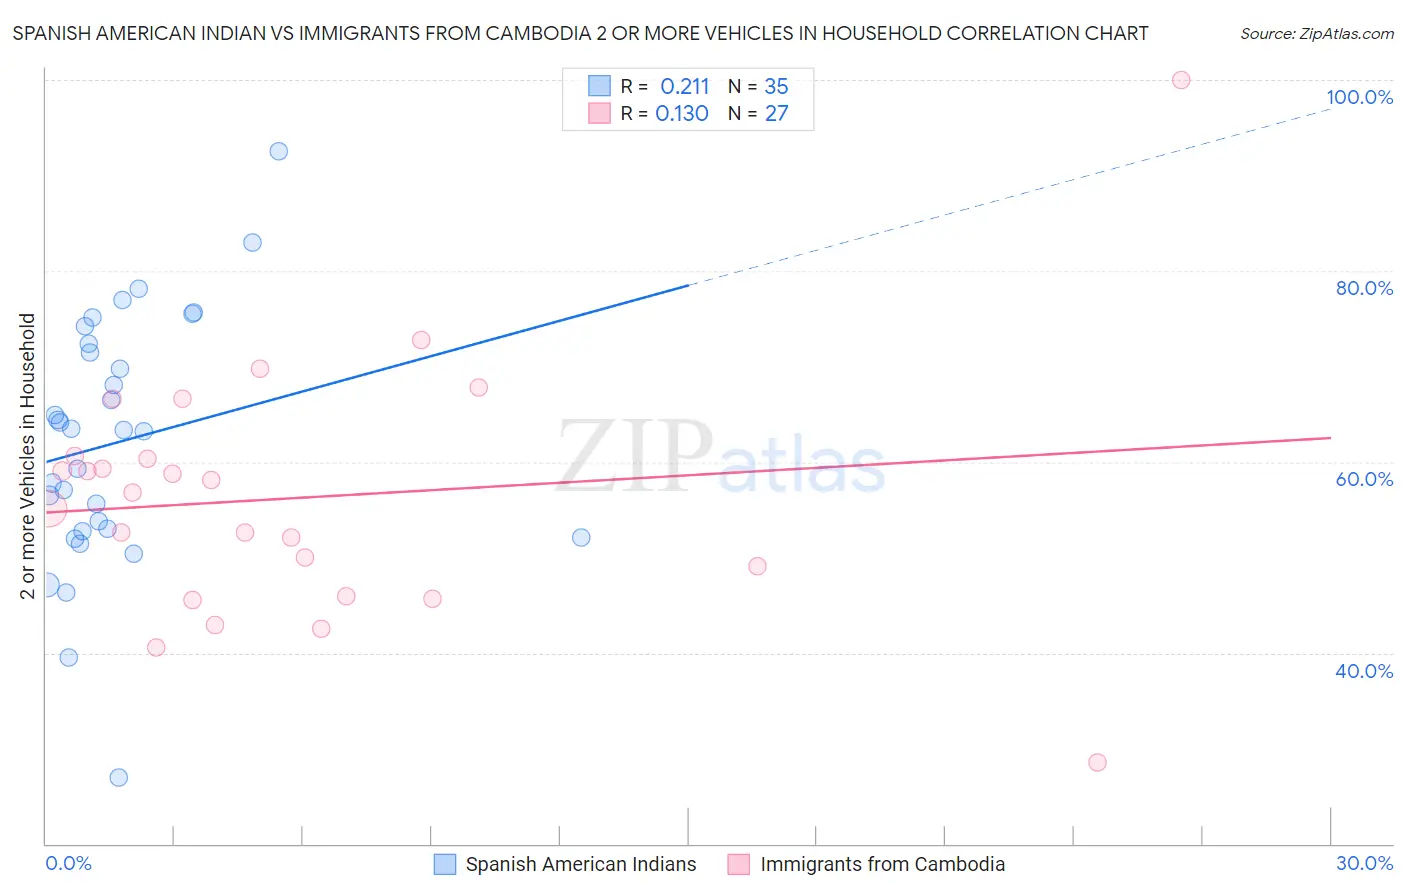
Spanish American Indian vs Immigrants from Cambodia 2 or more Vehicles in Household Correlation Chart
The statistical analysis conducted on geographies consisting of 73,145,550 people shows a weak positive correlation between the proportion of Spanish American Indians and percentage of households with 2 or more vehicles available in the United States with a correlation coefficient (R) of 0.211 and weighted average of 60.3%. Similarly, the statistical analysis conducted on geographies consisting of 205,137,461 people shows a poor positive correlation between the proportion of Immigrants from Cambodia and percentage of households with 2 or more vehicles available in the United States with a correlation coefficient (R) of 0.130 and weighted average of 56.2%, a difference of 7.2%.
2 or more Vehicles in Household Correlation Summary
| Measurement | Spanish American Indian | Immigrants from Cambodia |
| Minimum | 27.0% | 28.6% |
| Maximum | 92.6% | 100.0% |
| Range | 65.6% | 71.4% |
| Mean | 62.1% | 56.3% |
| Median | 63.3% | 56.8% |
| Interquartile 25% (IQ1) | 52.7% | 46.0% |
| Interquartile 75% (IQ3) | 72.3% | 60.7% |
| Interquartile Range (IQR) | 19.7% | 14.7% |
| Standard Deviation (Sample) | 13.2% | 13.4% |
| Standard Deviation (Population) | 13.0% | 13.1% |
Similar Demographics by 2 or more Vehicles in Household
Demographics Similar to Spanish American Indians by 2 or more Vehicles in Household
In terms of 2 or more vehicles in household, the demographic groups most similar to Spanish American Indians are Finnish (60.3%, a difference of 0.030%), Arapaho (60.2%, a difference of 0.11%), Hawaiian (60.4%, a difference of 0.16%), Immigrants from Mexico (60.2%, a difference of 0.16%), and Spanish (60.2%, a difference of 0.22%).
| Demographics | Rating | Rank | 2 or more Vehicles in Household |
| Immigrants | Vietnam | 100.0 /100 | #24 | Exceptional 60.9% |
| Whites/Caucasians | 100.0 /100 | #25 | Exceptional 60.8% |
| Welsh | 100.0 /100 | #26 | Exceptional 60.8% |
| Assyrians/Chaldeans/Syriacs | 100.0 /100 | #27 | Exceptional 60.5% |
| Guamanians/Chamorros | 100.0 /100 | #28 | Exceptional 60.5% |
| Hawaiians | 100.0 /100 | #29 | Exceptional 60.4% |
| Finns | 100.0 /100 | #30 | Exceptional 60.3% |
| Spanish American Indians | 100.0 /100 | #31 | Exceptional 60.3% |
| Arapaho | 100.0 /100 | #32 | Exceptional 60.2% |
| Immigrants | Mexico | 100.0 /100 | #33 | Exceptional 60.2% |
| Spanish | 100.0 /100 | #34 | Exceptional 60.2% |
| Immigrants | Philippines | 100.0 /100 | #35 | Exceptional 60.1% |
| Chinese | 100.0 /100 | #36 | Exceptional 60.1% |
| Irish | 100.0 /100 | #37 | Exceptional 60.1% |
| Americans | 100.0 /100 | #38 | Exceptional 60.0% |
Demographics Similar to Immigrants from Cambodia by 2 or more Vehicles in Household
In terms of 2 or more vehicles in household, the demographic groups most similar to Immigrants from Cambodia are Latvian (56.2%, a difference of 0.0%), South African (56.2%, a difference of 0.040%), Armenian (56.3%, a difference of 0.050%), Salvadoran (56.3%, a difference of 0.080%), and Cuban (56.3%, a difference of 0.090%).
| Demographics | Rating | Rank | 2 or more Vehicles in Household |
| Immigrants | Azores | 86.6 /100 | #134 | Excellent 56.4% |
| Blackfeet | 86.5 /100 | #135 | Excellent 56.4% |
| Immigrants | Asia | 86.0 /100 | #136 | Excellent 56.3% |
| Cubans | 84.8 /100 | #137 | Excellent 56.3% |
| Salvadorans | 84.7 /100 | #138 | Excellent 56.3% |
| Armenians | 84.3 /100 | #139 | Excellent 56.3% |
| Latvians | 83.6 /100 | #140 | Excellent 56.2% |
| Immigrants | Cambodia | 83.6 /100 | #141 | Excellent 56.2% |
| South Africans | 83.1 /100 | #142 | Excellent 56.2% |
| Seminole | 81.7 /100 | #143 | Excellent 56.2% |
| Immigrants | Syria | 81.4 /100 | #144 | Excellent 56.2% |
| Syrians | 81.2 /100 | #145 | Excellent 56.2% |
| Venezuelans | 80.7 /100 | #146 | Excellent 56.1% |
| Serbians | 80.3 /100 | #147 | Excellent 56.1% |
| Immigrants | Moldova | 80.2 /100 | #148 | Excellent 56.1% |