Soviet Union vs Thai 4 or more Vehicles in Household
COMPARE
Soviet Union
Thai
4 or more Vehicles in Household
4 or more Vehicles in Household Comparison
Soviet Union
Thais
4.4%
4 OR MORE VEHICLES IN HOUSEHOLD
0.0/ 100
METRIC RATING
324th/ 347
METRIC RANK
6.2%
4 OR MORE VEHICLES IN HOUSEHOLD
36.9/ 100
METRIC RATING
185th/ 347
METRIC RANK
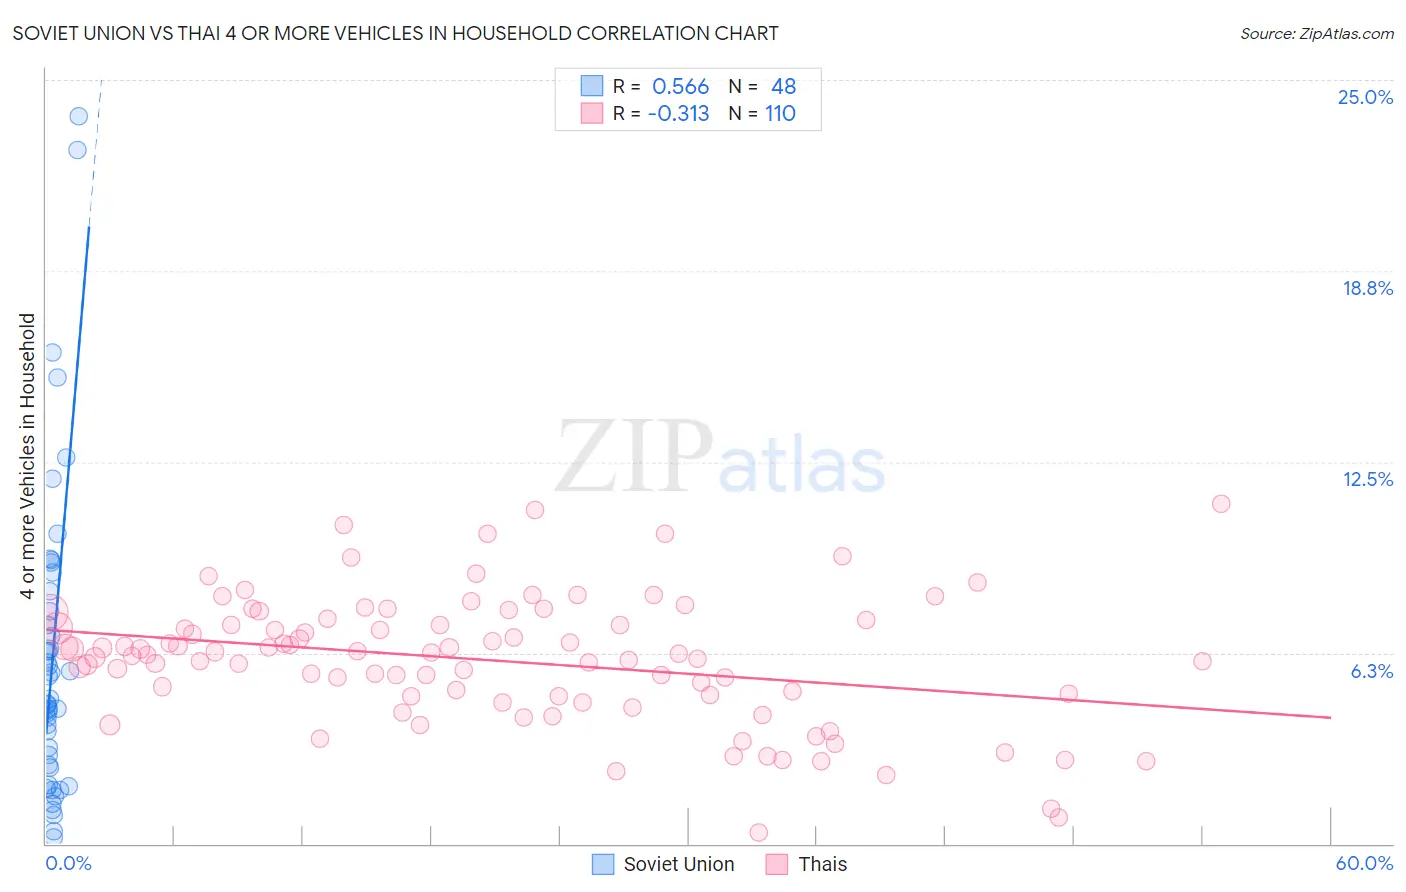
Soviet Union vs Thai 4 or more Vehicles in Household Correlation Chart
The statistical analysis conducted on geographies consisting of 43,372,100 people shows a substantial positive correlation between the proportion of Soviet Union and percentage of households with 4 or more vehicles available in the United States with a correlation coefficient (R) of 0.566 and weighted average of 4.4%. Similarly, the statistical analysis conducted on geographies consisting of 473,279,987 people shows a mild negative correlation between the proportion of Thais and percentage of households with 4 or more vehicles available in the United States with a correlation coefficient (R) of -0.313 and weighted average of 6.2%, a difference of 41.0%.
4 or more Vehicles in Household Correlation Summary
| Measurement | Soviet Union | Thai |
| Minimum | 0.22% | 0.38% |
| Maximum | 23.8% | 11.1% |
| Range | 23.6% | 10.7% |
| Mean | 6.2% | 6.0% |
| Median | 4.7% | 6.2% |
| Interquartile 25% (IQ1) | 2.6% | 4.8% |
| Interquartile 75% (IQ3) | 7.9% | 7.2% |
| Interquartile Range (IQR) | 5.4% | 2.3% |
| Standard Deviation (Sample) | 5.1% | 2.1% |
| Standard Deviation (Population) | 5.1% | 2.1% |
Similar Demographics by 4 or more Vehicles in Household
Demographics Similar to Soviet Union by 4 or more Vehicles in Household
In terms of 4 or more vehicles in household, the demographic groups most similar to Soviet Union are Immigrants from Caribbean (4.4%, a difference of 0.28%), Immigrants from Jamaica (4.4%, a difference of 0.32%), Cape Verdean (4.4%, a difference of 0.64%), Immigrants from Yemen (4.5%, a difference of 0.69%), and Ecuadorian (4.5%, a difference of 0.86%).
| Demographics | Rating | Rank | 4 or more Vehicles in Household |
| U.S. Virgin Islanders | 0.0 /100 | #317 | Tragic 4.6% |
| Jamaicans | 0.0 /100 | #318 | Tragic 4.6% |
| Haitians | 0.0 /100 | #319 | Tragic 4.6% |
| Immigrants | Haiti | 0.0 /100 | #320 | Tragic 4.5% |
| Ecuadorians | 0.0 /100 | #321 | Tragic 4.5% |
| Immigrants | Yemen | 0.0 /100 | #322 | Tragic 4.5% |
| Immigrants | Caribbean | 0.0 /100 | #323 | Tragic 4.4% |
| Soviet Union | 0.0 /100 | #324 | Tragic 4.4% |
| Immigrants | Jamaica | 0.0 /100 | #325 | Tragic 4.4% |
| Cape Verdeans | 0.0 /100 | #326 | Tragic 4.4% |
| Senegalese | 0.0 /100 | #327 | Tragic 4.3% |
| Trinidadians and Tobagonians | 0.0 /100 | #328 | Tragic 4.3% |
| Immigrants | Senegal | 0.0 /100 | #329 | Tragic 4.2% |
| Immigrants | Ecuador | 0.0 /100 | #330 | Tragic 4.2% |
| West Indians | 0.0 /100 | #331 | Tragic 4.2% |
Demographics Similar to Thais by 4 or more Vehicles in Household
In terms of 4 or more vehicles in household, the demographic groups most similar to Thais are Immigrants from Northern Europe (6.2%, a difference of 0.020%), Iraqi (6.2%, a difference of 0.040%), Immigrants from Burma/Myanmar (6.2%, a difference of 0.060%), Immigrants from South Africa (6.2%, a difference of 0.17%), and Kiowa (6.2%, a difference of 0.25%).
| Demographics | Rating | Rank | 4 or more Vehicles in Household |
| Belizeans | 44.5 /100 | #178 | Average 6.3% |
| Immigrants | Japan | 43.1 /100 | #179 | Average 6.3% |
| Syrians | 42.0 /100 | #180 | Average 6.3% |
| Yugoslavians | 41.1 /100 | #181 | Average 6.3% |
| South American Indians | 40.7 /100 | #182 | Average 6.3% |
| Immigrants | Burma/Myanmar | 37.5 /100 | #183 | Fair 6.2% |
| Iraqis | 37.3 /100 | #184 | Fair 6.2% |
| Thais | 36.9 /100 | #185 | Fair 6.2% |
| Immigrants | Northern Europe | 36.8 /100 | #186 | Fair 6.2% |
| Immigrants | South Africa | 35.4 /100 | #187 | Fair 6.2% |
| Kiowa | 34.7 /100 | #188 | Fair 6.2% |
| Immigrants | Eastern Asia | 33.3 /100 | #189 | Fair 6.2% |
| South Africans | 32.2 /100 | #190 | Fair 6.2% |
| Inupiat | 30.7 /100 | #191 | Fair 6.2% |
| Romanians | 30.7 /100 | #192 | Fair 6.2% |