Hawaiian vs Immigrants from Europe 2 or more Vehicles in Household
COMPARE
Hawaiian
Immigrants from Europe
2 or more Vehicles in Household
2 or more Vehicles in Household Comparison
Hawaiians
Immigrants from Europe
60.4%
2 OR MORE VEHICLES IN HOUSEHOLD
100.0/ 100
METRIC RATING
29th/ 347
METRIC RANK
53.2%
2 OR MORE VEHICLES IN HOUSEHOLD
2.1/ 100
METRIC RATING
240th/ 347
METRIC RANK
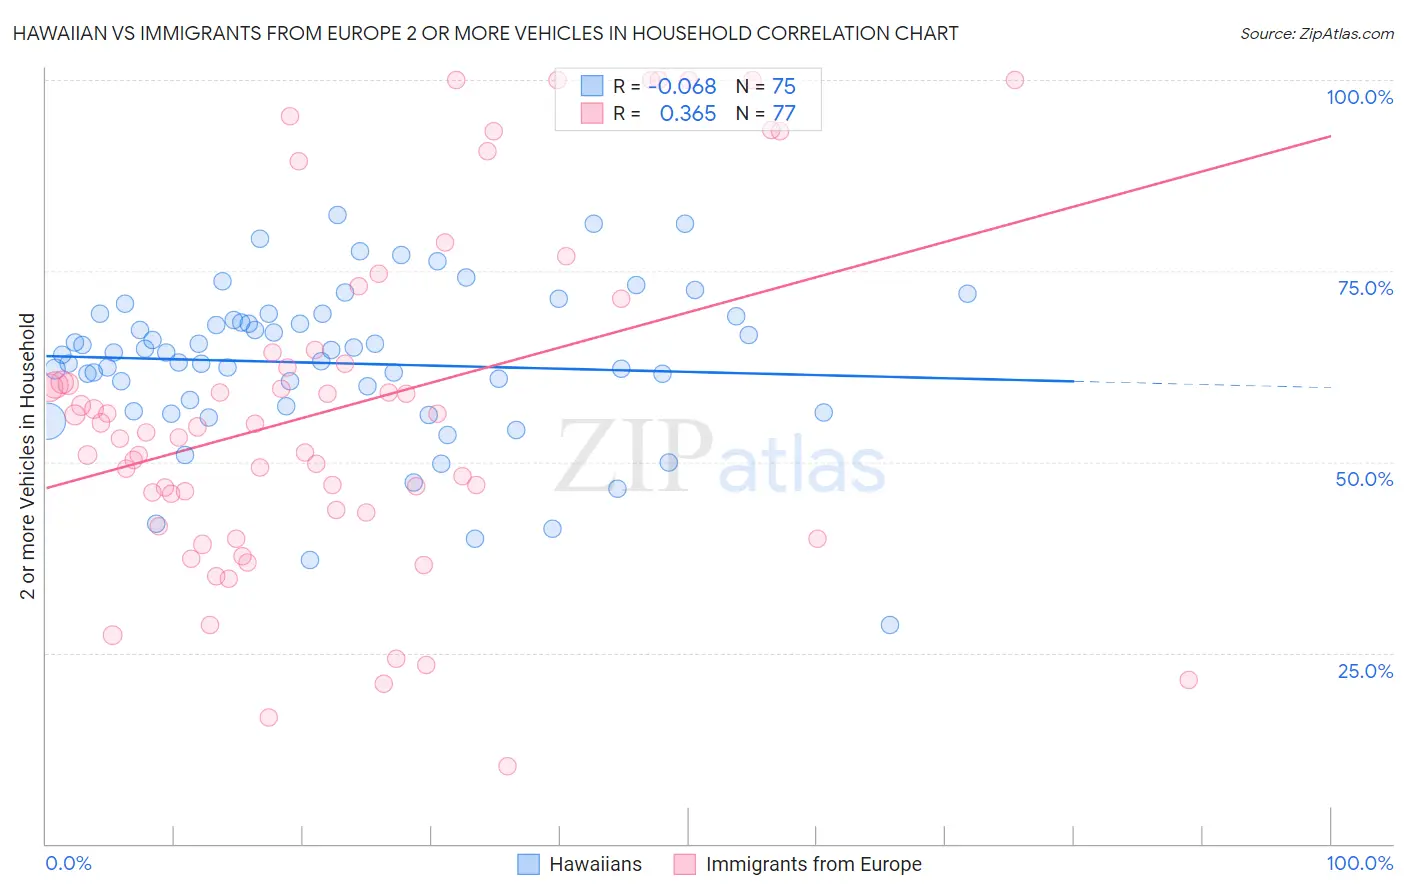
Hawaiian vs Immigrants from Europe 2 or more Vehicles in Household Correlation Chart
The statistical analysis conducted on geographies consisting of 327,414,018 people shows a slight negative correlation between the proportion of Hawaiians and percentage of households with 2 or more vehicles available in the United States with a correlation coefficient (R) of -0.068 and weighted average of 60.4%. Similarly, the statistical analysis conducted on geographies consisting of 546,948,405 people shows a mild positive correlation between the proportion of Immigrants from Europe and percentage of households with 2 or more vehicles available in the United States with a correlation coefficient (R) of 0.365 and weighted average of 53.2%, a difference of 13.5%.
2 or more Vehicles in Household Correlation Summary
| Measurement | Hawaiian | Immigrants from Europe |
| Minimum | 28.6% | 10.1% |
| Maximum | 82.3% | 100.0% |
| Range | 53.7% | 89.9% |
| Mean | 62.9% | 57.0% |
| Median | 64.3% | 54.6% |
| Interquartile 25% (IQ1) | 57.2% | 43.6% |
| Interquartile 75% (IQ3) | 69.1% | 64.5% |
| Interquartile Range (IQR) | 11.8% | 20.9% |
| Standard Deviation (Sample) | 10.3% | 22.4% |
| Standard Deviation (Population) | 10.3% | 22.2% |
Similar Demographics by 2 or more Vehicles in Household
Demographics Similar to Hawaiians by 2 or more Vehicles in Household
In terms of 2 or more vehicles in household, the demographic groups most similar to Hawaiians are Guamanian/Chamorro (60.5%, a difference of 0.11%), Finnish (60.3%, a difference of 0.13%), Spanish American Indian (60.3%, a difference of 0.16%), Assyrian/Chaldean/Syriac (60.5%, a difference of 0.23%), and Arapaho (60.2%, a difference of 0.26%).
| Demographics | Rating | Rank | 2 or more Vehicles in Household |
| Swiss | 100.0 /100 | #22 | Exceptional 61.0% |
| Scotch-Irish | 100.0 /100 | #23 | Exceptional 60.9% |
| Immigrants | Vietnam | 100.0 /100 | #24 | Exceptional 60.9% |
| Whites/Caucasians | 100.0 /100 | #25 | Exceptional 60.8% |
| Welsh | 100.0 /100 | #26 | Exceptional 60.8% |
| Assyrians/Chaldeans/Syriacs | 100.0 /100 | #27 | Exceptional 60.5% |
| Guamanians/Chamorros | 100.0 /100 | #28 | Exceptional 60.5% |
| Hawaiians | 100.0 /100 | #29 | Exceptional 60.4% |
| Finns | 100.0 /100 | #30 | Exceptional 60.3% |
| Spanish American Indians | 100.0 /100 | #31 | Exceptional 60.3% |
| Arapaho | 100.0 /100 | #32 | Exceptional 60.2% |
| Immigrants | Mexico | 100.0 /100 | #33 | Exceptional 60.2% |
| Spanish | 100.0 /100 | #34 | Exceptional 60.2% |
| Immigrants | Philippines | 100.0 /100 | #35 | Exceptional 60.1% |
| Chinese | 100.0 /100 | #36 | Exceptional 60.1% |
Demographics Similar to Immigrants from Europe by 2 or more Vehicles in Household
In terms of 2 or more vehicles in household, the demographic groups most similar to Immigrants from Europe are Immigrants from Sierra Leone (53.2%, a difference of 0.030%), Immigrants from Eastern Asia (53.2%, a difference of 0.030%), Immigrants from Armenia (53.3%, a difference of 0.070%), Cambodian (53.3%, a difference of 0.070%), and Macedonian (53.3%, a difference of 0.14%).
| Demographics | Rating | Rank | 2 or more Vehicles in Household |
| Ugandans | 3.2 /100 | #233 | Tragic 53.5% |
| Immigrants | Switzerland | 3.0 /100 | #234 | Tragic 53.4% |
| Immigrants | Middle Africa | 3.0 /100 | #235 | Tragic 53.4% |
| Indonesians | 2.7 /100 | #236 | Tragic 53.4% |
| Macedonians | 2.4 /100 | #237 | Tragic 53.3% |
| Immigrants | Armenia | 2.3 /100 | #238 | Tragic 53.3% |
| Cambodians | 2.3 /100 | #239 | Tragic 53.3% |
| Immigrants | Europe | 2.1 /100 | #240 | Tragic 53.2% |
| Immigrants | Sierra Leone | 2.1 /100 | #241 | Tragic 53.2% |
| Immigrants | Eastern Asia | 2.1 /100 | #242 | Tragic 53.2% |
| Ethiopians | 1.7 /100 | #243 | Tragic 53.1% |
| Indians (Asian) | 1.7 /100 | #244 | Tragic 53.1% |
| Immigrants | Ethiopia | 1.5 /100 | #245 | Tragic 53.0% |
| Immigrants | Nigeria | 1.2 /100 | #246 | Tragic 52.9% |
| Sierra Leoneans | 1.2 /100 | #247 | Tragic 52.9% |