Eastern European vs Immigrants from Central America 2 or more Vehicles in Household
COMPARE
Eastern European
Immigrants from Central America
2 or more Vehicles in Household
2 or more Vehicles in Household Comparison
Eastern Europeans
Immigrants from Central America
54.8%
2 OR MORE VEHICLES IN HOUSEHOLD
27.5/ 100
METRIC RATING
189th/ 347
METRIC RANK
58.6%
2 OR MORE VEHICLES IN HOUSEHOLD
99.7/ 100
METRIC RATING
65th/ 347
METRIC RANK
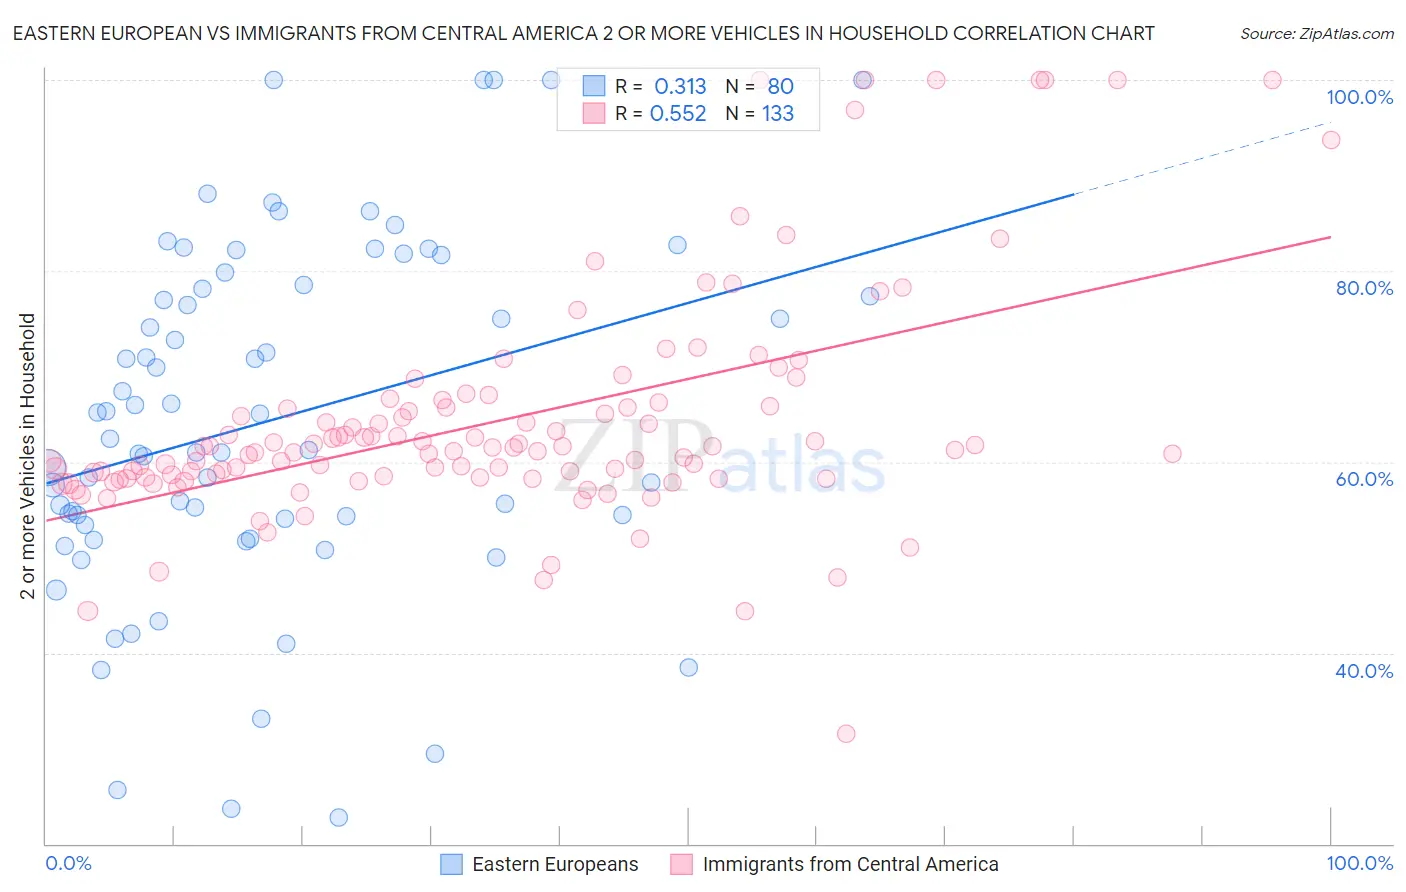
Eastern European vs Immigrants from Central America 2 or more Vehicles in Household Correlation Chart
The statistical analysis conducted on geographies consisting of 460,977,984 people shows a mild positive correlation between the proportion of Eastern Europeans and percentage of households with 2 or more vehicles available in the United States with a correlation coefficient (R) of 0.313 and weighted average of 54.8%. Similarly, the statistical analysis conducted on geographies consisting of 536,122,766 people shows a substantial positive correlation between the proportion of Immigrants from Central America and percentage of households with 2 or more vehicles available in the United States with a correlation coefficient (R) of 0.552 and weighted average of 58.6%, a difference of 6.9%.
2 or more Vehicles in Household Correlation Summary
| Measurement | Eastern European | Immigrants from Central America |
| Minimum | 22.8% | 31.6% |
| Maximum | 100.0% | 100.0% |
| Range | 77.2% | 68.4% |
| Mean | 64.3% | 64.2% |
| Median | 61.9% | 61.2% |
| Interquartile 25% (IQ1) | 53.7% | 58.3% |
| Interquartile 75% (IQ3) | 78.3% | 65.7% |
| Interquartile Range (IQR) | 24.6% | 7.4% |
| Standard Deviation (Sample) | 18.3% | 12.0% |
| Standard Deviation (Population) | 18.2% | 12.0% |
Similar Demographics by 2 or more Vehicles in Household
Demographics Similar to Eastern Europeans by 2 or more Vehicles in Household
In terms of 2 or more vehicles in household, the demographic groups most similar to Eastern Europeans are Russian (54.8%, a difference of 0.060%), Immigrants (54.7%, a difference of 0.13%), Marshallese (54.9%, a difference of 0.15%), Immigrants from Romania (54.7%, a difference of 0.20%), and Immigrants from Japan (54.7%, a difference of 0.22%).
| Demographics | Rating | Rank | 2 or more Vehicles in Household |
| Cree | 38.2 /100 | #182 | Fair 55.1% |
| Immigrants | Cameroon | 37.3 /100 | #183 | Fair 55.1% |
| Apache | 36.7 /100 | #184 | Fair 55.1% |
| Arabs | 35.9 /100 | #185 | Fair 55.0% |
| Peruvians | 33.7 /100 | #186 | Fair 55.0% |
| Immigrants | Uganda | 33.4 /100 | #187 | Fair 55.0% |
| Marshallese | 30.5 /100 | #188 | Fair 54.9% |
| Eastern Europeans | 27.5 /100 | #189 | Fair 54.8% |
| Russians | 26.3 /100 | #190 | Fair 54.8% |
| Immigrants | Immigrants | 25.0 /100 | #191 | Fair 54.7% |
| Immigrants | Romania | 23.8 /100 | #192 | Fair 54.7% |
| Immigrants | Japan | 23.4 /100 | #193 | Fair 54.7% |
| Central Americans | 23.0 /100 | #194 | Fair 54.7% |
| Iroquois | 22.6 /100 | #195 | Fair 54.7% |
| Immigrants | Poland | 19.3 /100 | #196 | Poor 54.6% |
Demographics Similar to Immigrants from Central America by 2 or more Vehicles in Household
In terms of 2 or more vehicles in household, the demographic groups most similar to Immigrants from Central America are Croatian (58.6%, a difference of 0.010%), Laotian (58.6%, a difference of 0.020%), Canadian (58.6%, a difference of 0.040%), Portuguese (58.6%, a difference of 0.050%), and Pennsylvania German (58.5%, a difference of 0.16%).
| Demographics | Rating | Rank | 2 or more Vehicles in Household |
| Immigrants | Scotland | 99.8 /100 | #58 | Exceptional 58.9% |
| Spanish Americans | 99.8 /100 | #59 | Exceptional 58.9% |
| French Canadians | 99.8 /100 | #60 | Exceptional 58.9% |
| Osage | 99.8 /100 | #61 | Exceptional 58.8% |
| Immigrants | Nonimmigrants | 99.8 /100 | #62 | Exceptional 58.8% |
| Mexican American Indians | 99.8 /100 | #63 | Exceptional 58.7% |
| Portuguese | 99.7 /100 | #64 | Exceptional 58.6% |
| Immigrants | Central America | 99.7 /100 | #65 | Exceptional 58.6% |
| Croatians | 99.7 /100 | #66 | Exceptional 58.6% |
| Laotians | 99.7 /100 | #67 | Exceptional 58.6% |
| Canadians | 99.7 /100 | #68 | Exceptional 58.6% |
| Pennsylvania Germans | 99.7 /100 | #69 | Exceptional 58.5% |
| Italians | 99.6 /100 | #70 | Exceptional 58.4% |
| Bangladeshis | 99.6 /100 | #71 | Exceptional 58.4% |
| Austrians | 99.6 /100 | #72 | Exceptional 58.4% |