Croatian vs Immigrants from Central America 2 or more Vehicles in Household
COMPARE
Croatian
Immigrants from Central America
2 or more Vehicles in Household
2 or more Vehicles in Household Comparison
Croatians
Immigrants from Central America
58.6%
2 OR MORE VEHICLES IN HOUSEHOLD
99.7/ 100
METRIC RATING
66th/ 347
METRIC RANK
58.6%
2 OR MORE VEHICLES IN HOUSEHOLD
99.7/ 100
METRIC RATING
65th/ 347
METRIC RANK
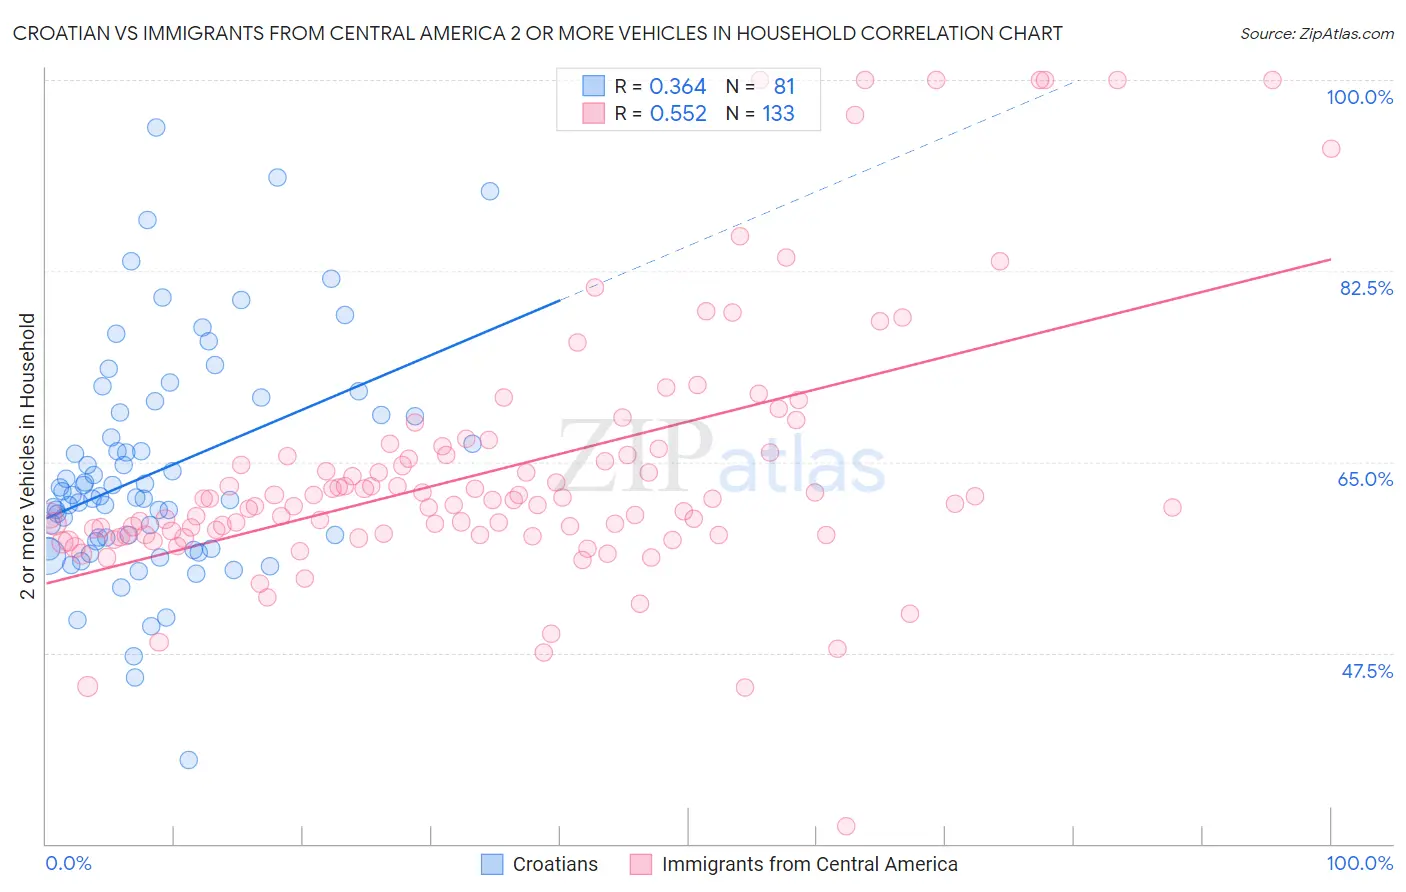
Croatian vs Immigrants from Central America 2 or more Vehicles in Household Correlation Chart
The statistical analysis conducted on geographies consisting of 375,571,989 people shows a mild positive correlation between the proportion of Croatians and percentage of households with 2 or more vehicles available in the United States with a correlation coefficient (R) of 0.364 and weighted average of 58.6%. Similarly, the statistical analysis conducted on geographies consisting of 536,122,766 people shows a substantial positive correlation between the proportion of Immigrants from Central America and percentage of households with 2 or more vehicles available in the United States with a correlation coefficient (R) of 0.552 and weighted average of 58.6%, a difference of 0.010%.
2 or more Vehicles in Household Correlation Summary
| Measurement | Croatian | Immigrants from Central America |
| Minimum | 37.6% | 31.6% |
| Maximum | 95.6% | 100.0% |
| Range | 57.9% | 68.4% |
| Mean | 64.1% | 64.2% |
| Median | 61.9% | 61.2% |
| Interquartile 25% (IQ1) | 57.4% | 58.3% |
| Interquartile 75% (IQ3) | 69.4% | 65.7% |
| Interquartile Range (IQR) | 12.0% | 7.4% |
| Standard Deviation (Sample) | 10.4% | 12.0% |
| Standard Deviation (Population) | 10.3% | 12.0% |
Demographics Similar to Croatians and Immigrants from Central America by 2 or more Vehicles in Household
In terms of 2 or more vehicles in household, the demographic groups most similar to Croatians are Laotian (58.6%, a difference of 0.020%), Canadian (58.6%, a difference of 0.030%), Portuguese (58.6%, a difference of 0.060%), Pennsylvania German (58.5%, a difference of 0.15%), and Mexican American Indian (58.7%, a difference of 0.21%). Similarly, the demographic groups most similar to Immigrants from Central America are Laotian (58.6%, a difference of 0.020%), Canadian (58.6%, a difference of 0.040%), Portuguese (58.6%, a difference of 0.050%), Pennsylvania German (58.5%, a difference of 0.16%), and Mexican American Indian (58.7%, a difference of 0.21%).
| Demographics | Rating | Rank | 2 or more Vehicles in Household |
| Luxembourgers | 99.9 /100 | #55 | Exceptional 59.1% |
| Chickasaw | 99.9 /100 | #56 | Exceptional 59.0% |
| Afghans | 99.9 /100 | #57 | Exceptional 59.0% |
| Immigrants | Scotland | 99.8 /100 | #58 | Exceptional 58.9% |
| Spanish Americans | 99.8 /100 | #59 | Exceptional 58.9% |
| French Canadians | 99.8 /100 | #60 | Exceptional 58.9% |
| Osage | 99.8 /100 | #61 | Exceptional 58.8% |
| Immigrants | Nonimmigrants | 99.8 /100 | #62 | Exceptional 58.8% |
| Mexican American Indians | 99.8 /100 | #63 | Exceptional 58.7% |
| Portuguese | 99.7 /100 | #64 | Exceptional 58.6% |
| Immigrants | Central America | 99.7 /100 | #65 | Exceptional 58.6% |
| Croatians | 99.7 /100 | #66 | Exceptional 58.6% |
| Laotians | 99.7 /100 | #67 | Exceptional 58.6% |
| Canadians | 99.7 /100 | #68 | Exceptional 58.6% |
| Pennsylvania Germans | 99.7 /100 | #69 | Exceptional 58.5% |
| Italians | 99.6 /100 | #70 | Exceptional 58.4% |
| Bangladeshis | 99.6 /100 | #71 | Exceptional 58.4% |
| Austrians | 99.6 /100 | #72 | Exceptional 58.4% |
| Bolivians | 99.6 /100 | #73 | Exceptional 58.3% |
| Immigrants | Afghanistan | 99.6 /100 | #74 | Exceptional 58.3% |
| Poles | 99.5 /100 | #75 | Exceptional 58.3% |