South African vs Immigrants from Russia 3 or more Vehicles in Household
COMPARE
South African
Immigrants from Russia
3 or more Vehicles in Household
3 or more Vehicles in Household Comparison
South Africans
Immigrants from Russia
19.3%
3 OR MORE VEHICLES IN HOUSEHOLD
37.5/ 100
METRIC RATING
180th/ 347
METRIC RANK
16.9%
3 OR MORE VEHICLES IN HOUSEHOLD
0.1/ 100
METRIC RATING
295th/ 347
METRIC RANK
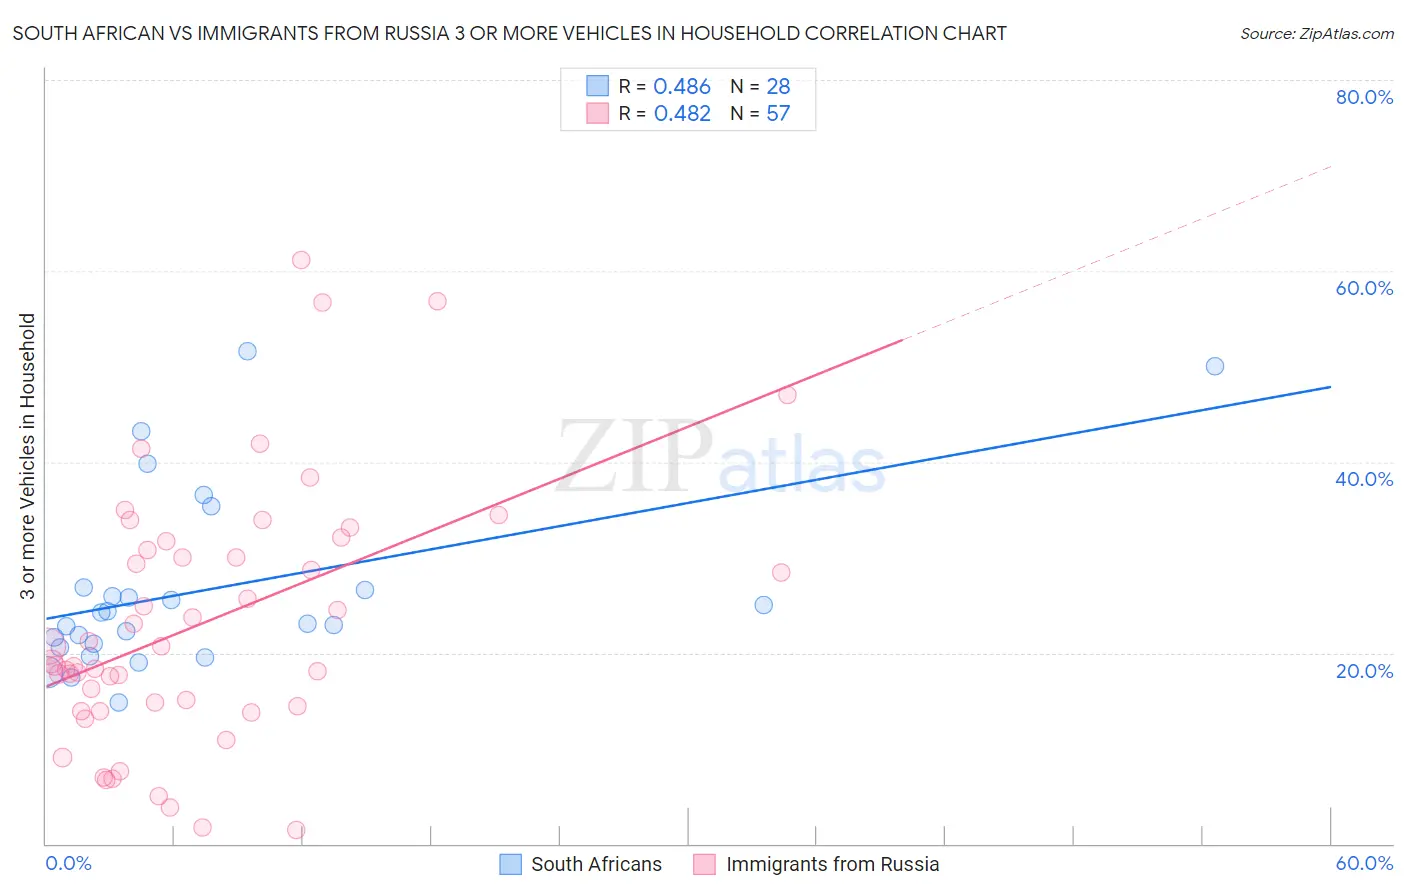
South African vs Immigrants from Russia 3 or more Vehicles in Household Correlation Chart
The statistical analysis conducted on geographies consisting of 182,514,057 people shows a moderate positive correlation between the proportion of South Africans and percentage of households with 3 or more vehicles available in the United States with a correlation coefficient (R) of 0.486 and weighted average of 19.3%. Similarly, the statistical analysis conducted on geographies consisting of 347,621,563 people shows a moderate positive correlation between the proportion of Immigrants from Russia and percentage of households with 3 or more vehicles available in the United States with a correlation coefficient (R) of 0.482 and weighted average of 16.9%, a difference of 14.2%.
3 or more Vehicles in Household Correlation Summary
| Measurement | South African | Immigrants from Russia |
| Minimum | 14.8% | 1.4% |
| Maximum | 51.6% | 61.1% |
| Range | 36.8% | 59.7% |
| Mean | 26.6% | 23.0% |
| Median | 23.6% | 19.1% |
| Interquartile 25% (IQ1) | 20.8% | 14.1% |
| Interquartile 75% (IQ3) | 26.7% | 31.2% |
| Interquartile Range (IQR) | 6.0% | 17.1% |
| Standard Deviation (Sample) | 9.5% | 13.5% |
| Standard Deviation (Population) | 9.3% | 13.3% |
Similar Demographics by 3 or more Vehicles in Household
Demographics Similar to South Africans by 3 or more Vehicles in Household
In terms of 3 or more vehicles in household, the demographic groups most similar to South Africans are Romanian (19.3%, a difference of 0.030%), Cuban (19.3%, a difference of 0.070%), Immigrants from South Central Asia (19.3%, a difference of 0.11%), Cajun (19.3%, a difference of 0.13%), and Latvian (19.3%, a difference of 0.15%).
| Demographics | Rating | Rank | 3 or more Vehicles in Household |
| Immigrants | Northern Europe | 50.2 /100 | #173 | Average 19.5% |
| Immigrants | South Africa | 50.0 /100 | #174 | Average 19.5% |
| Syrians | 47.0 /100 | #175 | Average 19.5% |
| Iroquois | 46.0 /100 | #176 | Average 19.4% |
| Immigrants | Peru | 41.1 /100 | #177 | Average 19.4% |
| Immigrants | Syria | 40.3 /100 | #178 | Average 19.4% |
| Immigrants | South Central Asia | 38.9 /100 | #179 | Fair 19.3% |
| South Africans | 37.5 /100 | #180 | Fair 19.3% |
| Romanians | 37.1 /100 | #181 | Fair 19.3% |
| Cubans | 36.6 /100 | #182 | Fair 19.3% |
| Cajuns | 36.0 /100 | #183 | Fair 19.3% |
| Latvians | 35.7 /100 | #184 | Fair 19.3% |
| Immigrants | Sri Lanka | 30.7 /100 | #185 | Fair 19.2% |
| Immigrants | Sweden | 29.0 /100 | #186 | Fair 19.2% |
| Immigrants | Hong Kong | 28.3 /100 | #187 | Fair 19.2% |
Demographics Similar to Immigrants from Russia by 3 or more Vehicles in Household
In terms of 3 or more vehicles in household, the demographic groups most similar to Immigrants from Russia are Immigrants from Western Africa (16.9%, a difference of 0.050%), Bahamian (16.9%, a difference of 0.16%), Immigrants from Spain (17.0%, a difference of 0.25%), Immigrants from Congo (17.0%, a difference of 0.36%), and Inupiat (16.9%, a difference of 0.36%).
| Demographics | Rating | Rank | 3 or more Vehicles in Household |
| Immigrants | Uruguay | 0.2 /100 | #288 | Tragic 17.1% |
| Immigrants | Liberia | 0.1 /100 | #289 | Tragic 17.1% |
| Liberians | 0.1 /100 | #290 | Tragic 17.0% |
| Immigrants | Congo | 0.1 /100 | #291 | Tragic 17.0% |
| Immigrants | Spain | 0.1 /100 | #292 | Tragic 17.0% |
| Bahamians | 0.1 /100 | #293 | Tragic 16.9% |
| Immigrants | Western Africa | 0.1 /100 | #294 | Tragic 16.9% |
| Immigrants | Russia | 0.1 /100 | #295 | Tragic 16.9% |
| Inupiat | 0.1 /100 | #296 | Tragic 16.9% |
| Israelis | 0.1 /100 | #297 | Tragic 16.8% |
| Immigrants | Zaire | 0.1 /100 | #298 | Tragic 16.7% |
| Immigrants | South America | 0.1 /100 | #299 | Tragic 16.7% |
| Cypriots | 0.0 /100 | #300 | Tragic 16.6% |
| Paraguayans | 0.0 /100 | #301 | Tragic 16.6% |
| Immigrants | Greece | 0.0 /100 | #302 | Tragic 16.5% |