Sudanese vs Immigrants from Russia 3 or more Vehicles in Household
COMPARE
Sudanese
Immigrants from Russia
3 or more Vehicles in Household
3 or more Vehicles in Household Comparison
Sudanese
Immigrants from Russia
17.8%
3 OR MORE VEHICLES IN HOUSEHOLD
1.1/ 100
METRIC RATING
258th/ 347
METRIC RANK
16.9%
3 OR MORE VEHICLES IN HOUSEHOLD
0.1/ 100
METRIC RATING
295th/ 347
METRIC RANK
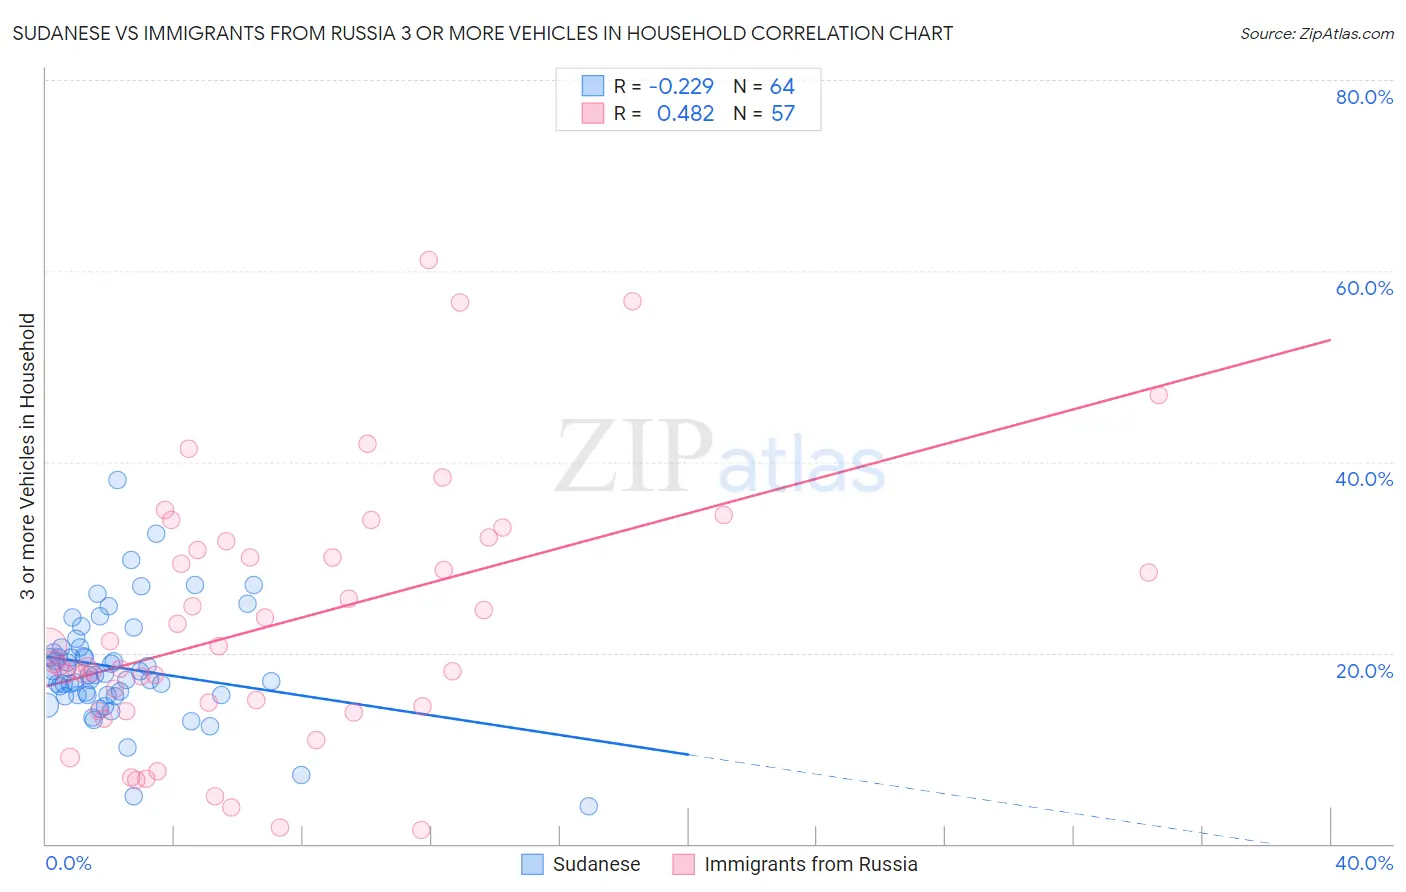
Sudanese vs Immigrants from Russia 3 or more Vehicles in Household Correlation Chart
The statistical analysis conducted on geographies consisting of 110,082,640 people shows a weak negative correlation between the proportion of Sudanese and percentage of households with 3 or more vehicles available in the United States with a correlation coefficient (R) of -0.229 and weighted average of 17.8%. Similarly, the statistical analysis conducted on geographies consisting of 347,621,563 people shows a moderate positive correlation between the proportion of Immigrants from Russia and percentage of households with 3 or more vehicles available in the United States with a correlation coefficient (R) of 0.482 and weighted average of 16.9%, a difference of 5.5%.
3 or more Vehicles in Household Correlation Summary
| Measurement | Sudanese | Immigrants from Russia |
| Minimum | 3.9% | 1.4% |
| Maximum | 38.1% | 61.1% |
| Range | 34.2% | 59.7% |
| Mean | 18.4% | 23.0% |
| Median | 17.7% | 19.1% |
| Interquartile 25% (IQ1) | 15.6% | 14.1% |
| Interquartile 75% (IQ3) | 20.3% | 31.2% |
| Interquartile Range (IQR) | 4.7% | 17.1% |
| Standard Deviation (Sample) | 5.7% | 13.5% |
| Standard Deviation (Population) | 5.7% | 13.3% |
Similar Demographics by 3 or more Vehicles in Household
Demographics Similar to Sudanese by 3 or more Vehicles in Household
In terms of 3 or more vehicles in household, the demographic groups most similar to Sudanese are Immigrants from Eritrea (17.8%, a difference of 0.0%), Subsaharan African (17.9%, a difference of 0.050%), Immigrants from Turkey (17.9%, a difference of 0.20%), Uruguayan (17.8%, a difference of 0.22%), and Immigrants from Ethiopia (17.9%, a difference of 0.23%).
| Demographics | Rating | Rank | 3 or more Vehicles in Household |
| Alsatians | 1.5 /100 | #251 | Tragic 18.0% |
| Immigrants | Southern Europe | 1.4 /100 | #252 | Tragic 17.9% |
| Immigrants | Ethiopia | 1.3 /100 | #253 | Tragic 17.9% |
| Ethiopians | 1.2 /100 | #254 | Tragic 17.9% |
| Immigrants | Turkey | 1.2 /100 | #255 | Tragic 17.9% |
| Sub-Saharan Africans | 1.1 /100 | #256 | Tragic 17.9% |
| Immigrants | Eritrea | 1.1 /100 | #257 | Tragic 17.8% |
| Sudanese | 1.1 /100 | #258 | Tragic 17.8% |
| Uruguayans | 1.0 /100 | #259 | Tragic 17.8% |
| Ugandans | 0.9 /100 | #260 | Tragic 17.8% |
| Immigrants | Northern Africa | 0.9 /100 | #261 | Tragic 17.8% |
| Colombians | 0.9 /100 | #262 | Tragic 17.8% |
| Bermudans | 0.9 /100 | #263 | Tragic 17.8% |
| Cambodians | 0.9 /100 | #264 | Tragic 17.8% |
| Immigrants | Panama | 0.8 /100 | #265 | Tragic 17.7% |
Demographics Similar to Immigrants from Russia by 3 or more Vehicles in Household
In terms of 3 or more vehicles in household, the demographic groups most similar to Immigrants from Russia are Immigrants from Western Africa (16.9%, a difference of 0.050%), Bahamian (16.9%, a difference of 0.16%), Immigrants from Spain (17.0%, a difference of 0.25%), Immigrants from Congo (17.0%, a difference of 0.36%), and Inupiat (16.9%, a difference of 0.36%).
| Demographics | Rating | Rank | 3 or more Vehicles in Household |
| Immigrants | Uruguay | 0.2 /100 | #288 | Tragic 17.1% |
| Immigrants | Liberia | 0.1 /100 | #289 | Tragic 17.1% |
| Liberians | 0.1 /100 | #290 | Tragic 17.0% |
| Immigrants | Congo | 0.1 /100 | #291 | Tragic 17.0% |
| Immigrants | Spain | 0.1 /100 | #292 | Tragic 17.0% |
| Bahamians | 0.1 /100 | #293 | Tragic 16.9% |
| Immigrants | Western Africa | 0.1 /100 | #294 | Tragic 16.9% |
| Immigrants | Russia | 0.1 /100 | #295 | Tragic 16.9% |
| Inupiat | 0.1 /100 | #296 | Tragic 16.9% |
| Israelis | 0.1 /100 | #297 | Tragic 16.8% |
| Immigrants | Zaire | 0.1 /100 | #298 | Tragic 16.7% |
| Immigrants | South America | 0.1 /100 | #299 | Tragic 16.7% |
| Cypriots | 0.0 /100 | #300 | Tragic 16.6% |
| Paraguayans | 0.0 /100 | #301 | Tragic 16.6% |
| Immigrants | Greece | 0.0 /100 | #302 | Tragic 16.5% |